
Figure 1
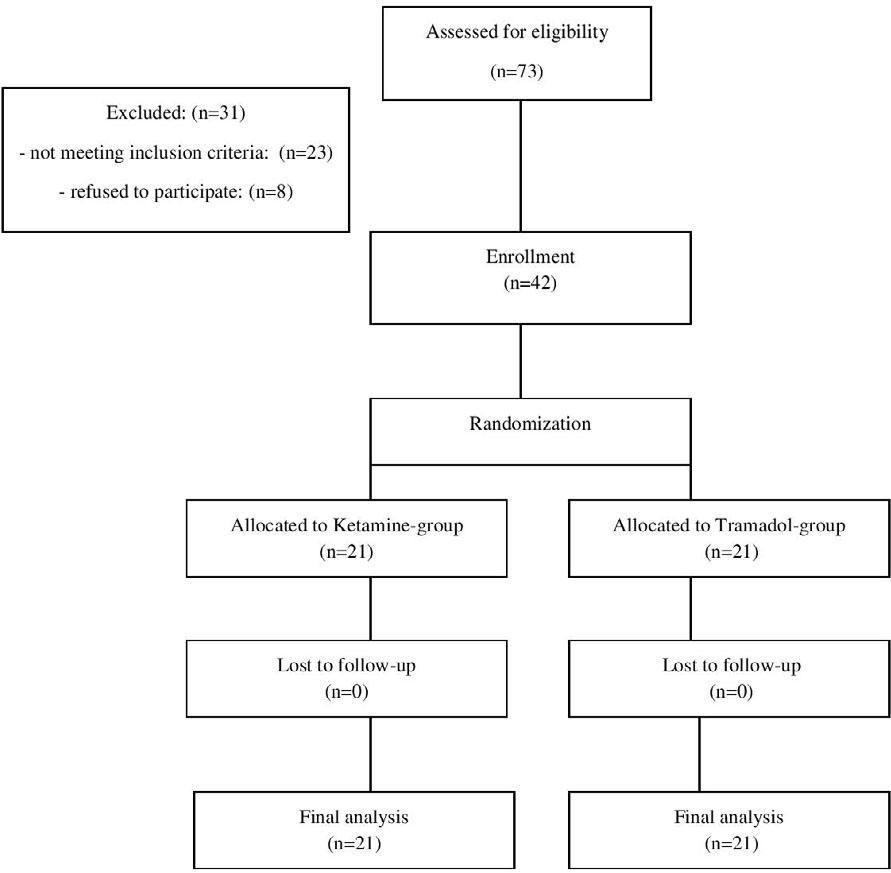
Figure 2
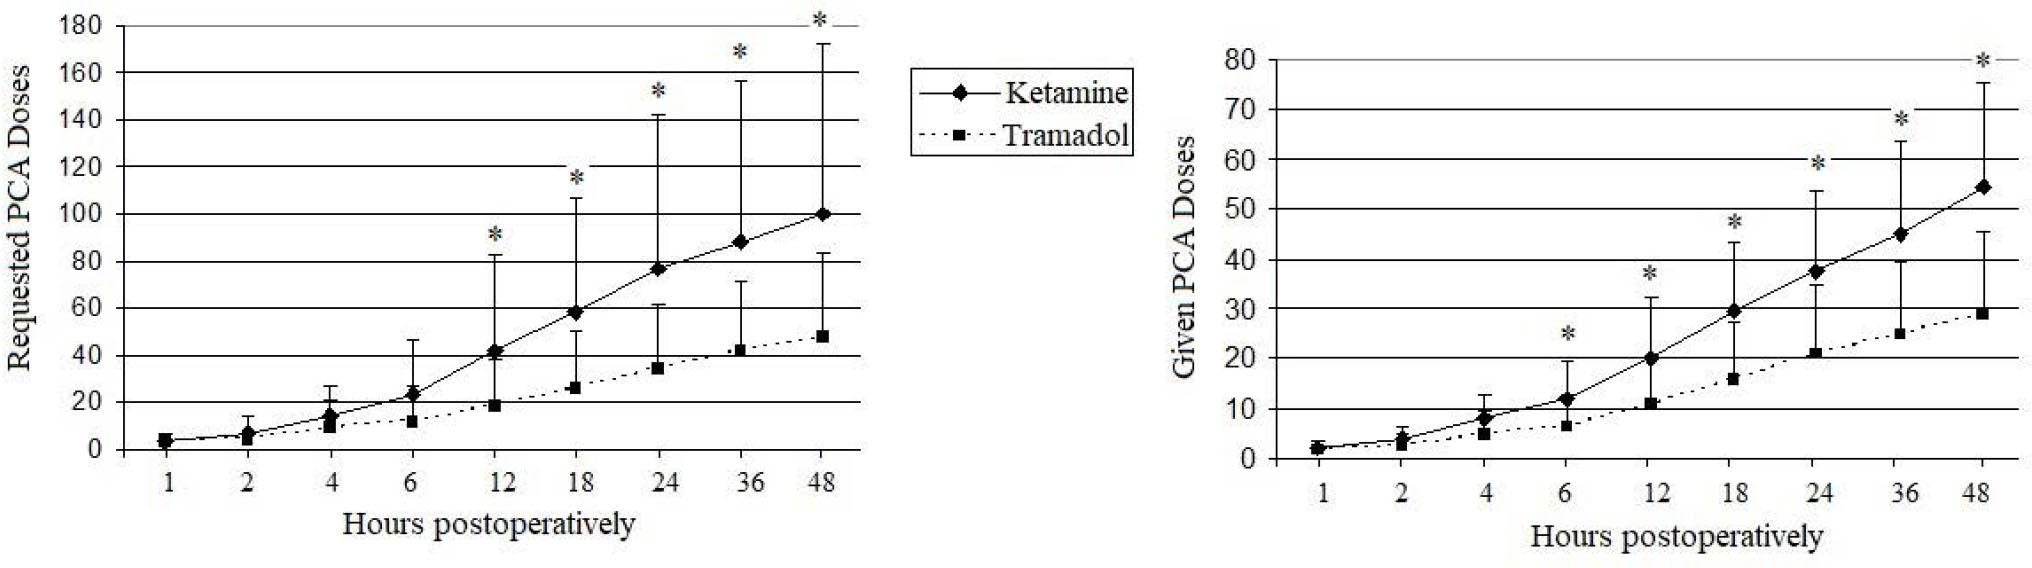
Figure 3
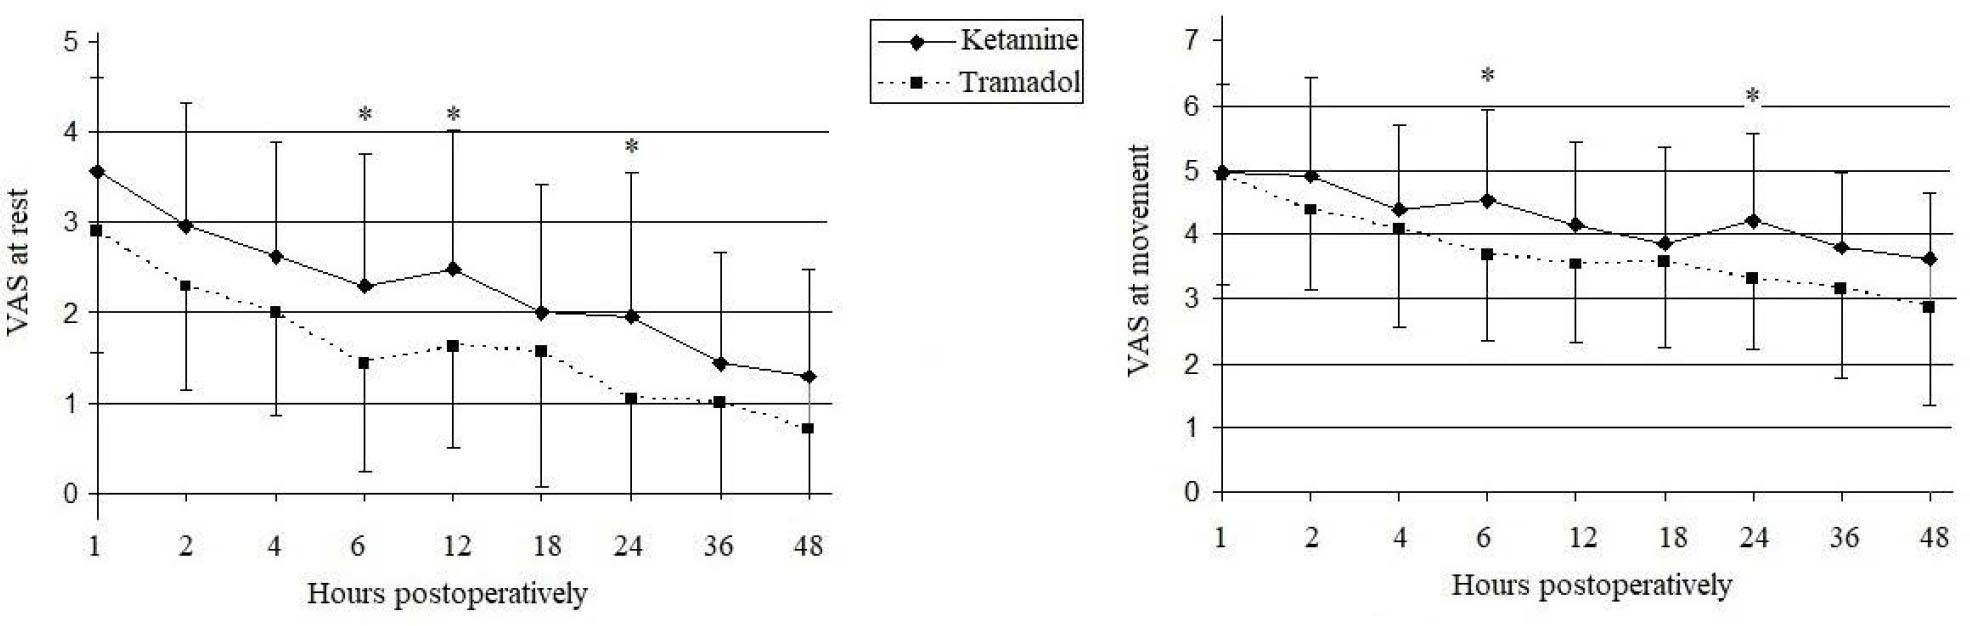
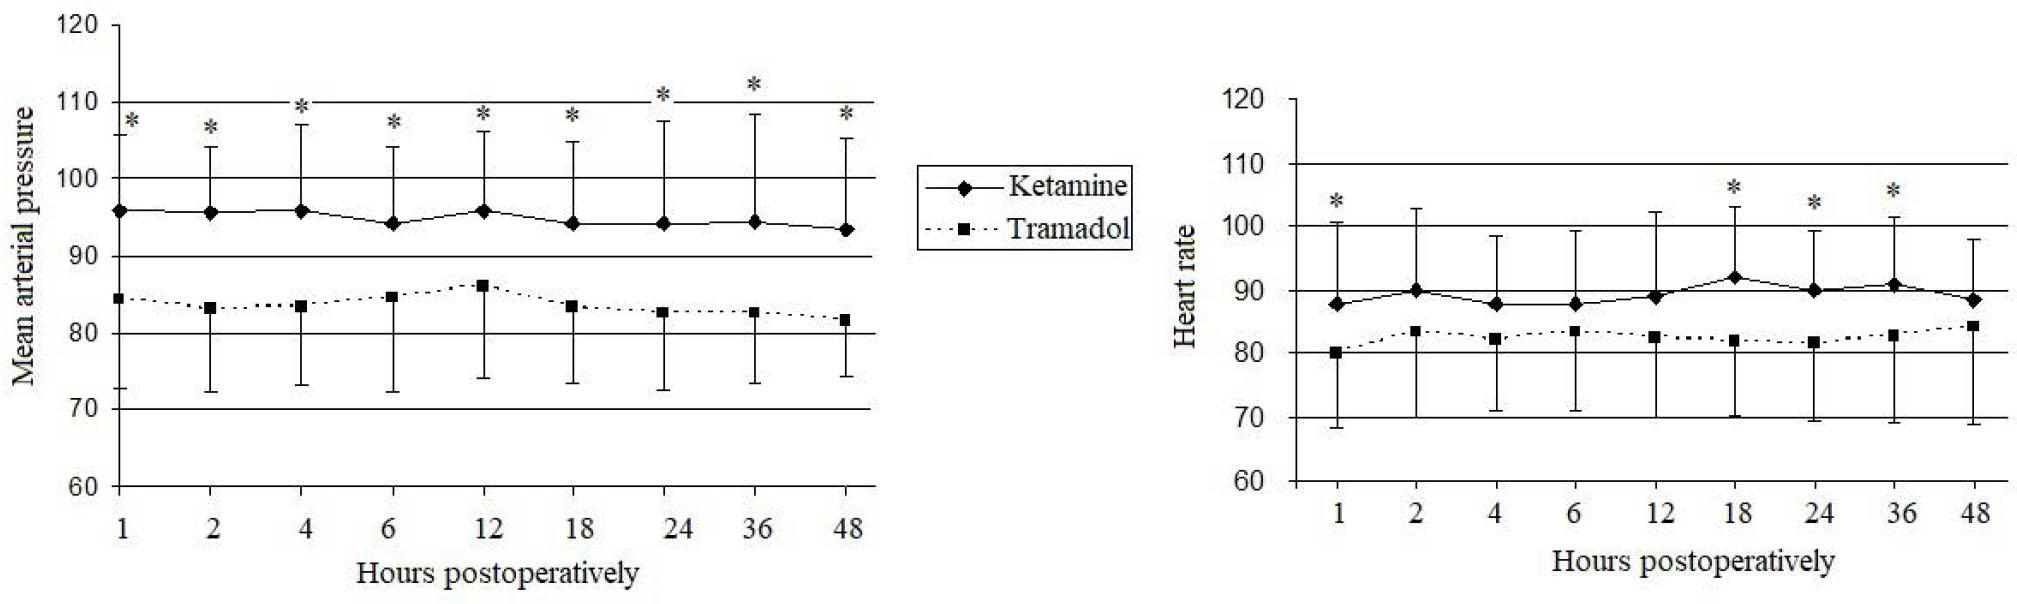
Figure 4
Intraoperative and postoperative morphine administration and PCA morphine pump initiation, by group
| Morphine administration | Study group | p Value | |
|---|---|---|---|
| Ketamine group (n = 21) | Tramadol group (n = 21) | ||
| Intraoperative (bolus, mg) | 16.614 (5.22) | 15.79 (4.59) | 0.59 |
| PACU (bolus, mg) | 4 [0–6] | 2 [0–4] | 0.341 |
| Ward (bolus, mg) | 0 [0–0] | 0 [0–0] | 0.146 |
| Time to PCA morphine pump start from tramadol/ketamine pump start (minutes) | 95.62 (46.14) | 87.24 (44.81) | 0.554 |
| PCA administration (mg) | 54.524 (20.846) | 28.905 (16.504) | <0.001 |
| Total morphine (mg) | 60.714 (20.03) | 32.428 (18.17) | <0.001 |
Side effects related to analgesia protocol, by group
| Study group | p Value | ||
|---|---|---|---|
| Ketamine group (n = 21) | Tramadol group (n = 21) | ||
| Sedation (1, awake; 2, medium sedation/wakes up easily; 3, mostly sedated does not wake up easily; 4, unarousable) | |||
| 1st hour (1/2/3) | 3 (14.29%)/14 (66.67%)/4 (19.05%) | 1 (4.76%)/13 (61.9%)/7 (33.33%) | 0.408 |
| 2nd hour (1/2/3) | 3 (14.29%)/15 (71.43%)/3 (14.29%) | 4 (19.05%)/12 (57.14%)/5 (23.81%) | 0.671 |
| 4th hour (1/2/3) | 5 (23.81%)/15 (71.43%)/1 (4.76%) | 7 (33.33%)/12 (57.14%)/2 (9.52%) | 0.616 |
| 6th hour (1/2) | 12 (57.14%)/9 (42.86%) | 12 (57.14%)/9 (42.86%) | 0.999 |
| 12th hour (1/2) | 16 (76.19%)/5 (23.81%) | 13 (61.9%)/8 (38.1%) | 0.505 |
| 18th hour (1/2) | 16 (76.19%)/5 (23.81%) | 17 (80.95%)/4 (19.05%) | 0.999 |
| 24th hour (1/2) | 18 (85.71%)/3 (14.29%) | 18 (85.71%)/3 (14.29%) | 0.999 |
| 36th hour (1/2) | 18 (85.71%)/3 (14.29%) | 19 (90.48%)/2 (9.52%) | 0.999 |
| 48th hour (1/2/3) | 20 (95.24%)/1 (4.76%)/− | 18 (85.71%)/2 (9.52%)/1 (4.76%) | 0.606 |
| PONV (0, none; 1, nausea; 2, less than three episodes of vomiting; 3: more than three episodes of vomiting) | |||
| 1st day (0/1/2) | 17 (80.95%)/2 (9.52%)/2 (9.52%) | 17 (80.95%)/2 (9.52%)/2 (9.52%) | 0.999 |
| 2nd day (0/2) | 19 (90.48%)/2 (9.52%) | 18 (85.71%)/3 (14.29%) | 0.999 |
| Other side effects | |||
| Pruritus (no/yes) | 19 (90.48%)/2 (9.52%) | 18 (85.71%)/3 (14.29%) | 0.999 |
| Hallucinations (no/yes) | 15 (71.43%)/6 (28.57%) | 20 (95.24%)/1 (4.76%) | 0.093 |
| Confusion (no/yes) | 19 (90.48%)/2 (9.52%) | 21 (100%)/− | 0.488 |
| Seizures (no/yes) | 21 (100%)/− | 21 (100%)/− | - |
| Dry mouth (no/yes) | 12 (57.14%)/9 (42.86%) | 19 (90.48%)/2 (9.52%) | 0.032 |
| Bradycardia (no/yes) | 21 (100%)/− | 21 (100%)/− | - |
| Uterine retention (no/yes) | 21 (100%)/− | 21 (100%)/− | - |
| Hypotension (no/yes) | 21 (100%)/− | 20 (95.24%)/1 (4.76%) | 0.999 |
Somatometric and intraoperative data of the study population, by group
| Study group | p Value | ||
|---|---|---|---|
| Ketamine group (n = 21) | Tramadol group (n = 21) | ||
| Somatometric characteristics of the study group | |||
| Age (years) | 57 [50–60] | 62 [56–66] | 0.058 |
| Gender (female vs male) | 11 (52.38%) versus 10 (47.62%) | 8 (38.1%) versus 13 (61.9%) | 0.268 |
| BMI (kg/m2) | 23.38 (2.78) | 25 (3.37) | 0.097 |
| Intraoperative data | |||
| Type of surgery | |||
| Pancreatectomy | 2 (9.52%) | 6 (28.57%) | 0.175 |
| Whipple | 5 (23.81%) | 8 (38.1%) | |
| Cholopeptic anastomosis | 2 (9.52%) | - | |
| Hepatectomy | 6 (28.57%) | 5 (23.81%) | |
| Gastrectomy | 6 (28.57%) | 2 (9.52%) | |
| Duration of surgery (minutes) | 155 [120–190] | 159 [115–185] | 0.899 |