Table 1
Biometric and clinical data of the investigated patient population
| Age (years) | Weight (kg) | Height (cm) | Anesthesia duration (min) | Surgery duration (min) | Pneumoperitoneum duration (min) |
|---|---|---|---|---|---|
| 61 ± 7 | 85 ± 13 | 177 ± 8 | 338 (275–445) | 263 (195–330) | 223 (165–285) |
[i] Data are presented as mean ± SD for biometric data and as median (range) for clinical data (n = 20).
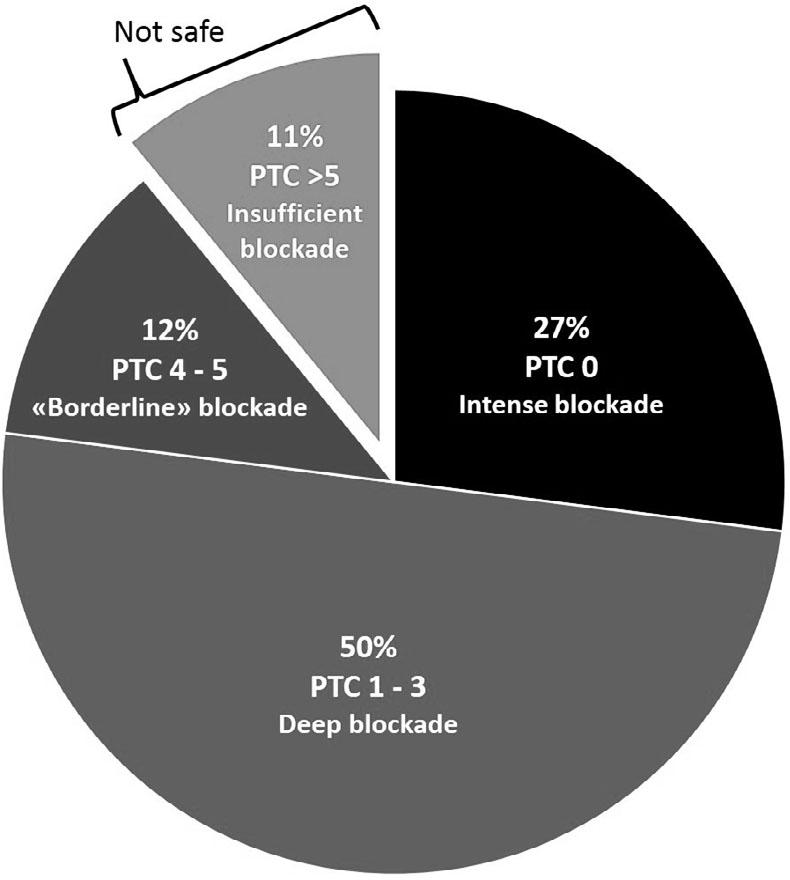
Figure 1
Distribution of achieved neuromuscular block levels during the pneumoperitoneum period. Train of four counts (TOFc) were always 0, and the median of post-tetanic counts (PTC) was at 3.