

Figure 1
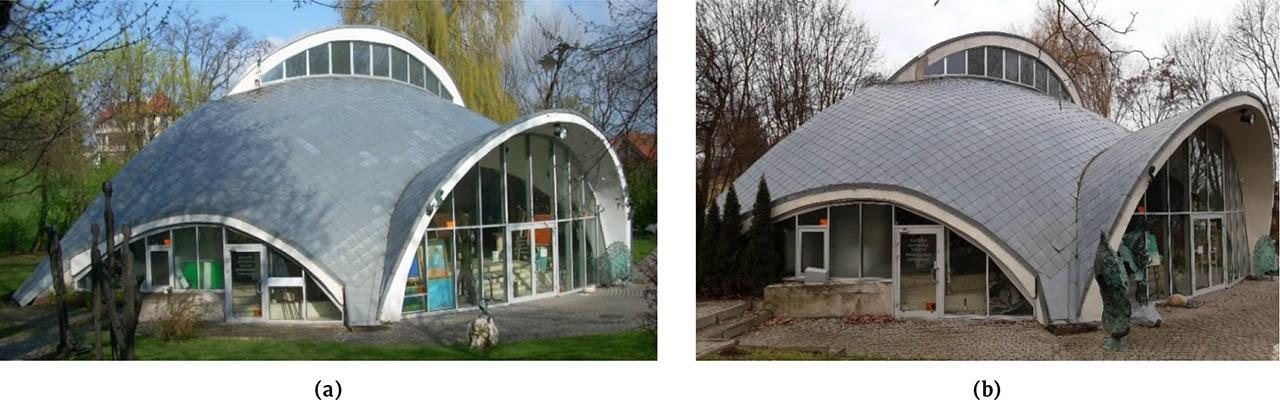
Figure 2
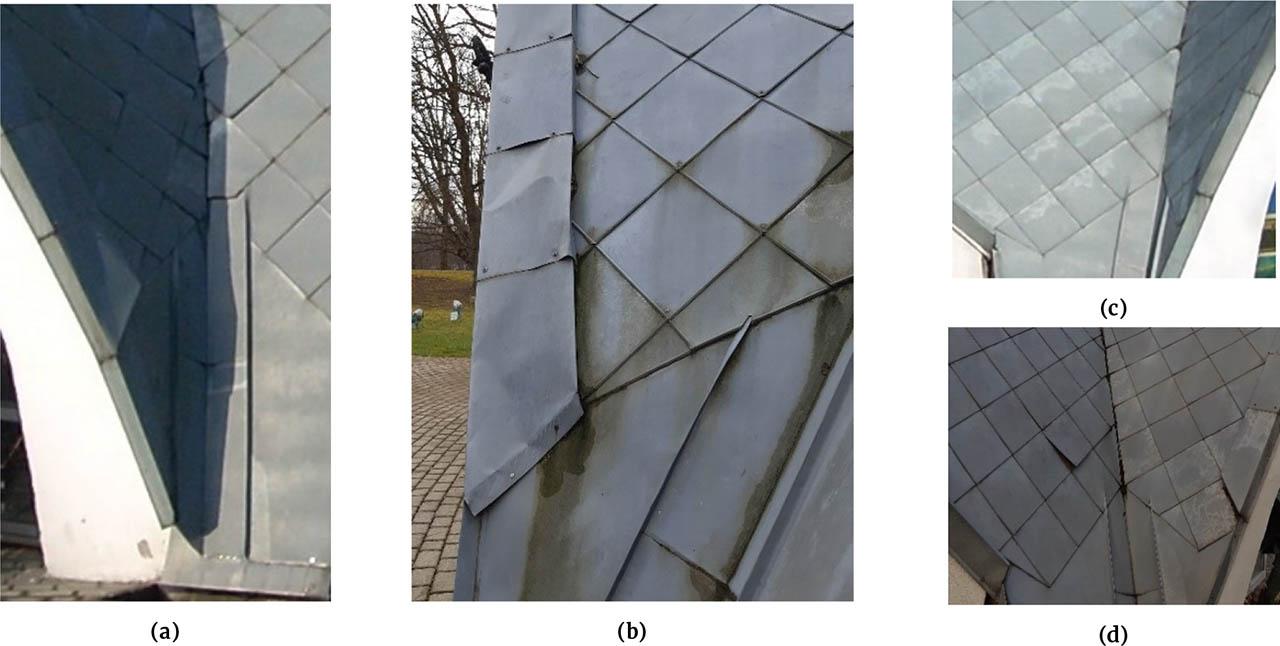
Figure 3
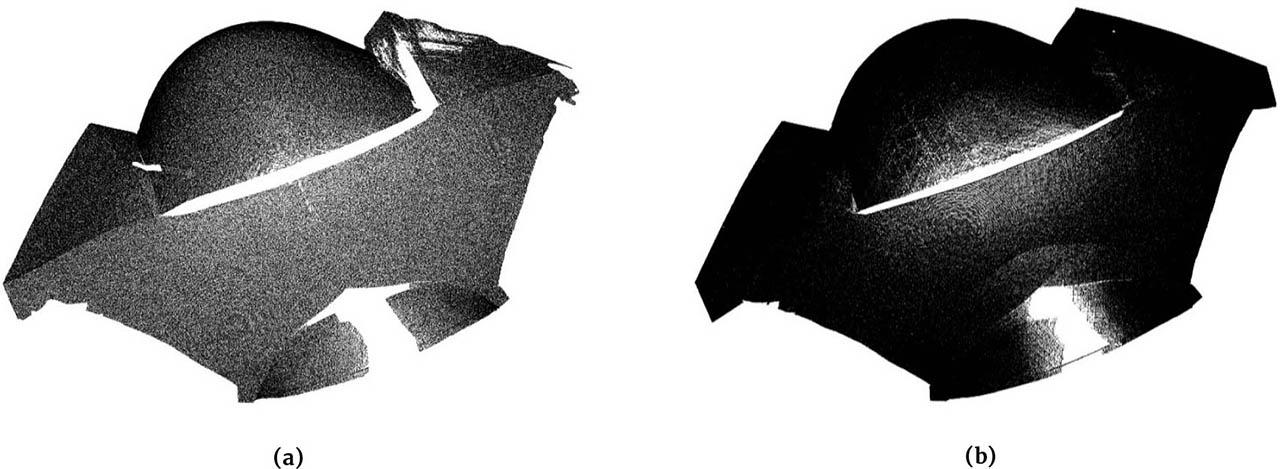
Figure 4
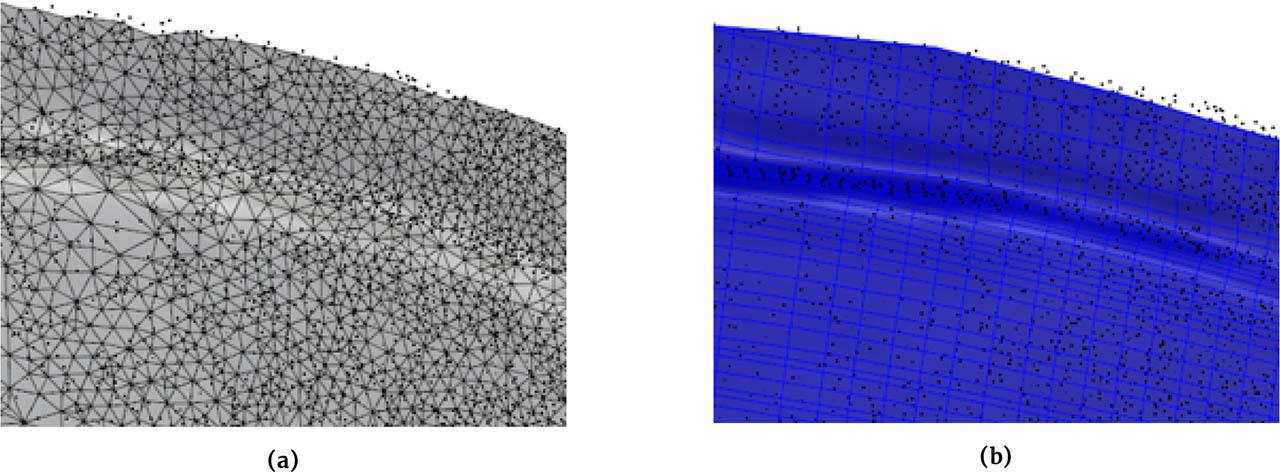
Figure 5
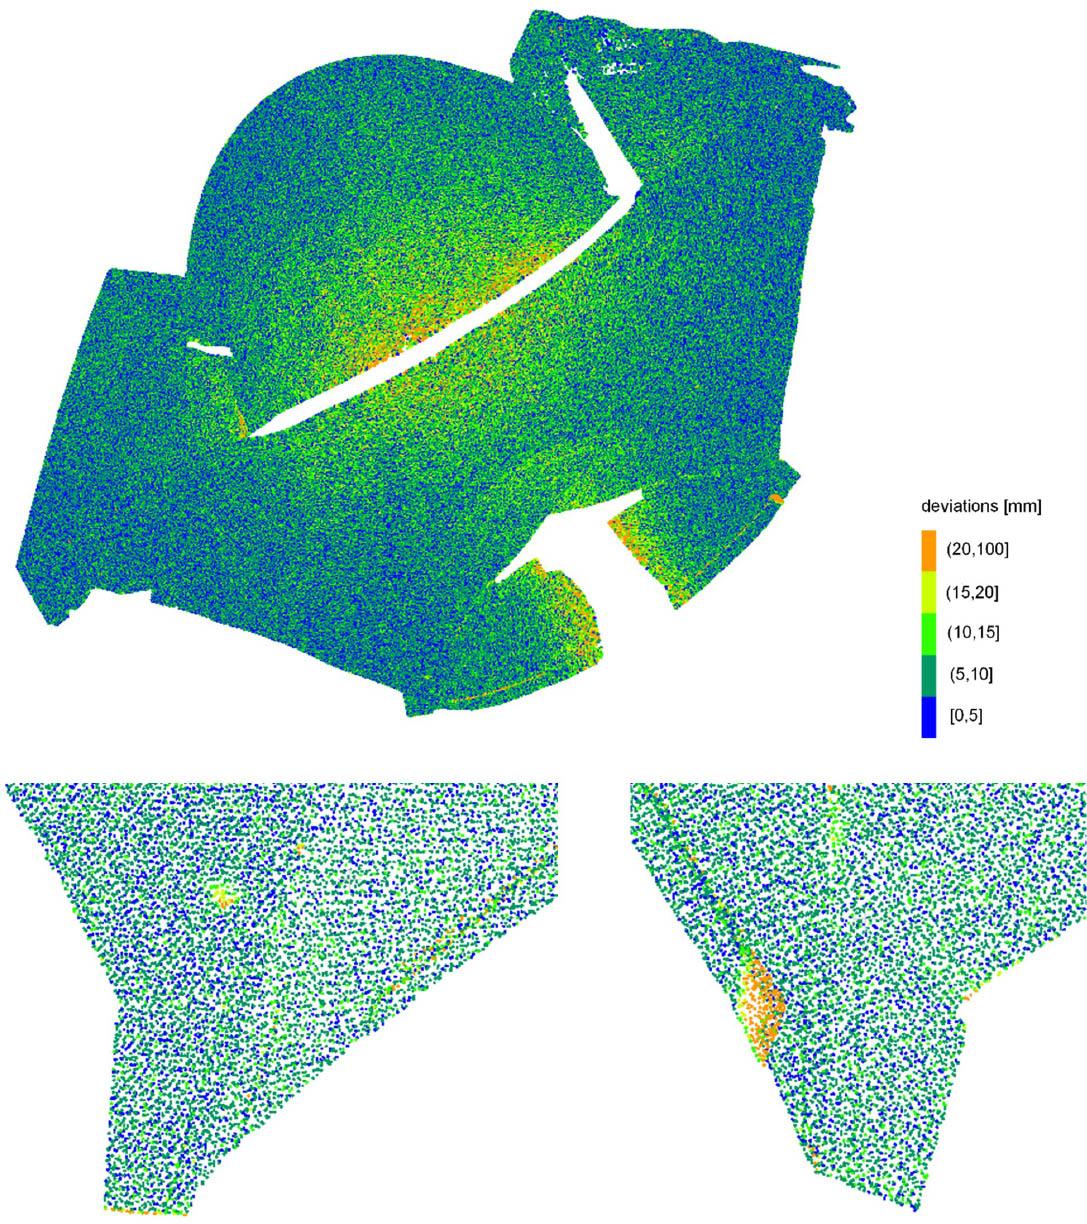
Figure 6
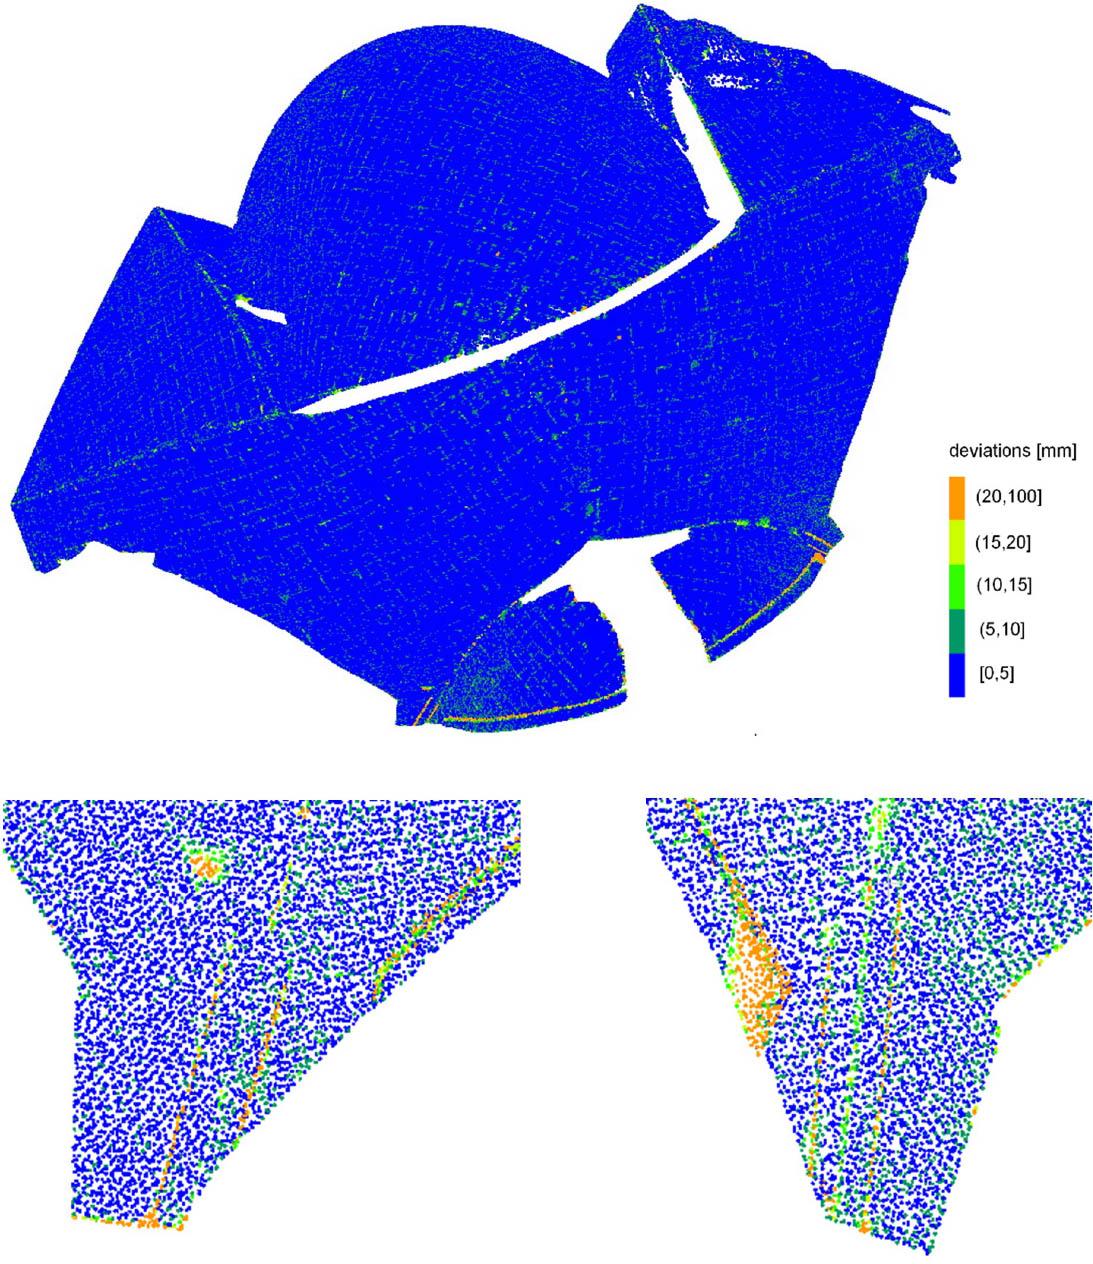
Figure 7
Percentages of the individual deviation ranges and the average deviations
| Range of deviations [mm] | Percentage of deviation [%] | ||
|---|---|---|---|
| Cloud to cloud | Cloud to mesh | Cloud to spline | |
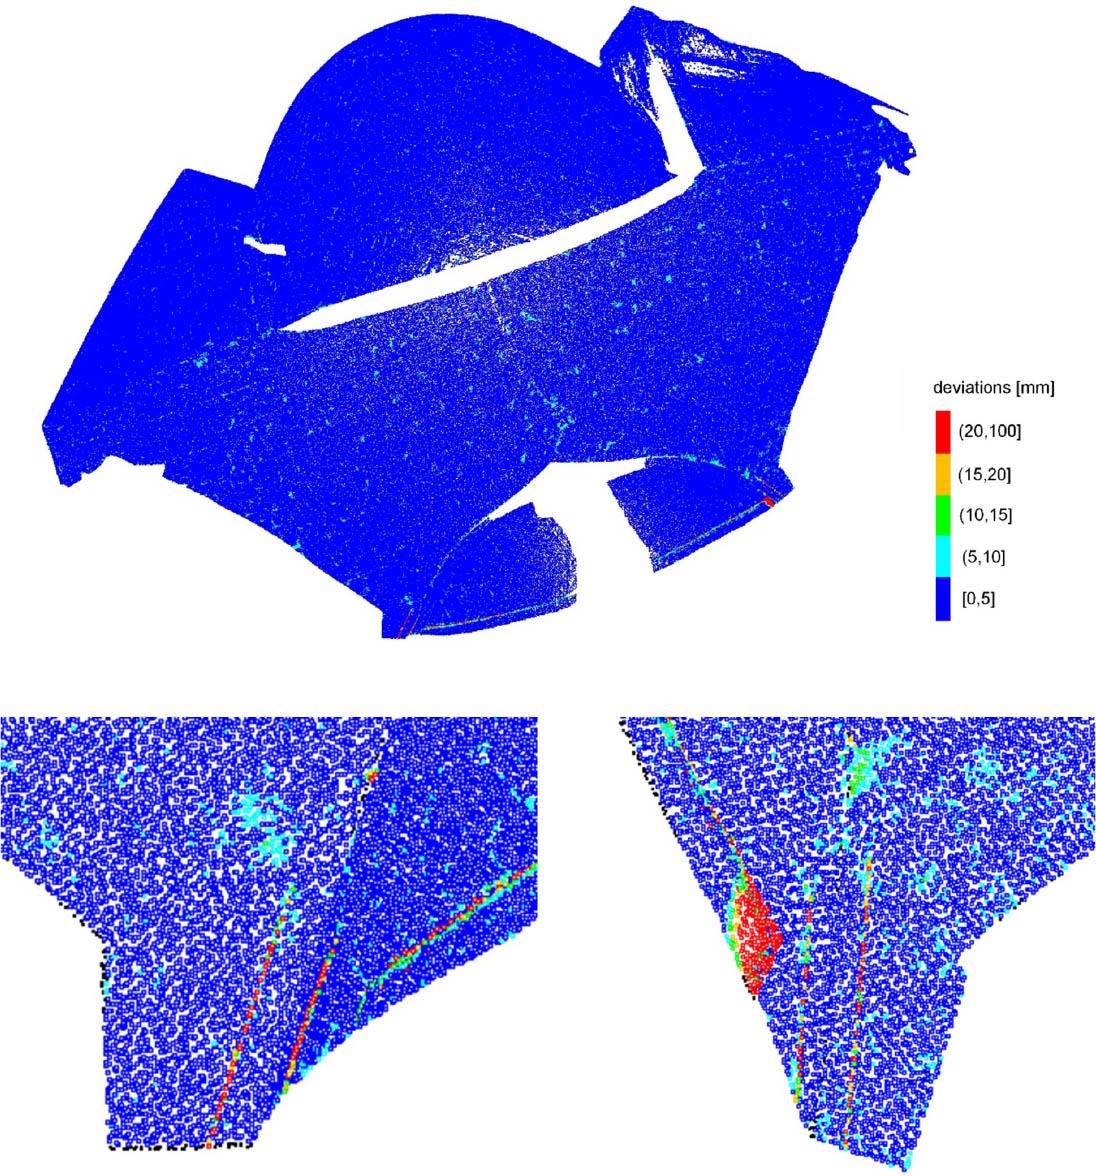
| (0, 5] | 98.83 | 95.16 | 37.75 |
| (5, 10] | 0.90 | 3.25 | 33.06 |
| (10, 15] | 0.11 | 1.13 | 22.35 |
| (15, 20] | 0.06 | 0.37 | 5.68 |
| >20 | 0.11 | 0.09 | 1.16 |
| Average deviation [mm] | 1.9 | 2.8 | 7.1 |