

Figure 1
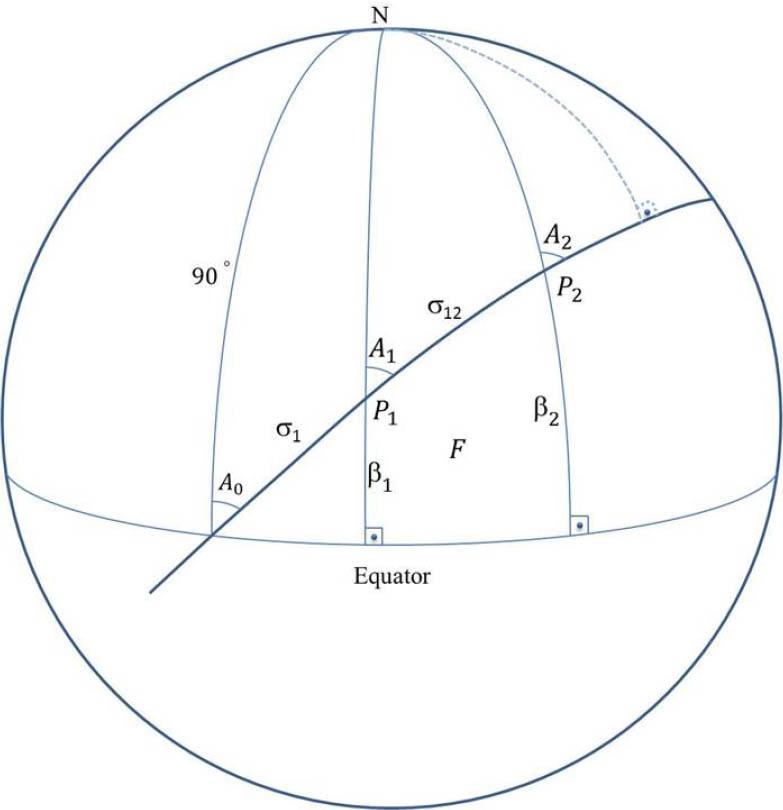
Figure 2
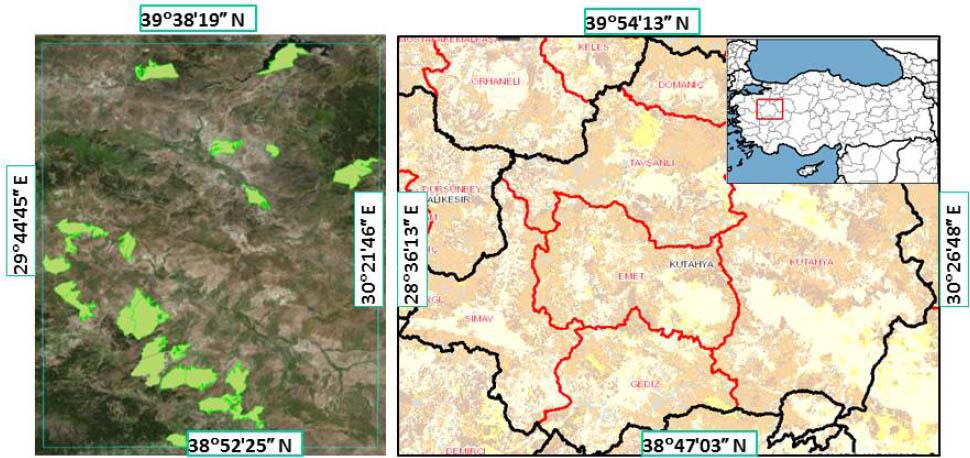
Figure 3
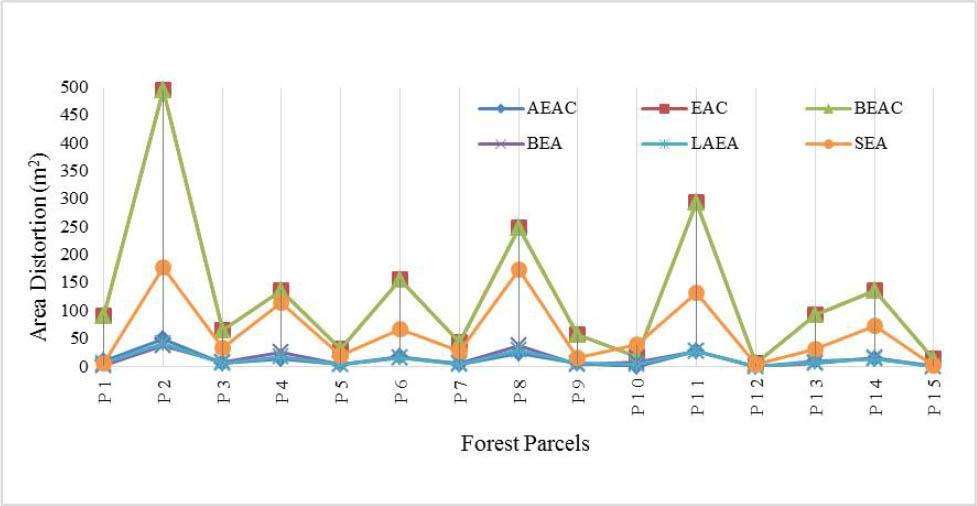
Figure 4
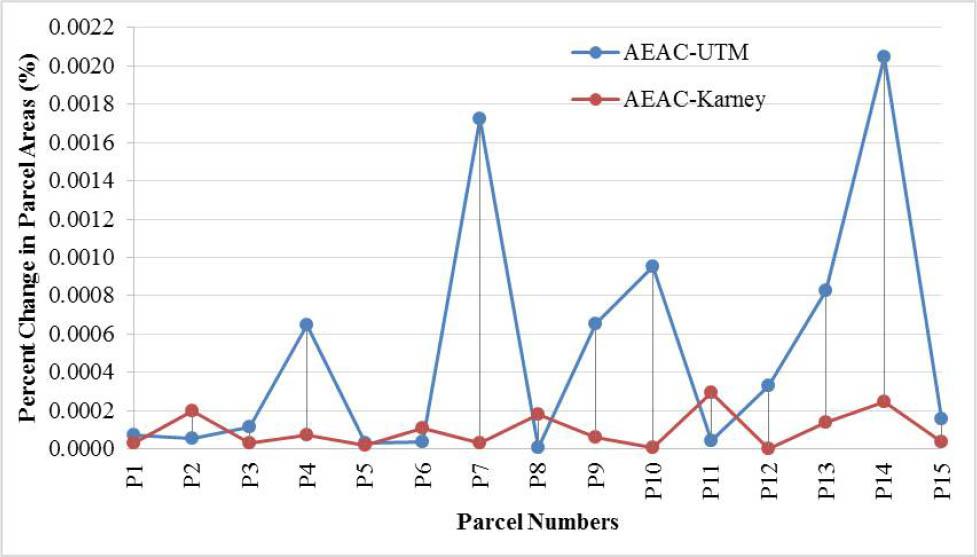
Figure 5
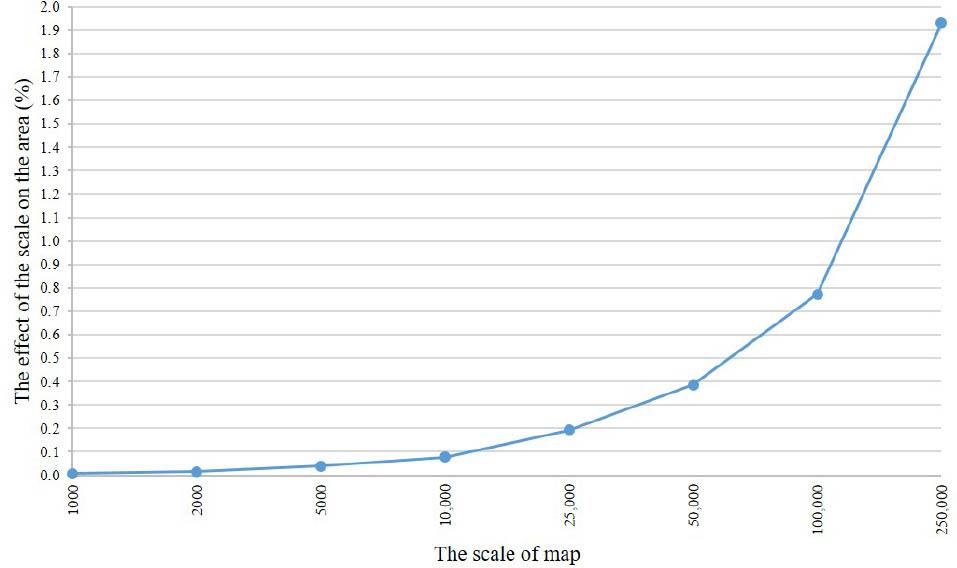
Figure 6
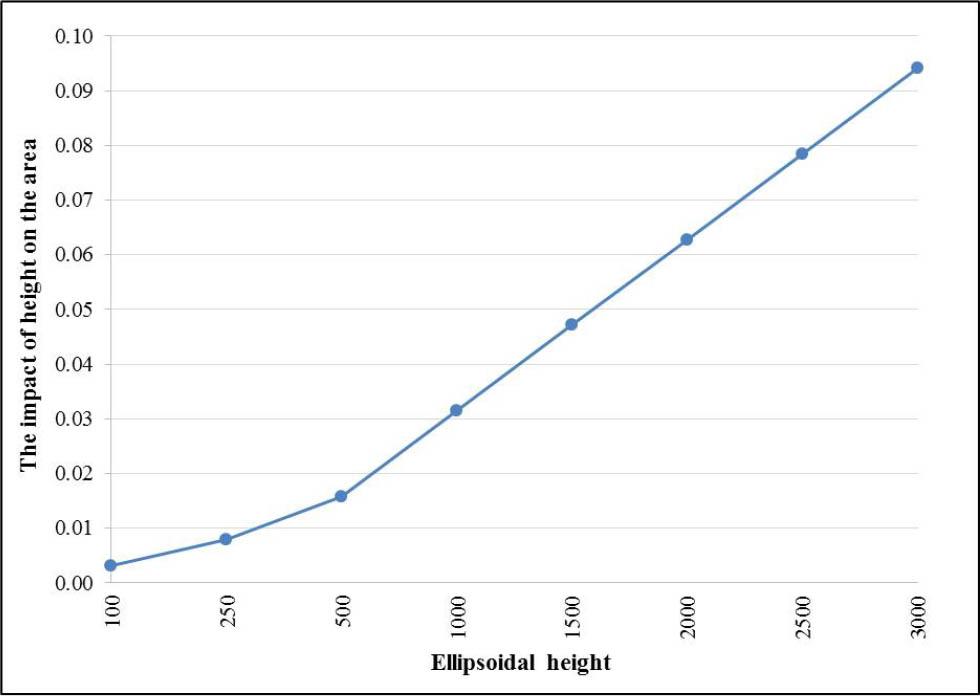
Figure 7
Examination of methods
| Methods | Areas Fmethod [m2] | Difference (Fmethod − Fe) [m2] | Δλ = 0° | Δ φ = 0° | λ = (0°; 90°) | φ = (0°; 90°) | t |
|---|---|---|---|---|---|---|---|
| Danielsen | 63,758,202,714,811.400 | 0.000 | √ | √ | √ | √ | 0.000 |
| Freire | - | - | √ | √ | - | - | 7.906 |
| Gillissen | - | - | √ | √ | - | - | 0.125 |
| Karney | 63,758,202,714,811.400 | 0.000 | √ | √ | √ | √ | 0.031 |
| Kimerling | 63,900,265,931,354.400 | 142,063,216,543.047 | √ | √ | - | - | 0.000 |
| Sjoberg | 63,758,202,714,811.400 | 0.000 | √ | √ | √ | √ | 0.281 |
| Tseng | - | - | - | √ | - | - | 0.000 |
The effect of scale-related accuracy of measurement on the area (for regular polygon parcels)
| Scale of the map | 1000 | 2000 | 5000 | 10,000 | 25,000 | 50,000 | 100,000 | 250,000 | ||
|---|---|---|---|---|---|---|---|---|---|---|
| mp = mx = my [m] | 0.2 | 0.4 | 1 | 2 | 5 | 10 | 20 | 50 | ||
| ∑S2[ha] | Edge [m] | Area | Root mean square error of the MF area depending on the scale [m2] | |||||||
| 0.08 | 10 | 100 m2 | 2 | 4 | 10 | 20 | 50 | 100 | 200 | 500 |
| 8 | 100 | 1 ha | 20 | 40 | 100 | 200 | 500 | 1000 | 2000 | 5000 |
| 32 | 200 | 4 ha | 40 | 80 | 200 | 400 | 1000 | 2000 | 4000 | 10,000 |
| 200 | 500 | 25 ha | 100 | 200 | 500 | 1000 | 2500 | 5000 | 10,000 | 25,000 |
| 450 | 750 | 55 ha | 150 | 300 | 750 | 1500 | 3750 | 7500 | 15,000 | 37,500 |
| 800 | 1000 | 100 ha | 200 | 400 | 1000 | 2000 | 5000 | 10,000 | 20,000 | 50,000 |
| 3200 | 2000 | 400 ha | 400 | 800 | 2000 | 4000 | 10,000 | 20,000 | 40,000 | 100,000 |
| 20,000 | 5000 | 2500 ha | 1000 | 2000 | 5000 | 10,000 | 25,000 | 50,000 | 100,000 | 250,000 |
| 80,000 | 10,000 | 100 km2 | 2000 | 4000 | 10,000 | 20,000 | 50,000 | 100,000 | 200,000 | 500,000 |
| 180,000 | 15,000 | 225 km2 | 3000 | 6000 | 15,000 | 30,000 | 75,000 | 150,000 | 300,000 | 750,000 |
| 320,000 | 20,000 | 400 km2 | 4000 | 8000 | 20,000 | 40,000 | 100,000 | 200,000 | 400,000 | 1,000,000 |
| 720,000 | 30,000 | 900 km2 | 6000 | 12,000 | 30,000 | 60,000 | 150,000 | 300,000 | 600,000 | 1,500,000 |
The effect of scale-related accuracy of measurement on the area (forest parcels) in AEAC projection
| Scale of the map | 1000 | 2000 | 5000 | 10,000 | 25,000 | 50,000 | 100,000 | 250,000 | |
|---|---|---|---|---|---|---|---|---|---|
| mp = mx = my [m] | 0.2 | 0.4 | 1 | 2 | 5 | 10 | 20 | 50 | |
| ΣS2[m2] | Parcels | Root mean square error of the area depending on the scale [m2] | |||||||
| 33,022,713.72 | P1 | 812.683 | 1625.367 | 4063.417 | 8126.834 | 20,317.084 | 40,634.169 | 81,268.338 | 203,170.845 |
| 43,907,616.54 | P2 | 937.098 | 1874.196 | 4685.489 | 9370.978 | 23,427.446 | 46,854.891 | 93,709.782 | 234,274.456 |
| 25,256,098.93 | P3 | 710.719 | 1421.439 | 3553.597 | 7107.193 | 17,767.983 | 35,535.967 | 71,071.934 | 177,679.835 |
| 49,422,346.14 | P4 | 994.207 | 1988.413 | 4971.033 | 9942.067 | 24,855.167 | 49,710.334 | 99,420.668 | 248,551.670 |
| 30,571,936.51 | P5 | 781.945 | 1563.891 | 3909.727 | 7819.455 | 19,548.637 | 39,097.274 | 78,194.548 | 195,486.369 |
| 37,908,657.94 | P6 | 870.731 | 1741.463 | 4353.657 | 8707.314 | 21,768.285 | 43,536.570 | 87,073.139 | 217,682.848 |
| 42,306,252.37 | P7 | 919.851 | 1839.701 | 4599.253 | 9198.506 | 22,996.264 | 45,992.528 | 91,985.056 | 229,962.639 |
| 50,596,221.46 | P8 | 1005.945 | 2011.889 | 5029.723 | 10,059.445 | 25,148.614 | 50,297.227 | 100,594.455 | 251,486.136 |
| 15,412,135.51 | P9 | 555.196 | 1110.392 | 2775.981 | 5551.961 | 13,879.903 | 27,759.805 | 55,519.610 | 138,799.025 |
| 34,040,110.57 | P10 | 825.107 | 1650.215 | 4125.537 | 8251.074 | 20,627.685 | 41,255.370 | 82,510.739 | 206,276.848 |
| 36,106,507.87 | P11 | 849.782 | 1699.565 | 4248.912 | 8497.824 | 21,244.560 | 42,489.121 | 84,978.242 | 212,445.604 |
| 10,698,760 | P12 | 462.575 | 925.149 | 2312.873 | 4625.745 | 11,564.363 | 23,128.727 | 46,257.453 | 115,643.634 |
| 16,397,451.31 | P13 | 572.668 | 1145.337 | 2863.342 | 5726.683 | 14,316.708 | 28,633.417 | 57,266.834 | 143,167.085 |
| 25,863,964.9 | P14 | 719.221 | 1438.443 | 3596.107 | 7192.213 | 17,980.533 | 35,961.066 | 71,922.131 | 179,805.328 |
| 47,247,724.79 | P15 | 972.088 | 1944.175 | 4860.438 | 9720.877 | 24,302.192 | 48,604.385 | 97,208.770 | 243,021.925 |
Rate of total area corrections
| Area corrections | Formulas | Test range | −/+ | Rate of correction (%) |
|---|---|---|---|---|
| Area in the map (UTM, 3°) | fconformal |
| ||
| Area in AEAC projection | fequal area | - | 0.0001%–0.0020% | |
| Scale of the map | fscale | 1:1000–1:250,000 | - | 0.0077%–1.9292% |
| Area (Karney method) in ellipsoid | F ≈ fequal area | |||
| Ellipsoid height | Fh | 100–3000 m | + | 0.0031%–0.0942% |
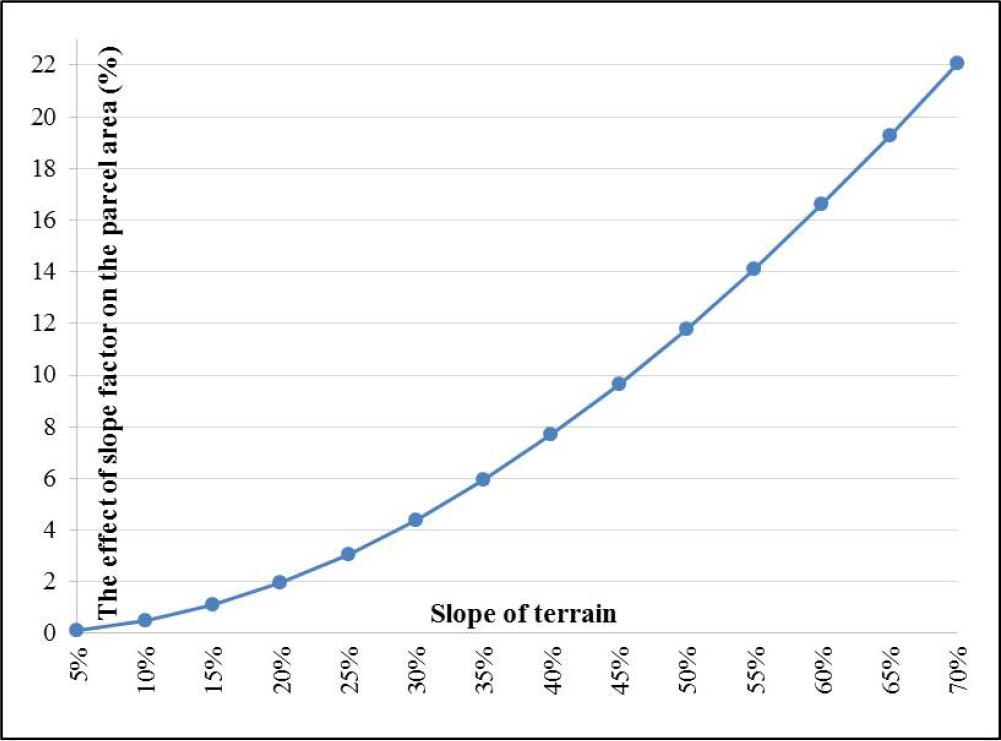
| Slope of terrain | Fs | 5%–70% | + | 0.1249%–22.0656% |
The effect of ellipsoidal height on area (for forest parcels)
| Forest parcels | Area [m2] | Average ellipsoidal height of the parcels [m] | |||||||
|---|---|---|---|---|---|---|---|---|---|
| 100 | 250 | 500 | 1000 | 1500 | 2000 | 2500 | 3000 | ||
| Area corrections [m2] | |||||||||
| P1 | 28,570,391 | 897.030 | 2242.574 | 4485.148 | 8970.295 | 13,455.443 | 17,940.591 | 22,425.738 | 26,910.886 |
| P2 | 24,240,429 | 761.081 | 1902.702 | 3805.405 | 7610.810 | 11,416.214 | 15,221.619 | 19,027.024 | 22,832.429 |
| P3 | 19,454,332 | 610.811 | 1527.028 | 3054.055 | 6108.110 | 9162.166 | 12,216.221 | 15,270.276 | 18,324.331 |
| P4 | 18,201,894 | 571.488 | 1428.720 | 2857.440 | 5714.880 | 8572.320 | 11,429.761 | 14,287.201 | 17,144.641 |
| P5 | 16,730,816 | 525.300 | 1313.251 | 2626.502 | 5253.003 | 7879.505 | 10,506.007 | 13,132.508 | 15,759.010 |
| P6 | 15,951,082 | 500.819 | 1252.047 | 2504.094 | 5008.189 | 7512.283 | 10,016.378 | 12,520.472 | 15,024.567 |
| P7 | 14,808,969 | 464.960 | 1162.399 | 2324.799 | 4649.598 | 6974.397 | 9299.196 | 11,623.995 | 13,948.794 |
| P8 | 12,920,318 | 405.661 | 1014.154 | 2028.307 | 4056.615 | 6084.922 | 8113.229 | 10,141.537 | 12,169.844 |
| P9 | 11,066,953 | 347.471 | 868.678 | 1737.355 | 3474.710 | 5212.066 | 6949.421 | 8686.776 | 10,424.131 |
| P10 | 10,550,252 | 331.248 | 828.120 | 1656.240 | 3312.481 | 4968.721 | 6624.962 | 8281.202 | 9937.443 |
| P11 | 9,498,533.6 | 298.227 | 745.568 | 1491.136 | 2982.271 | 4473.407 | 5964.542 | 7455.678 | 8946.813 |
| P12 | 7,246,670.6 | 227.525 | 568.812 | 1137.625 | 2275.250 | 3412.875 | 4550.500 | 5688.124 | 6825.749 |
| P13 | 6,575,802.9 | 206.462 | 516.154 | 1032.308 | 2064.616 | 3096.924 | 4129.233 | 5161.541 | 6193.849 |
| P14 | 5,774,547.5 | 181.304 | 453.261 | 906.522 | 1813.045 | 2719.567 | 3626.090 | 4532.612 | 5439.134 |
| P15 | 3,673,390.7 | 115.334 | 288.335 | 576.670 | 1153.341 | 1730.011 | 2306.682 | 2883.352 | 3460.023 |
Projections and parameters used in the study
| Map projections | L0 Central longitude | B0 Central latitude | B1 Standard parallel | B2 Standard parallel |
|---|---|---|---|---|
| UTM (3° of longitude in width) | 30°E | 0° (Equator) | - | - |
| AEAC | 30°E | 30.05°N | 34.45°N | 34.85°N |
| EAC | 30°E | 30.05°N | - | - |
| BEAC | 30°E | 0° (Equator) | - | - |
| BEA | 30°E | 0° (Equator) | - | - |
| LAEA | 30°E | 30.05°N | - | - |
| SEA | 30°E | 0° (Equator) | - | - |
The effect of ellipsoidal height on area (for regular polygon parcels)
| Area values | Average ellipsoidal height of the parcel [m] | |||||||
|---|---|---|---|---|---|---|---|---|
| 100 | 250 | 500 | 1000 | 1500 | 2000 | 2500 | 3000 | |
| Area corrections [m2] | ||||||||
| 100 m2 | 0.003 | 0.008 | 0.016 | 0.031 | 0.047 | 0.063 | 0.078 | 0.094 |
| 1 ha | 0.314 | 0.785 | 1.570 | 3.140 | 4.710 | 6.279 | 7.849 | 9.419 |
| 4 ha | 1.256 | 3.140 | 6.279 | 12.559 | 18.838 | 25.118 | 31.397 | 37.677 |
| 52 ha | 7.849 | 19.623 | 39.246 | 78.493 | 117.739 | 156.986 | 196.232 | 235.479 |
| 55 ha | 17.268 | 43.171 | 86.342 | 172.684 | 259.027 | 345.369 | 431.711 | 518.053 |
| 100 ha | 31.397 | 78.493 | 156.986 | 313.972 | 470.958 | 627.943 | 784.929 | 941.915 |
| 400 ha | 125.589 | 313.972 | 627.943 | 1255.887 | 1883.830 | 2511.774 | 3139.717 | 3767.661 |
| 2500 ha | 784.929 | 1962.323 | 3924.647 | 7849.294 | 11,773.940 | 15,698.587 | 19,623.234 | 23,547.881 |
| 100 km2 | 3139.717 | 7849.294 | 15,698.587 | 31,397.174 | 47,095.761 | 62,794.349 | 78,492.936 | 94,191.523 |
| 225 km2 | 7064.364 | 17,660.911 | 35,321.821 | 70,643.642 | 105,965.463 | 141,287.284 | 176,609.105 | 211,930.926 |
| 400 km2 | 12,558.870 | 31,397.174 | 62,794.349 | 125,588.697 | 188,383.046 | 251,177.394 | 313,971.743 | 376,766.091 |
| 900 km2 | 28,257.457 | 70,643.642 | 141,287.284 | 282,574.568 | 423,861.852 | 565,149.137 | 706,436.421 | 847,723.705 |
Comparison of UTM, area reduction (F – f), Karney method and AEAC projection
| Parcel number | Area calculation [m2] | Area distortion [m2] | |||||
|---|---|---|---|---|---|---|---|
| Conform map projection | Ellipsoid geographical coordinates | Equal area projection | Area reduction formula | Equal area projection | Conform map projection | ||
| UTM [3°] (fconformal) | (F – f) (4) formula | F (Karney) | AEAC (fequal_area) | Karney– [f–(F – f)] | Karney–AEAC | Karney–UTM | |
| P1 | 28,570,421.774 | 118.994 | 28,570,400.287 | 28,570,390.847 | 140.481 | 9.440 | 21.487 |
| P2 | 24,240,491.726 | 100.960 | 24,240,477.498 | 24,240,428.709 | 86.732 | 48.789 | 14.228 |
| P3 | 19,454,360.215 | 81.026 | 19,454,337.971 | 19,454,331.754 | 58.782 | 6.217 | 22.244 |
| P4 | 18,201,997.722 | 75.810 | 18,201,879.790 | 18,201,893.606 | 42.122 | 13.816 | 117.932 |
| P5 | 16,730,817.085 | 69.683 | 16,730,812.149 | 16,730,815.813 | 64.747 | 3.664 | 4.936 |
| P6 | 15,951,105.646 | 66.435 | 15,951,099.137 | 15,951,081.911 | 59.926 | 17.226 | 6.509 |
| P7 | 14,809,228.918 | 61.679 | 14,808,973.667 | 14,808,969.185 | 193.572 | 4.482 | 255.251 |
| P8 | 12,920,294.789 | 53.812 | 12,920,293.910 | 12,920,317.541 | 52.933 | 23.631 | 0.879 |
| P9 | 11,067,018.225 | 46.093 | 11,066,945.786 | 11,066,952.772 | 26.346 | 6.986 | 72.439 |
| P10 | 10,550,351.283 | 43.941 | 10,550,250.549 | 10,550,251.662 | 56.793 | 1.113 | 100.734 |
| P11 | 9,498,509.712 | 39.561 | 9,498,505.310 | 9,498,533.562 | 35.159 | 28.252 | 4.402 |
| P12 | 7,246,694.410 | 30.182 | 7,246,670.634 | 7,246,670.599 | 6.406 | 0.035 | 23.776 |
| P13 | 6,575,866.610 | 27.388 | 6,575,812.176 | 6,575,802.912 | 27.046 | 9.264 | 54.434 |
| P14 | 5,774,651.499 | 24.051 | 5,774,533.261 | 5,774,547.548 | 94.187 | 14.287 | 118.238 |
| P15 | 3,673,397.840 | 15.299 | 3,673,391.983 | 3,673,390.666 | 9.442 | 1.317 | 5.857 |
Area distortions of equal area projections
| Parcel number | Area calculation [m2] | |||||||
|---|---|---|---|---|---|---|---|---|
| Conformal map projection | Ellipsoid geographical coordinates | Area distortion (Karney-equal area map projections) | ||||||
| UTM (3°) | (Karney method) | AEAC | EAC | BEAC | BEA | LAEA | SEA | |
| P1 | 28,570,421.774 | 28,570,400.287 | 9.440 | 90.265 | 90.247 | 1.854 | 5.603 | 6.880 |
| P2 | 24,240,491.726 | 24,240,477.498 | 48.789 | 495.779 | 496.021 | 37.717 | 42.016 | 177.158 |
| P3 | 19,454,360.215 | 19,454,337.971 | 6.217 | 64.581 | 64.516 | 7.223 | 6.395 | 32.869 |
| P4 | 18,201,997.722 | 18,201,879.790 | 13.816 | 135.762 | 135.712 | 25.911 | 18.612 | 114.817 |
| P5 | 16,730,817.085 | 16,730,812.149 | 3.664 | 32.262 | 32.260 | 4.938 | 4.220 | 20.196 |
| P6 | 15,951,105.646 | 15,951,099.137 | 17.226 | 156.574 | 156.824 | 15.139 | 15.271 | 66.613 |
| P7 | 14,809,228.918 | 14,808,973.667 | 4.482 | 44.089 | 44.112 | 5.986 | 5.158 | 27.267 |
| P8 | 12,920,294.789 | 12,920,293.910 | 23.631 | 249.194 | 248.966 | 37.360 | 29.865 | 174.311 |
| P9 | 11,067,018.225 | 11,066,945.786 | 6.986 | 58.247 | 58.261 | 4.470 | 5.488 | 16.470 |
| P10 | 10,550,351.283 | 10,550,250.549 | 1.113 | 18.177 | 18.236 | 7.909 | 4.080 | 39.129 |
| P11 | 9,498,509.712 | 9,498,505.310 | 28.252 | 294.518 | 294.698 | 28.161 | 27.681 | 133.011 |
| P12 | 7,246,694.410 | 7,246,670.634 | 0.035 | 5.766 | 5.679 | 0.175 | 0.103 | 3.432 |
| P13 | 6,575,866.610 | 6,575,812.176 | 9.264 | 93.417 | 93.364 | 6.931 | 7.786 | 32.686 |
| P14 | 5,774,651.499 | 5,774,533.261 | 14.287 | 136.143 | 136.038 | 16.496 | 14.751 | 72.715 |
| P15 | 3,673,397.840 | 3,673,391.983 | 1.317 | 13.831 | 13.764 | 0.586 | 0.922 | 3.230 |
| Σ | 188.519 | 1888.605 | 1888.698 | 200.856 | 187.951 | 920.784 | ||