

Figure 1
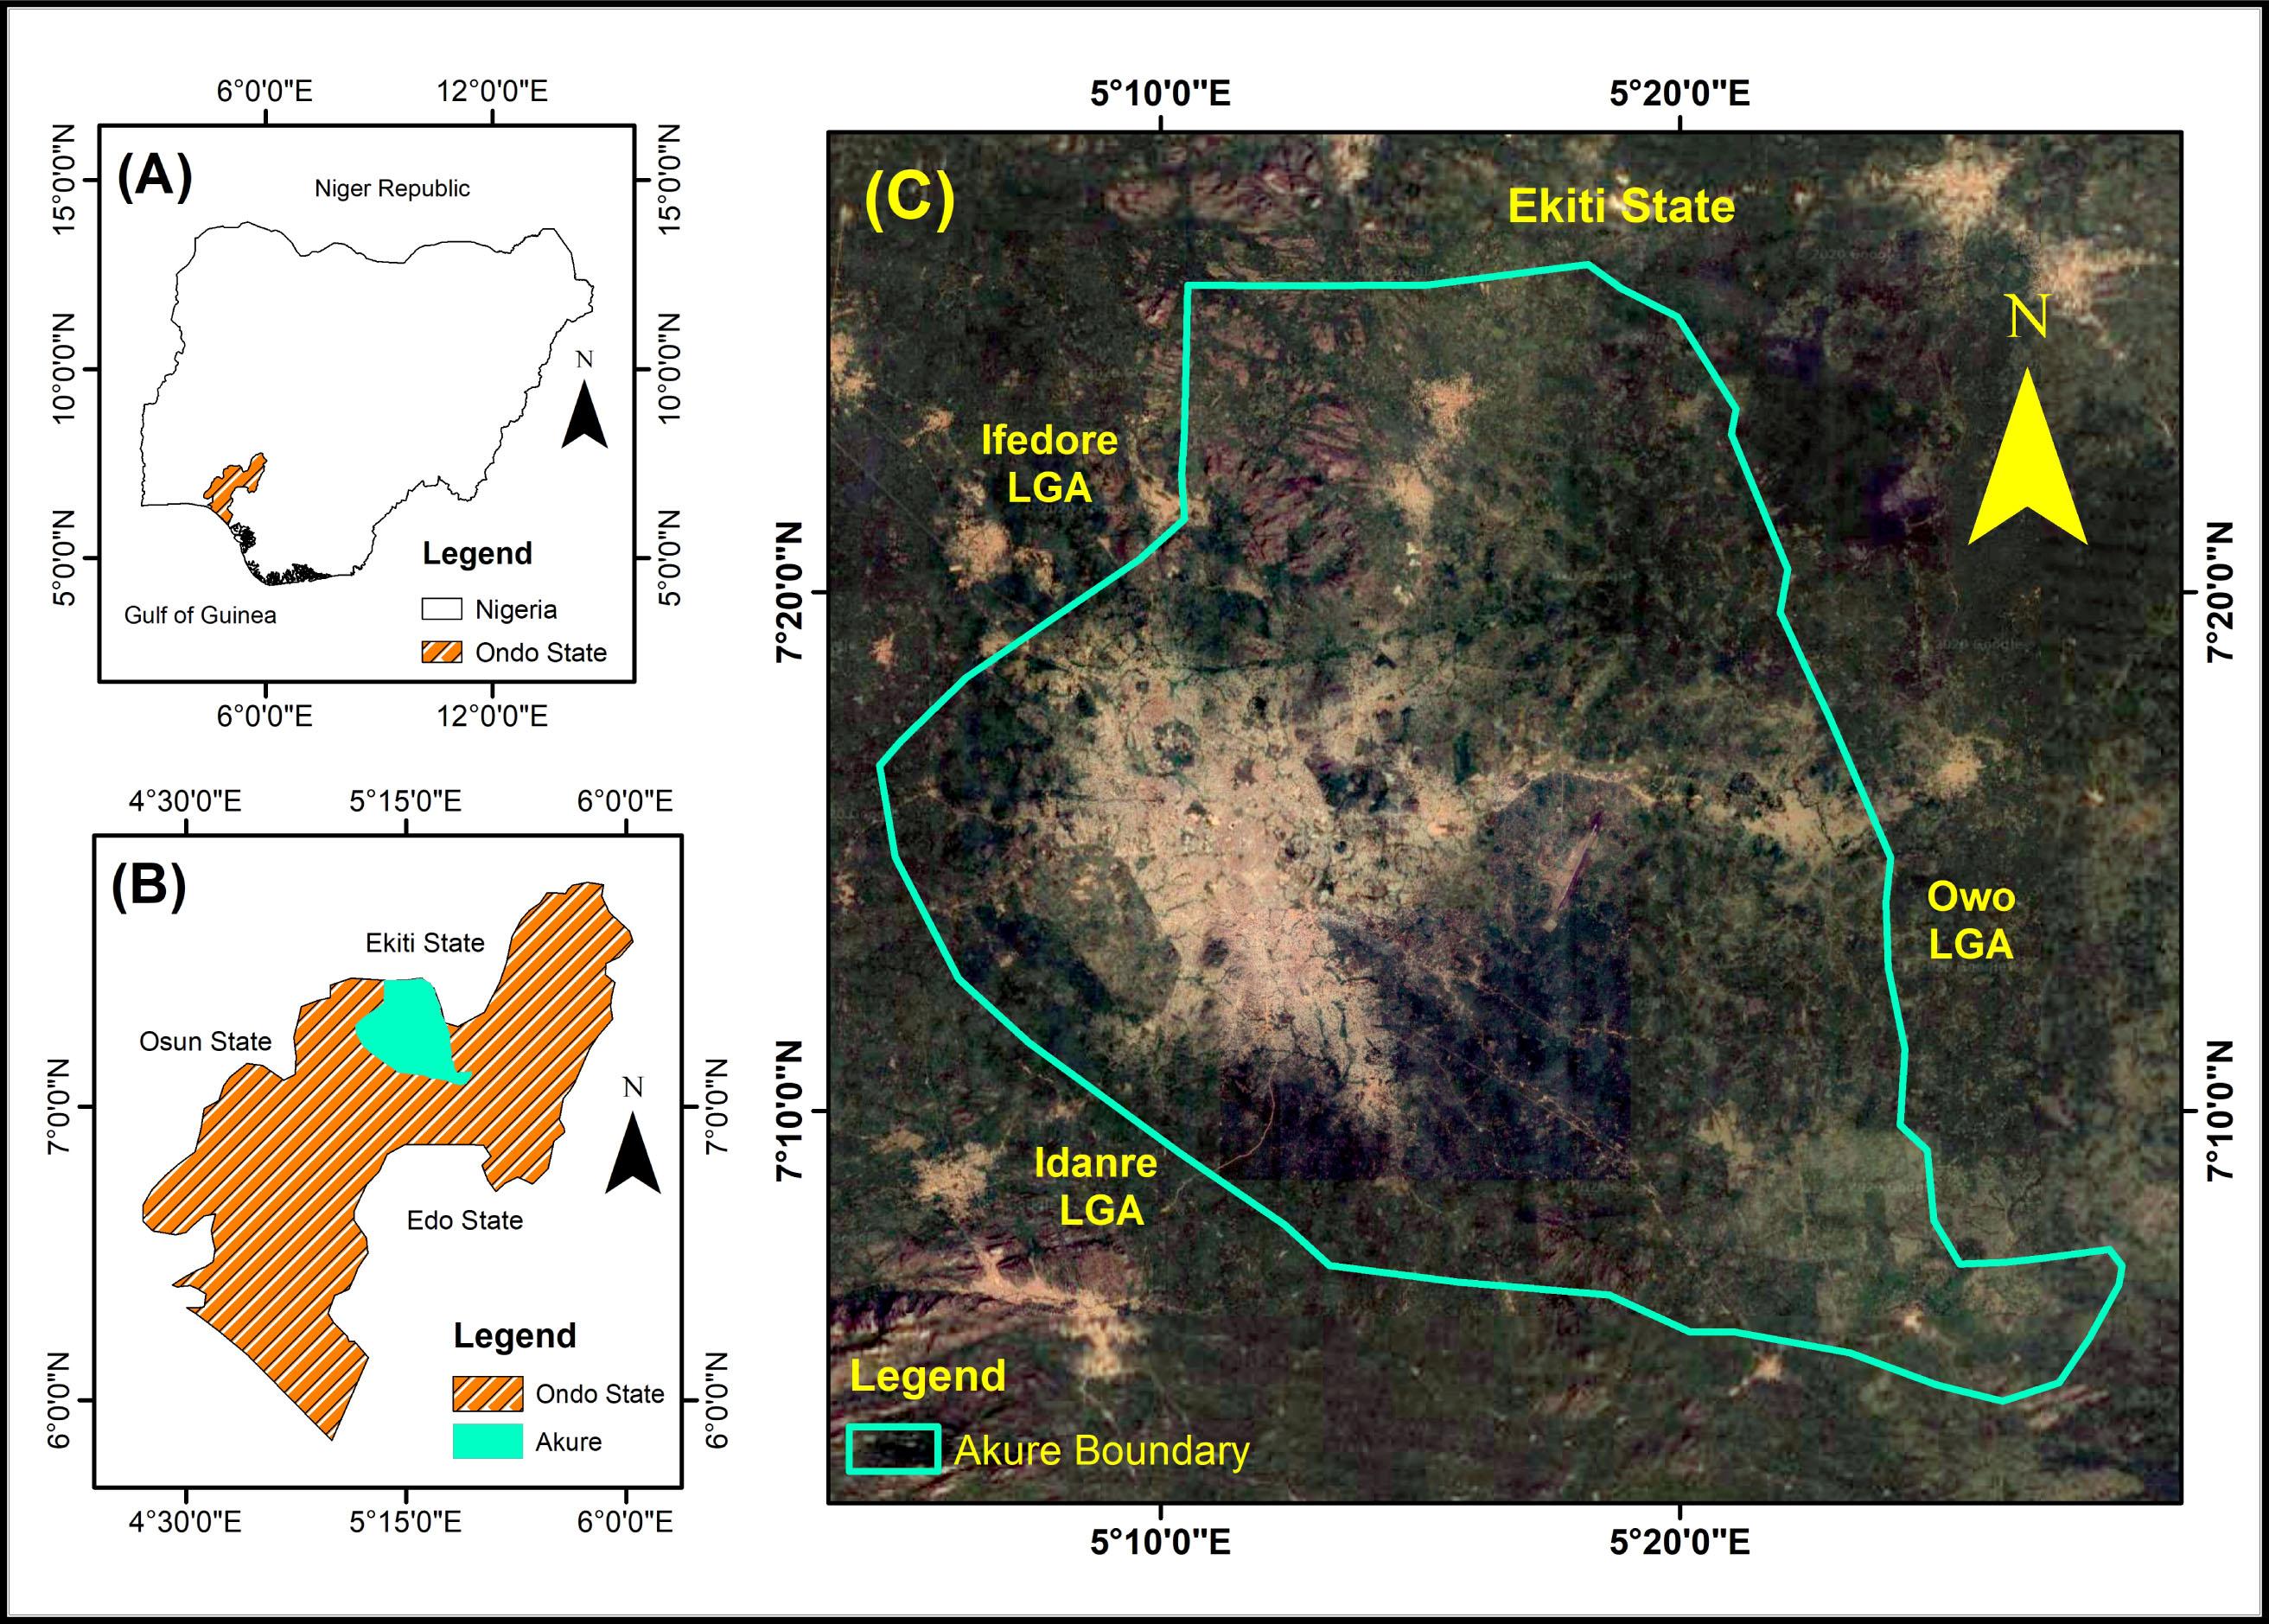
Figure 2

Figure 3

Figure 4
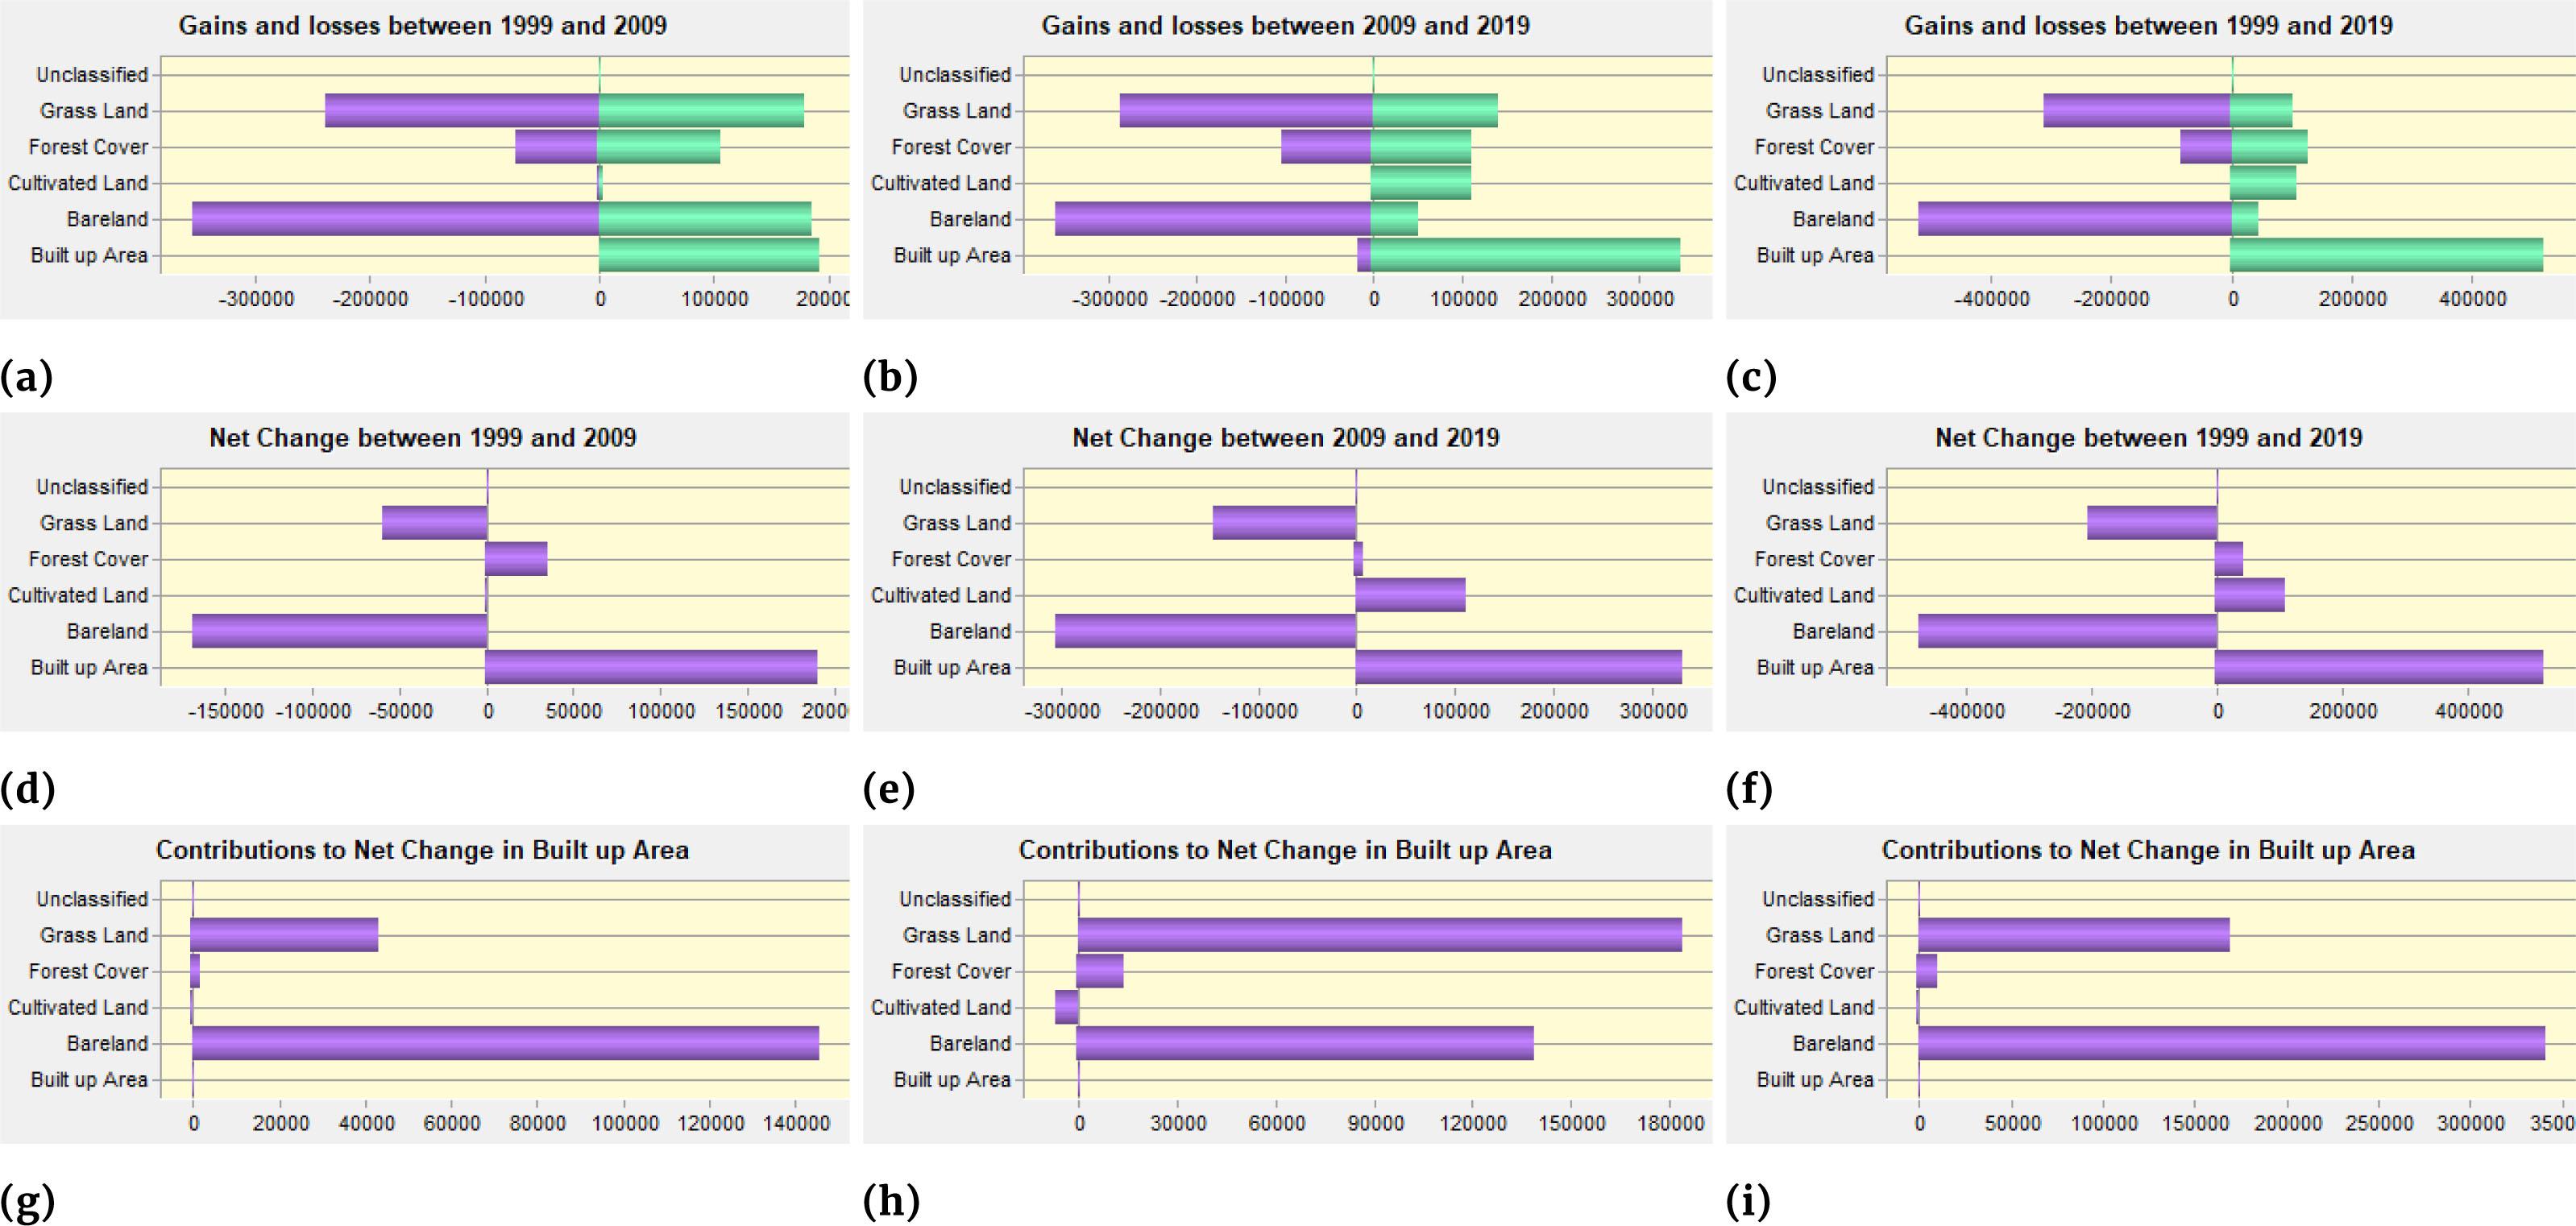
Figure 5

Accuracy assessment of LULC for the study period
| Classified Data | Bare Land | Built-Up Area | Cultivated Land | Forest Cover | Grassland | Total | User Accuracy (%) | ||
|---|---|---|---|---|---|---|---|---|---|
| December 1999 | Bare Land | 37 | 2 | 0 | 0 | 1 | 40 | 92.50 | |
| Built-Up Area | 2 | 32 | 0 | 0 | 0 | 34 | 94.12 | ||
| Cultivated Land | 0 | 0 | 31 | 1 | 2 | 34 | 91.18 | ||
| Forest Cover | 1 | 1 | 2 | 34 | 0 | 38 | 89.47 | ||
| Grassland | 1 | 0 | 1 | 0 | 33 | 35 | 94.29 | ||
| Total | 41 | 35 | 34 | 35 | 36 | 181 | |||
| Producer Accuracy (%) | 90.24 | 91.43 | 91.18 | 97.14 | 91.67 | ||||
| Overall Accuracy = 92.27%; Kappa Statistics = 0.89; KHisto = 0.96; KLoc = 0.93 | |||||||||
| November 2009 | Bare Land | 31 | 6 | 0 | 0 | 2 | 39 | 79.49 | |
| Built-Up Area | 1 | 34 | 0 | 0 | 0 | 35 | 97.14 | ||
| Cultivated Land | 1 | 0 | 33 | 1 | 2 | 37 | 89.19 | ||
| Forest Cover | 0 | 0 | 1 | 30 | 2 | 33 | 90.91 | ||
| Grassland | 0 | 0 | 2 | 1 | 34 | 37 | 91.89 | ||
| Total | 33 | 40 | 36 | 32 | 40 | 181 | |||
| Producer Accuracy (%) | 93.34 | 85.00 | 91.67 | 93.75 | 85.00 | ||||
| Overall Accuracy = 89.50%; Kappa Statistics = 0.84; KHisto = 0.91; KLoc = 0.92 | |||||||||
| January 2019 | Bare Land | 34 | 1 | 0 | 0 | 0 | 35 | 97.14 | |
| Built-Up Area | 2 | 46 | 0 | 0 | 0 | 48 | 95.83 | ||
| Cultivated Land | 0 | 0 | 31 | 1 | 1 | 33 | 93.94 | ||
| Forest Cover | 1 | 1 | 1 | 29 | 0 | 32 | 90.63 | ||
| Grassland | 0 | 0 | 2 | 1 | 30 | 33 | 90.91 | ||
| Total | 37 | 48 | 34 | 31 | 31 | 181 | |||
| Producer Accuracy (%) | 91.89 | 95.83 | 91.18 | 93.55 | 96.77 | ||||
| Overall Accuracy = 93.92%; Kappa Statistics = 0.91; KHisto = 0.93; KLoc = 0.98 | |||||||||
Description of Landsat datasets
| S/N | Instrument | Scene Identifier | Bands Stacked | Cloud Cover (%) | Geometric RMSE Model (m) |
|---|---|---|---|---|---|
| 1 | Landsat 7 ETM+ | LE71900551999347AGS01 | 1–8 | 11.00 | 3.59 |
| 2 | Landsat 7 ETM+ | LE71900552009326ASN00 | 1–8 | 8.00 | 4.22 |
| 3 | Landsat 8 OLI | LC81900552019010LGN00 | 1–9 | 13.02 | 7.52 |
Temporal change/percentage of land cover classes for the study period
| Land Cover | 1999 | 2009 | 2019 | |||
|---|---|---|---|---|---|---|
| Area [km2] | Area [%] | Area [km2] | Area [%] | Area [km2] | Area [%] | |
| Bare Land | 513.230 | 50.97 | 379.888 | 37.73 | 87.207 | 8.66 |
| Built-Up Area | 19.886 | 1.98 | 163.612 | 16.25 | 489.400 | 48.61 |
| Cultivated Land | 5.466 | 0.54 | 16.351 | 1.62 | 106.000 | 10.52 |
| Forest Cover | 102.445 | 10.18 | 135.024 | 13.41 | 143.644 | 14.27 |
| Grassland | 365.837 | 36.33 | 311.989 | 30.99 | 180.613 | 17.94 |
| TOTAL | 1,006.864 | 100.00 | 1,006.864 | 100.00 | 1,006.864 | 100.00 |