

Figure 1
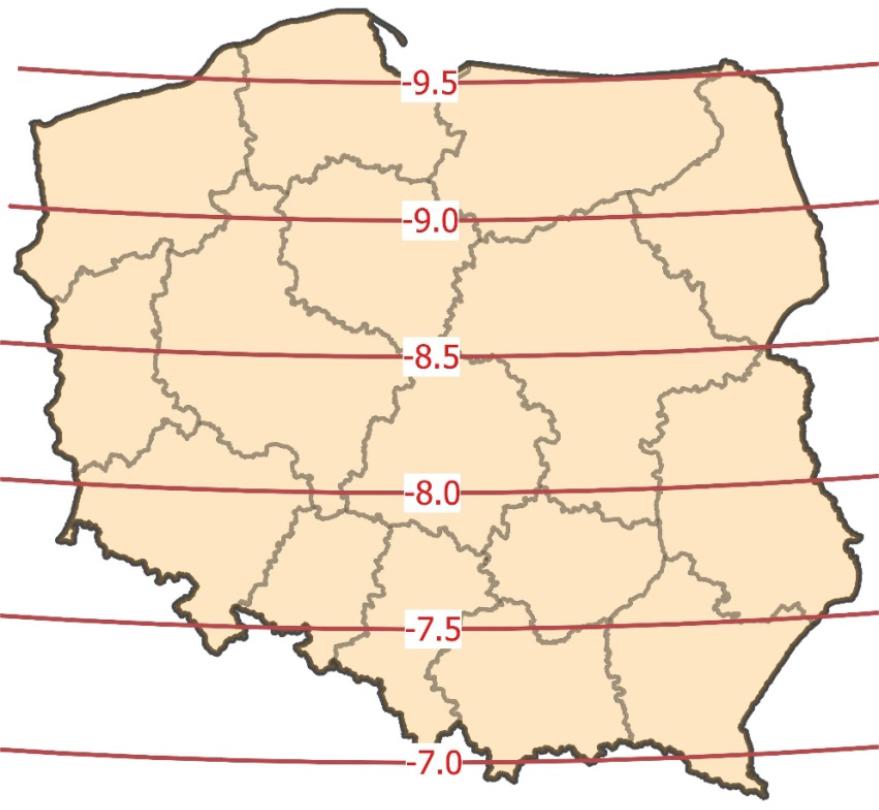
Figure 2
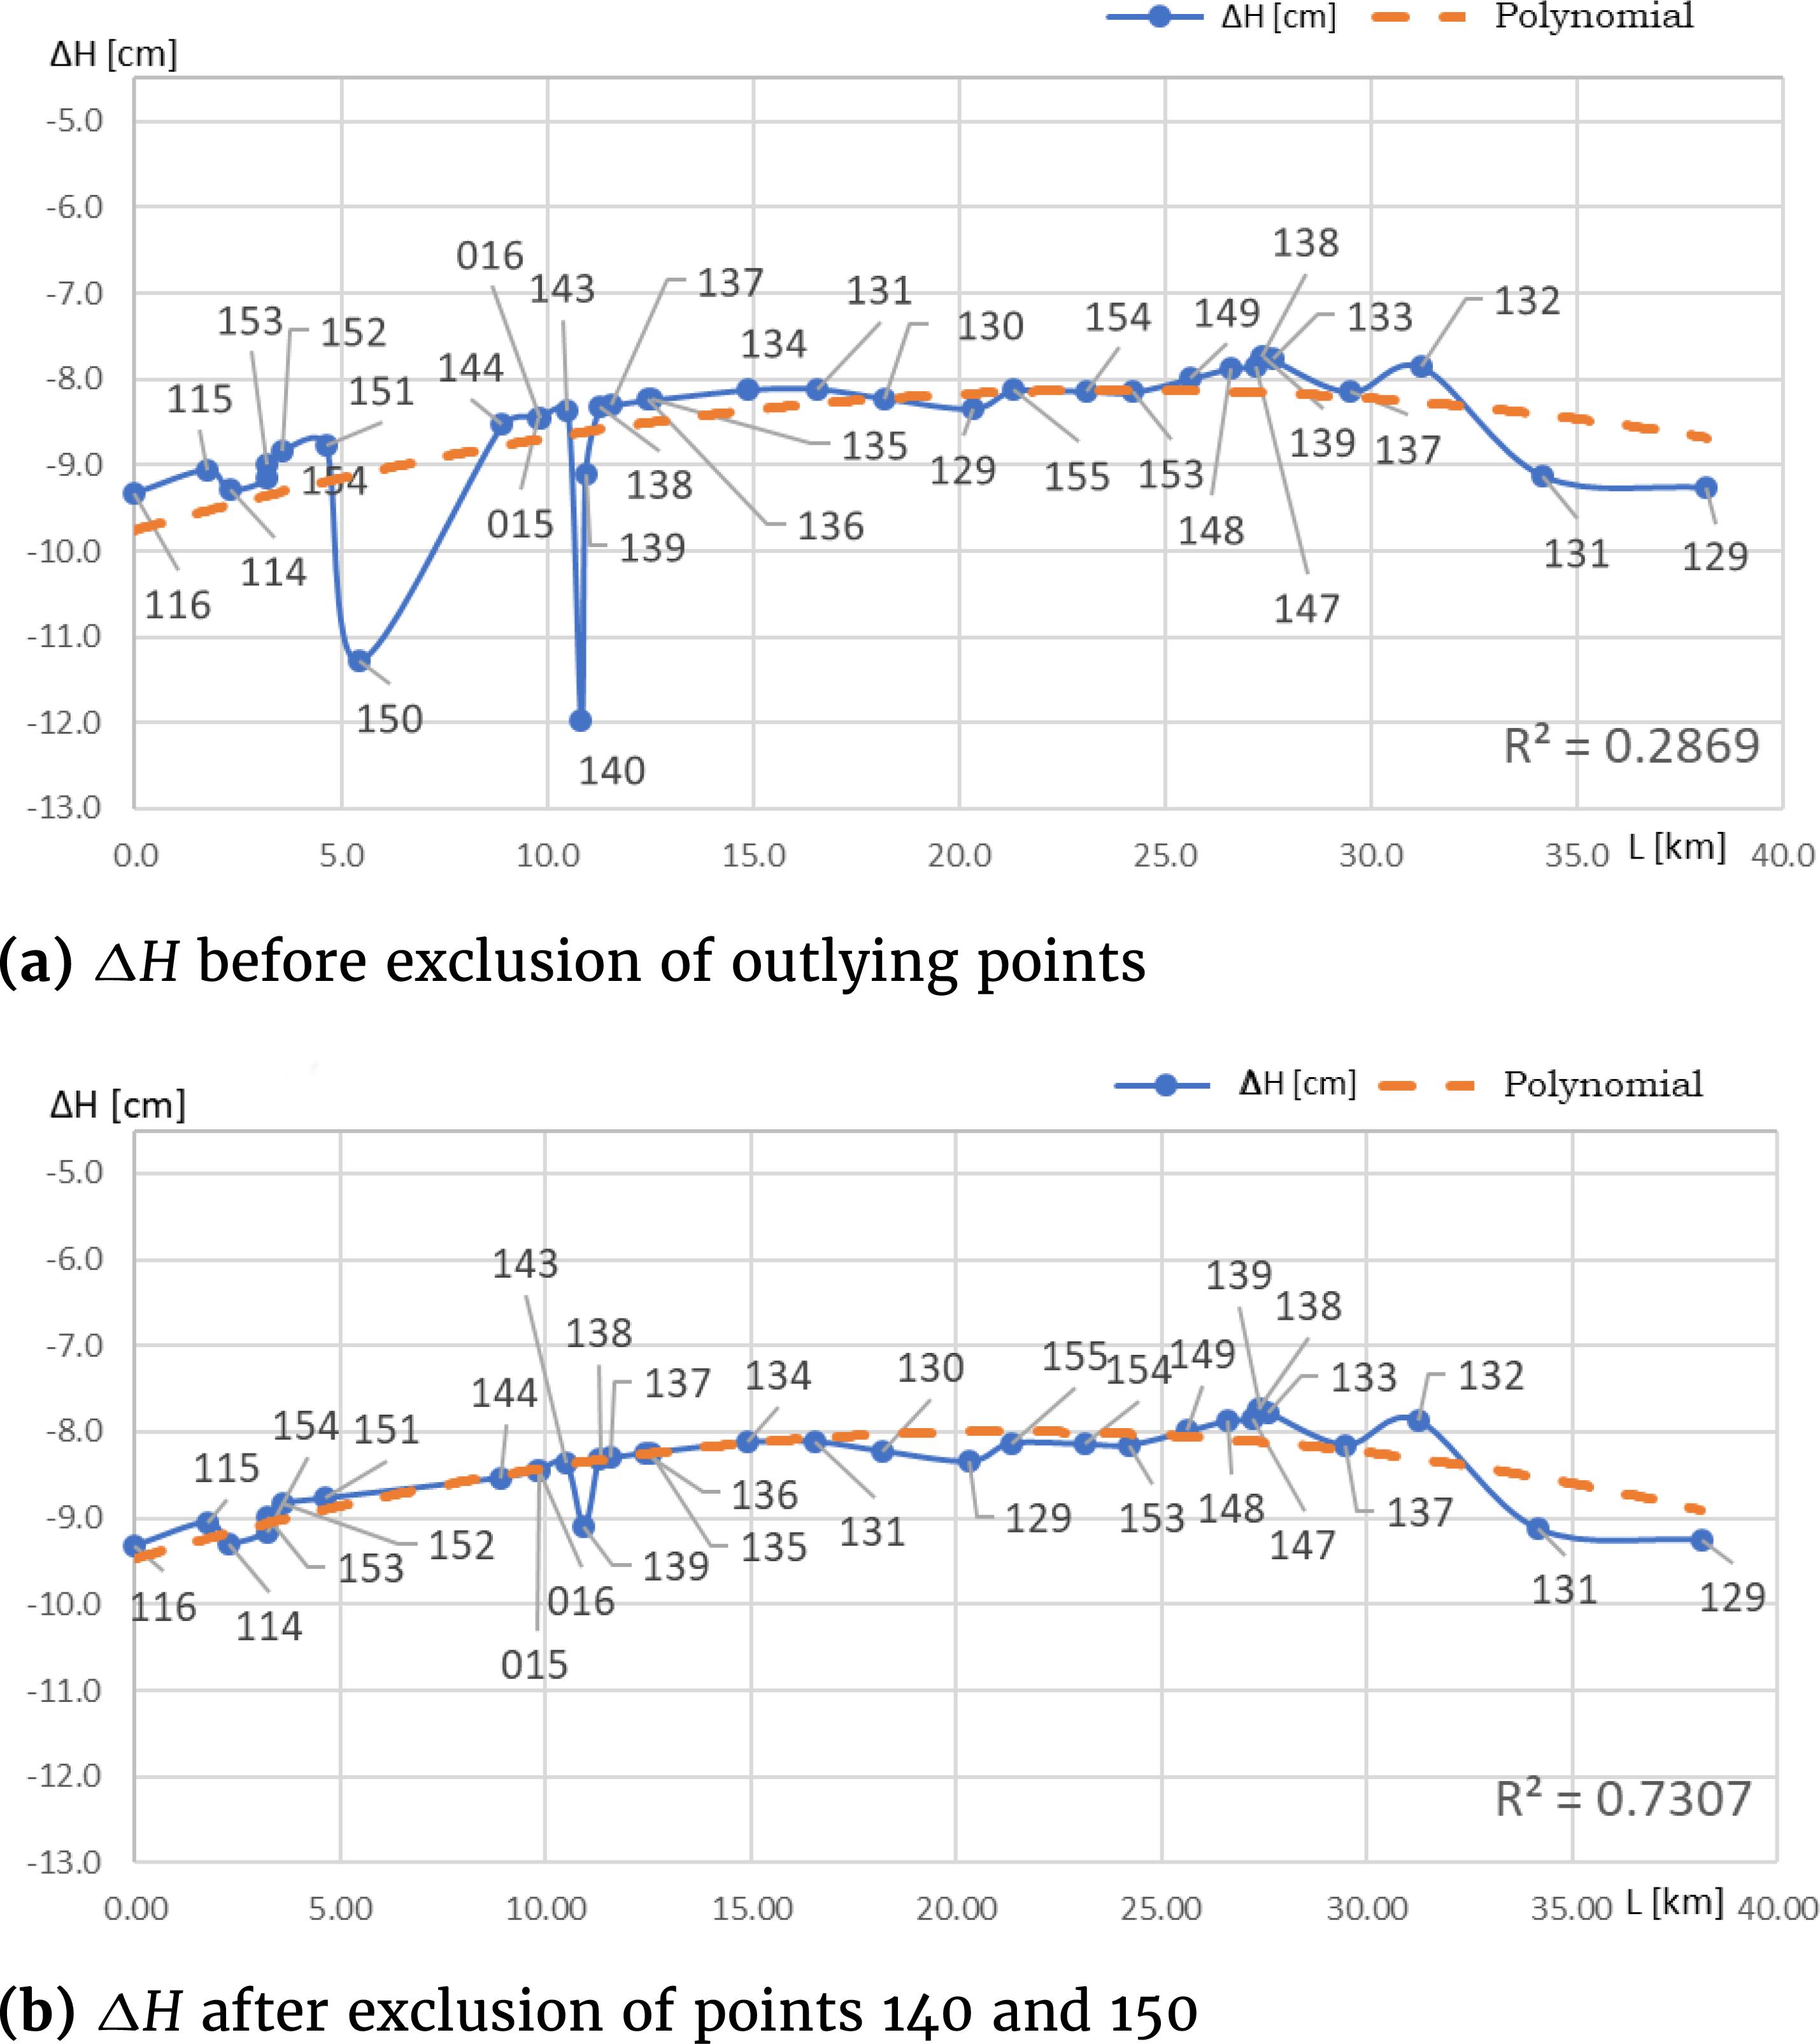
Figure 3

The assessment of the accuracy of the model ΔHKronstadt′60–KRON86: raw data (the points of the reference network) and after adjustments (the Danish method)
| Parameter | Raw data | The Danish method |
|---|---|---|
| Average [cm] | –8.2 | –8.2 |
| Deviation [cm] | 0.9 | 0.6 |
| Maximum [cm] | –6.4 | –6.9 |
| Minimum [cm] | –10.5 | –9.6 |
| Curtosis | –0.11 | –0.04 |
| Skewness | –0.24 | –0.01 |
The recommendations of the GUGiK concerning the conversion of heights depending on the state of data in districts (Somla, 2018)
| Case | The state of the reference network | Recommended method of height calculation | Gross cost [PLN/point]a |
|---|---|---|---|
| 1 |
| Adjustment in PL-EVRF2007-NH frame | 10 |
| 2 |
| Performing control measurements, data verification and adjustment in the PL-EVRF2007-NH frame | 50 |
| 3 |
| Modernisation of the reference network and adjustment in the PL-EVRF2007-NH frame | 700 |
Characteristics of selected elevation frames in Poland
| The name of elevation frame | Measurement campaign | Average error after adjustment [mm/km] | Characteristics of the frame |
|---|---|---|---|
| Kronstadt’60 (Wyrzykowski, 1993) | 1947–1958 | 0.78 |
|
| Kronstadt’86 (Kowalczyk and Rapinski, 2012; Łyszkowicz, 2012) | 1974–1982 | 0.84 |
|
| Kronstadt’2006a (Gajderowicz, 2007; Kowalczyk and Rapinski, 2012) | 1999–2002b | 0.88 |
|
| PL-KRON86-NH (Somla, 2018) | 1974–1982 | 0.91 |
|
| PL-EVRF2007-NH (Mäkinen, 2008; Somla, 2018) | 1999–2012 | 0.91 |
|