

Figure 1
Figure 2
Figure 3
Figure 4

Figure 5
Figure 6
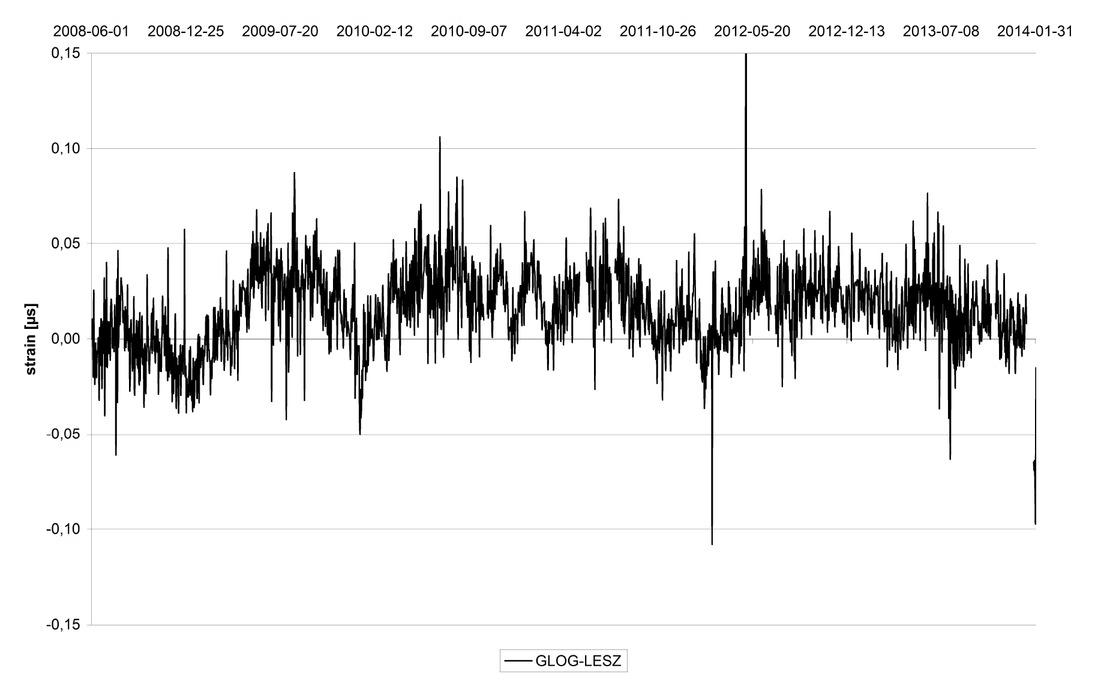
Figure 7

Figure 8
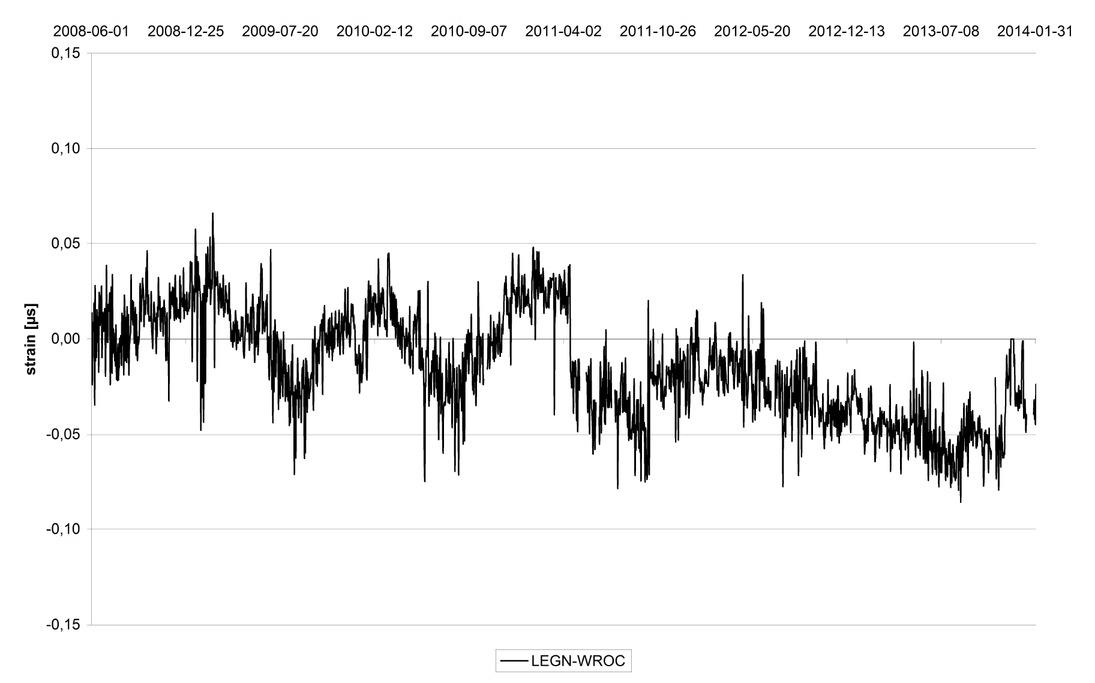
Figure 9
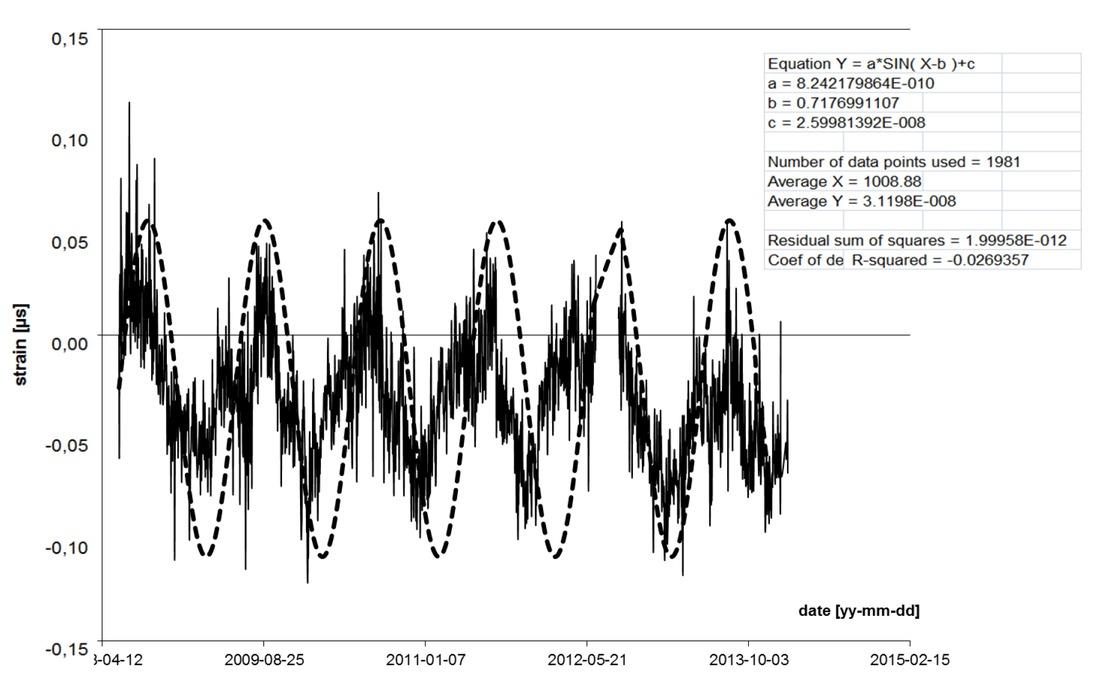
Figure 10
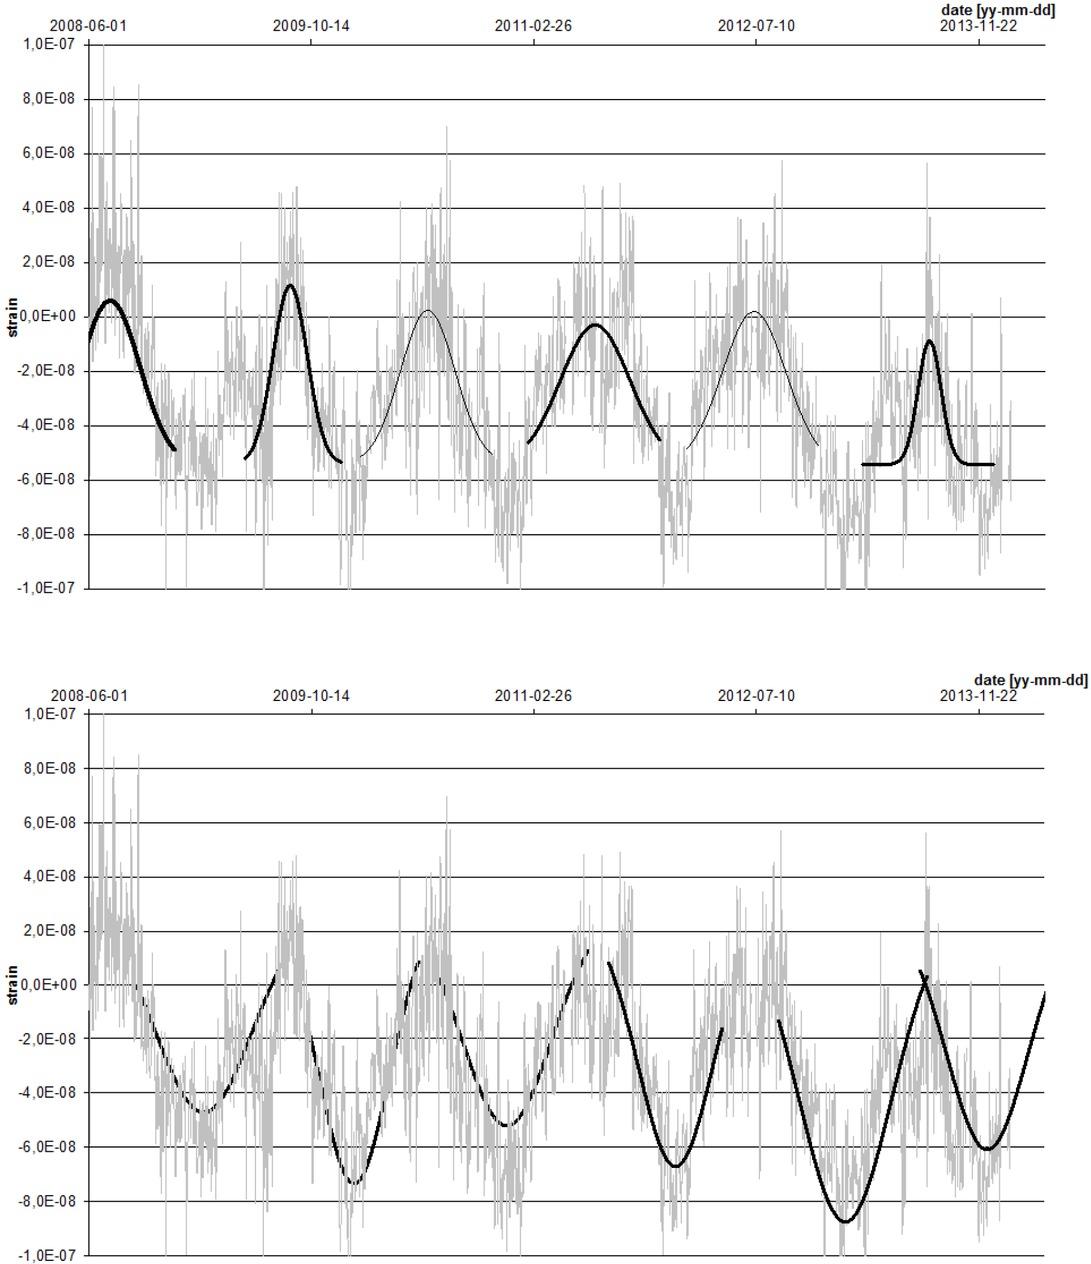
Figure 11
Figure 12
Figure 13
Figure 14

Figure 15
Evaluated parameters of Gaussian peak and the values are expressed in mm/m for positive and negative peaks
| Positive peaks | Negative peaks | |||||
|---|---|---|---|---|---|---|
| Parameter | Parameter successive of peak | Value of parameter | Standard error on parameter value [±] | Parameter of successive peak | Value of parameter | Standard error on parameter value [±] |
| Area under the curve | A1 | 1.00E-05 | 8.7E-07 | A1 | -2.00E-05 | 2.5E-06 |
| A2 | 6.32E-06 | 3.8E-07 | A2 | -2.00E-05 | 1.3E-06 | |
| A3 | 8.69E-06 | 5.2E-07 | A3 | -2.00E-05 | 2.2E-06 | |
| A4 | 1.00E-05 | 6.2E-07 | A4 | -2.00E-05 | 1.7E-06 | |
| A5 | 1.00E-05 | 5.7E-07 | A5 | -3.00E-05 | 2.3E-06 | |
| A6 | 2.94E-06 | 3.0E-07 | A6 | -2.00E-05 | 2.4E-06 | |
| Variance parameter | σ1 | 132.66 | 8.8 | σ1 | 214.57 | 8.8 |
| σ2 | 76.45 | 4.7 | σ2 | 158.53 | 4.7 | |
| σ3 | 122.52 | 7.3 | σ3 | 200.56 | 7.3 | |
| σ4 | 156.23 | 8.1 | σ4 | 168.70 | 8.1 | |
| σ5 | 142.20 | 7.6 | σ5 | 208.56 | 7.6 | |
| σ6 | 51.88 | 5.5 | σ6 | 180.74 | 5.5 | |
| Location parameter (centre of the peak) | Xc1 | 39649.70 | 4.2 | Xc1 | 39857.79 | 3.4 |
| Xc2 | 40053.37 | 2.2 | Xc2 | 40196.02 | 2.8 | |
| Xc3 | 40362.52 | 3.3 | Xc3 | 40538.98 | 2.9 | |
| Xc4 | 40738.03 | 3.7 | Xc4 | 40917.27 | 2.7 | |
| Xc5 | 41093.74 | 3.4 | Xc5 | 41300.57 | 3.8 | |
| Xc6 | 41489.72 | 2.6 | Xc6 | 41619.09 | 7.2 | |
| Baseline offset | y0 | -5.439E-08 | 1.0542E-09 | y0 | 2.74E-08 | 4.987E-09 |
| Peak height H | H1 | 8.4E-08 | 3.8E-07 | H1 | 2.7E-09 | 2.5E-06 |
| H2 | 8.7E-08 | 5.2E-07 | H2 | 5.6E-09 | 1.3E-06 | |
| H3 | 8.3E-08 | 6.2E-07 | H3 | 8.8E-10 | 2.2E-06 | |
| H4 | 8.0E-08 | 5.7E-07 | H4 | -1.9E-09 | 1.7E-06 | |
| H5 | 8.2E-08 | 3.0E-07 | H5 | 6.5E-10 | 2.3E-06 | |
| H6 | 7.7E-08 | 8.8E+00 | H6 | -4.8E-09 | 2.4E-06 | |