
TABLE 1.
Clinical data of patient and tumour characteristics
| N (%) | |
|---|---|
| Sex | |
| Male | 9 (24.3) |
| Female | 28 (75.7) |
| Mean age, years (range) | 55 (30–78) |
| Histopathological diagnosis | |
| LAMN | 32 (86.5) |
| HAMN | 2 (5.4) |
| Ovarian mucinous borderline tumour | 3 (8.1) |
| Peritoneal Cancer Index (PCI) | 17.19 |
| Mean (range) | (1–39) |
| Completeness of Cytoreduction (CC) Score | |
| 0/1 | 34 (91.9) |
| 2 | 3 (8.1) |
| 3 | 0 |
| Prior Surgical Score (PSS) | |
| 0 | 10 (27) |
| 1 | 14 (37.8) |
| 2 | 8 (21.6) |
| 3 | 5 (13.5) |
| Median Lenght of Hospital Stay days (range) | 18 (8–112) |
| Complications Clavien-Dindo III/IV | 7 (18.9) |
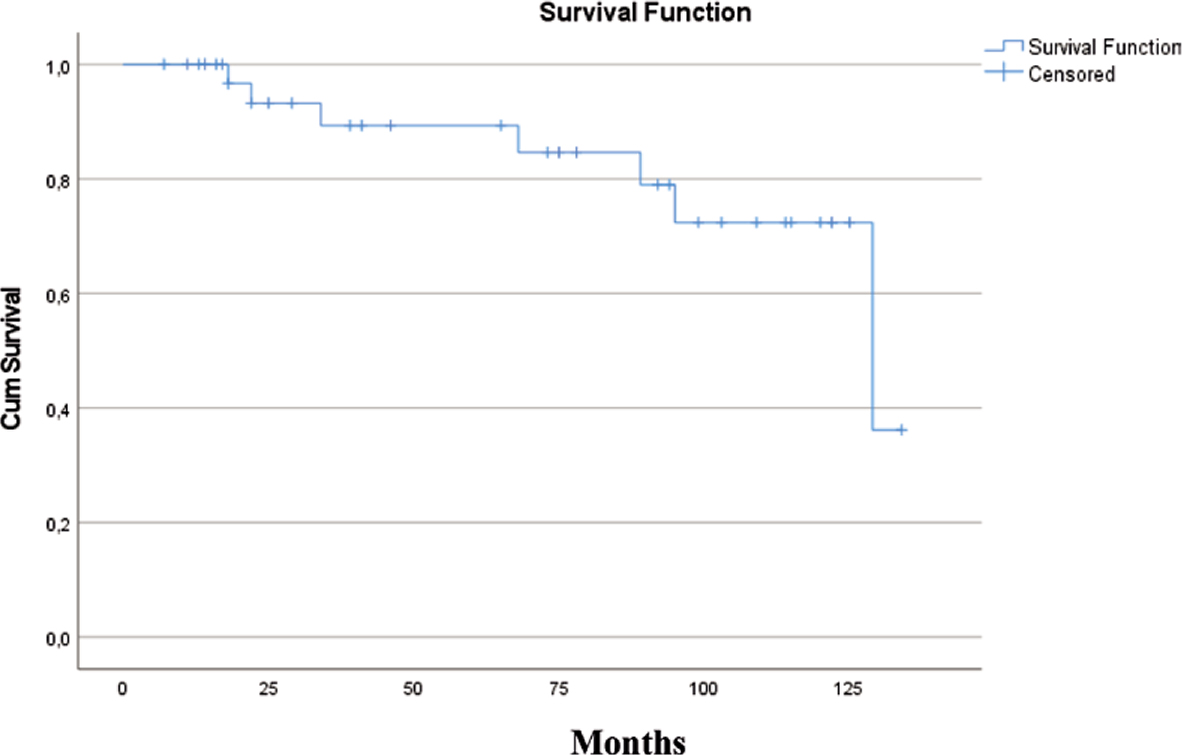
FIGURE 1.
Kaplan- Meier curve: overall survival (OS) in presented patient cohort
TABLE 2.
Univariate analysis, factors affecting overall survival (OS)
| P | |
|---|---|
| Sex | NS |
| Age | NS |
| Prior Surgical Score (PSS) | NS |
| Peritoneal Cancer Index (PCI) | 0.003 |
| Completeness of Cytoreduction Score (CC) | 0.025 |
| ASA | NS |
| Histology | NS |
| CEA | 0.004 |
| CA 19-9 | 0.008 |
| CA 125 | NS |
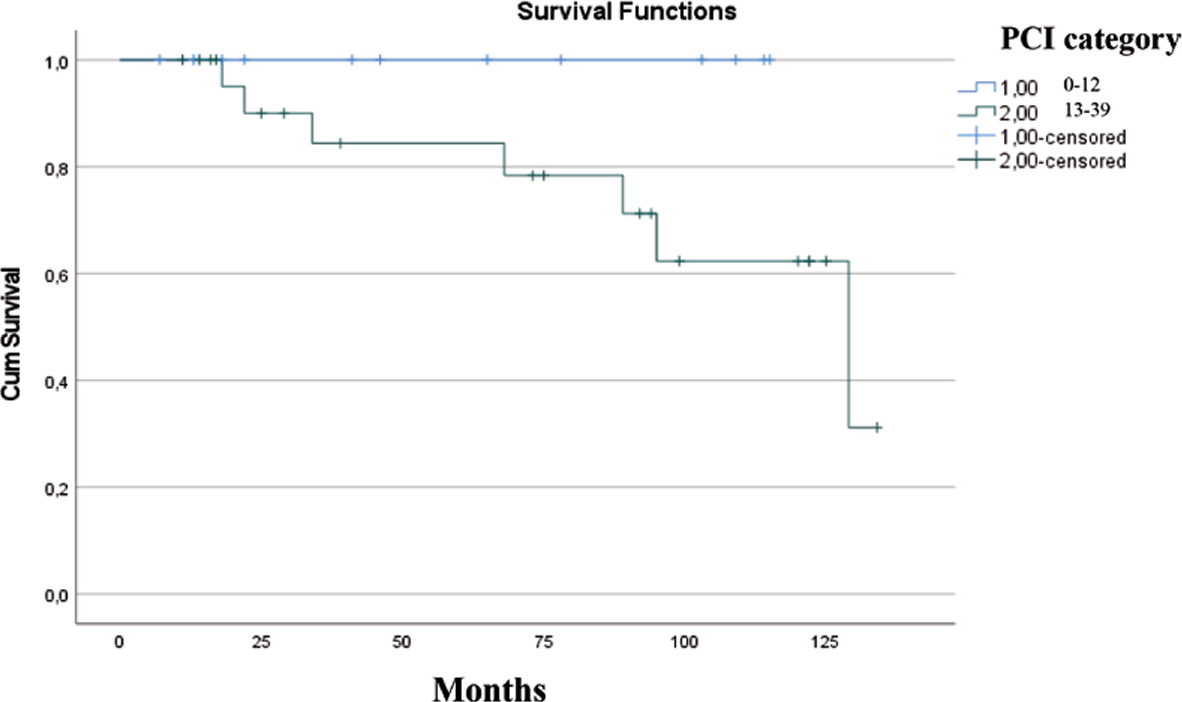
FIGURE 2.
Kaplan-Meier curves: overall survival (OS) according to Peritoneal Cancer Index (PCI) score category
TABLE 3.
Multivariate analysis, independent prognostic factors of overall survival (OS)
| P | |
|---|---|
| Sex | NS |
| Age | NS |
| Prior Surgical Score (PSS) | NS |
| Peritoneal Cancer Index (PCI) | NS |
| Completeness of Cytoreduction Score (CC) | 0.013 |
| ASA | NS |
| Histology | NS |
| CEA | NS |
| CA 19-9 | 0.025 |
| CA 125 | NS |
TABLE 4.
Univariate analysis of factors affecting disease free survival (DFS)
| P | |
|---|---|
| Sex | 0.005 |
| Age | 0.036 |
| Prior Surgical Score (PSS) | NS |
| Peritoneal Cancer Index (PCI) | 0.004 |
| Completeness of Cytoreduction Score (CC) | 0.007 |
| ASA | NS |
| Histology | NS |
| CEA | NS |
| CA 19-9 | NS |
| CA 125 | NS |