
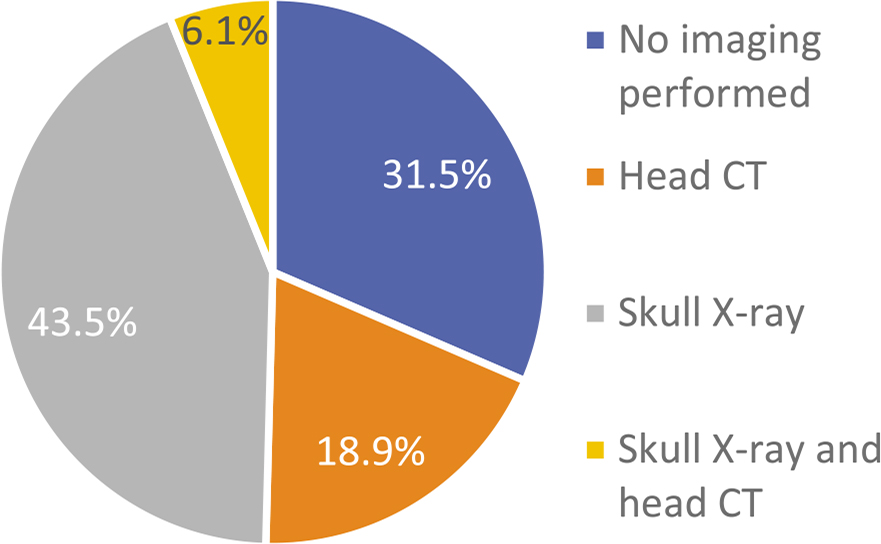
FIGURE 1.
Imaging utilization.
TABLE 1.
Imaging findings in skull X-ray and head CT
| Head CT findings | N (%) | Skull X-ray findings | N (%) |
|---|---|---|---|
| No evidence of bone or brain injury | 2,093 (67.5) | No reliable signs of injury | 5,960 (97.0) |
| Fracture without intracranial haemorrhage | 261 (8.4) | Skull fracture | 153 (2.5) |
| Fracture with intracranial haemorrhage | 308 (9.9) | Isolated nasal bone fracture | 33 (0.5) |
| Intracranial haemorrhage without fracture | 441 (14.2) |
TABLE 2.
Diagnostic performance metrics of skull X-ray for fractures
| Sensitivity | Specificity | PPV | NPV |
|---|---|---|---|
| 43.6 % | 91.4 % | 48.1 % | 89.9 % |