
TABLE 1.
Characteristics of the 2 groups of patients treated with combined treatment with ECT and RT
| ECT → RT (N = 18) | RT → ECT (N = 19) | P | |||||
|---|---|---|---|---|---|---|---|
| TYPE | N | % | TYPE | N | % | Value | |
| DIAGNOSIS* | MM | 0 | 0% | MM | 1 | 5% | 0.8896 |
| BCC | 7 | 40% | BCC | 5 | 26% | ||
| MA | 1 | 5% | MA | 2 | 11% | ||
| SCC | 9 | 50% | SCC | 9 | 48% | ||
| SAR | 1 | 5% | SAR | 1 | 5% | ||
| OTH | 0 | 0% | OTH | 1 | 5% | ||
| T-STAGE | T1 | 3 | 17% | T1 | 6 | 32% | 0.5381 |
| T2 | 10 | 56% | T2 | 6 | 32% | ||
| T3 | 1 | 5% | T3 | 4 | 20% | ||
| T4 | 3 | 17% | T4 | 3 | 16% | ||
| TX | 1 | 5% | TX | 0 | 0% | ||
| MEAN | ST.DEV. | MEDIAN (RANGE) | MEAN | ST.DEV. | MEDIAN (RANGE) | ||
| AGE | 80 | 10 | 83 (59-94) | 81 | 13 | 87 (50-96) | 0.7102 |
| NODULES’ SIZE (mm) | 36 | 25 | 30 (14-130) | 40 | 41 | 30 (2-170) | 0.6513 |
| MONTHS BETWEEN TREATMENTS | 5.7 | 3.6 | 5.3 (1-12) | 7.6 | 4.1 | 8 (1-12) | 0.1587 |
TABLE 2.
Data on treatments (RT and ECT) in the two groups of patients
| ECT → RT (N = 18) | RT → ECT (N = 19) | P | |||||
|---|---|---|---|---|---|---|---|
| TYPE | N | % | N | % | Value | ||
| ELECTRODE | plate | 0 | 0% | plate | 2 | 11% | 0.3955 |
| linear | 8 | 44% | linear | 8 | 42% | ||
| hexagonal | 9 | 50% | hexagonal | 9 | 47% | ||
| multiple | 1 | 6% | multiple | 0 | 0% | ||
| DRUG | I.V. | 14 | 78% | I.V. | 13 | 68% | 0.7140 |
| ADMINISTERED | I.T. | 4 | 22% | I.T. | 6 | 32% | |
| IRRADIATION | photons | 14 | 78% | photons | 15 | 79% | 1.000 |
| electrons | 4 | 22% | electrons | 4 | 21% | ||
TABLE 3.
Reasons for the second treatment in the two groups of patients (p = 0.0423)
| REASON FOR 2ND TREATMENT | After PR of previous treatment | After SD or PD of previous treatment | Relapse after CR of previous treatment |
|---|---|---|---|
| ECT → RT (N=18) | 12 | 4 | 2 |
| Reason for RT | 67% | 22% | 11% |
| RT → ECT (N=19) | 5 | 11 | 3 |
| Reason for ECT | 26% | 58% | 16% |
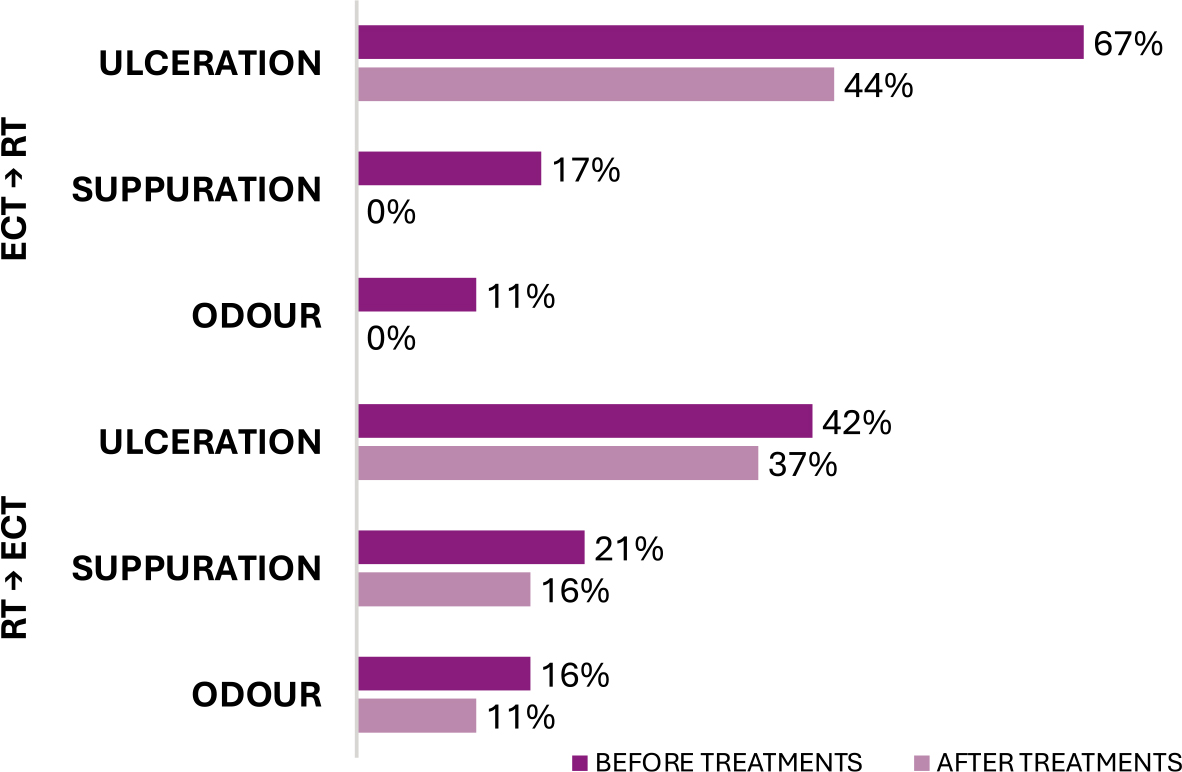
FIGURE 1.
Incidence of most common local symptoms in the two groups before and after the treatments.
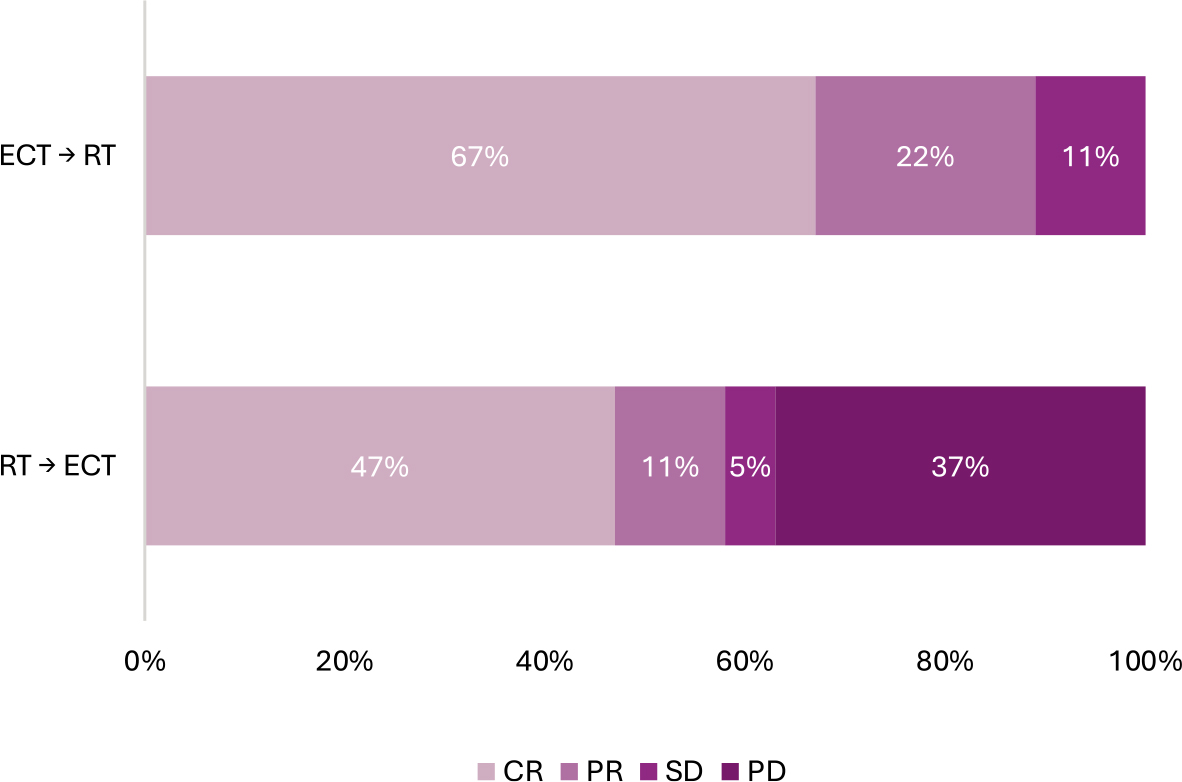
FIGURE 2.
Distribution of short-term response in the 2 groups after the sequence of both treatments.
CR = complete response; PR = partial response; SD = stable disease; PD = progressive disease
TABLE 4.
Short term response in the 2 groups after the sequence of both treatments
| ECT → RT | RT → ECT | P VALUE | |||
|---|---|---|---|---|---|
| N | % | N | % | ||
| CR | 12 | 67% | 9 | 47% | 0.0383 |
| PR | 4 | 22% | 2 | 11% | |
| SD | 2 | 11% | 1 | 5% | |
| PD | 0 | 0% | 7 | 37% | |
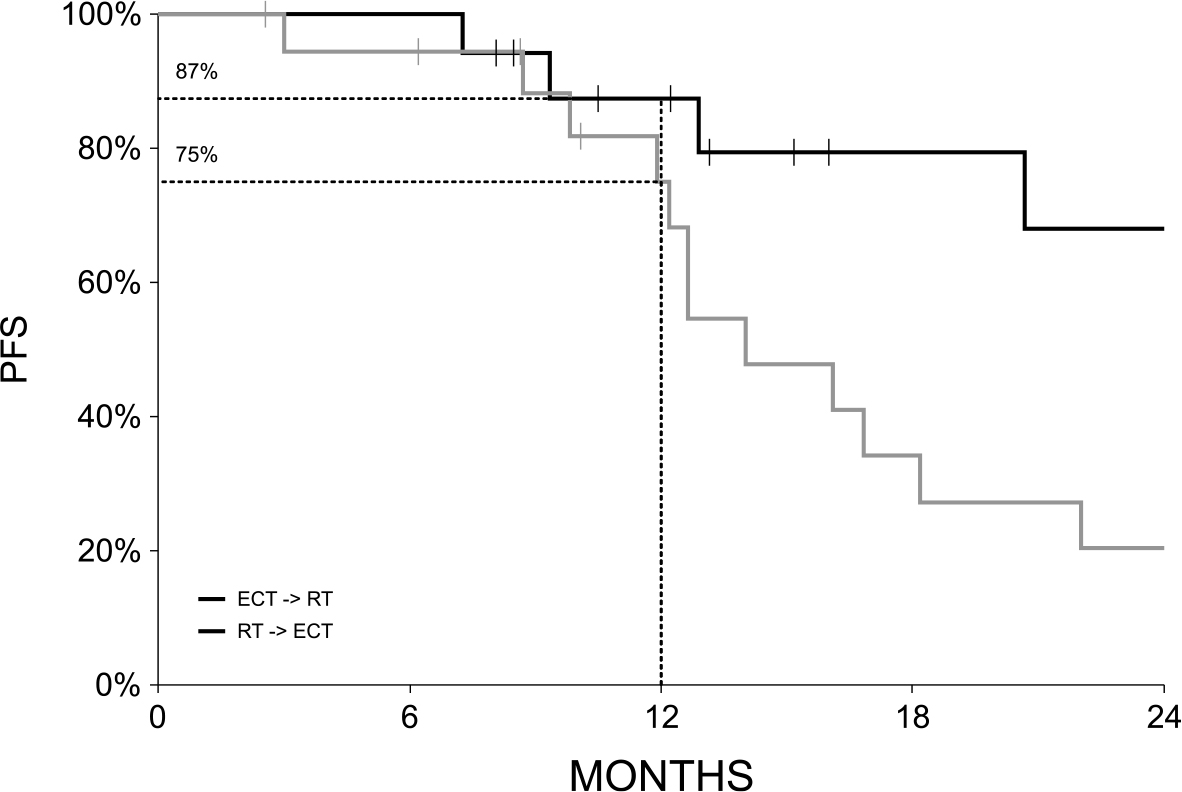
FIGURE 3.
Progression free survival (PFS) Kaplan-Meier curves.