
TABLE 1.
Clinical characteristics of patients with NSCLC
| Characteristics | Frequencies N/(%) |
|---|---|
| Gender | |
| Male | 31 (60.2%) |
| Female | 20 (39.8%) |
| Age (years) | |
| Average | 66.8 |
| Range | 50–84 |
| Smoking status | |
| Non-smokers | 3 (5.9%) |
| Active smokers | 39 (76.5%) |
| Former smokers | 9 (17.6%) |
| Pack-year index | |
| Average | 48.5 |
| Range | 0–150 |
| Body mass index (BMI) | |
| Average | 25.4 |
| < 18.5 | 3 (5.9%) |
| 18.5–24.9 | 22 (43.1%) |
| 25.0–29.9 | 23 (45.1%) |
| 30.0–34.9 | 1 (2.0%) |
| > 40.0 | 2 (3.9%) |
| ECOG performance status | |
| 0 | 1 (2.0%) |
| 1 | 50 (98.0%) |
TABLE 2.
Pathological characteristics and TNM staging
| Histological subtype of NSCLC | |||||
|---|---|---|---|---|---|
| Squamous | 22 (43.1%) | ||||
| Non-squamous (adenocarcinoma) | 29 (56.9%) | ||||
| TNM classification | |||||
| T | N | M | |||
| T1a | 1 (2.0%) | 0 | 10 (19.6%) | 1a | 20 (41.2%) |
| T1b | 3 (5.9%) | 1 | 3 (5.9%) | 1b | 16 (31.4%) |
| T1c | 3 (5.9%) | 2 | 20 (39.2%) | 1c | 15 (27.5%) |
| T2a | 2 (3.9%) | 3 | 18 (35.3%) | ||
| T2b | 6 (11.8%) | ||||
| T3 | 7 (13.7%) | ||||
| T4 | 29 (56.9%) | ||||
| Stage | |||||
| IVA | IVB | ||||
| 36 (70.6%) | 15 (29.4%) | ||||
TABLE 3.
Levels of PD-L1 expression
| PD-L1 expression N/(%) | |
|---|---|
| 50–59% | 5 (9.8%) |
| 60–69% | 11 (21.6%) |
| 70–79% | 9 (17.6%) |
| 80–89% | 13 (25.5%) |
| 90–100% | 13 (25.5%) |
TABLE 4.
Duration of treatment and number of cycles with pembrolizumab
| DURATION OF TREATMENT (months) | |
|---|---|
| Average | 18.3 |
| Range | 2–60 |
| NUMBER OF CYCLES WITH PEMBROLIZUMB | |
| Average | 21.3 cycles |
| Range | 2–61 cycles |
TABLE 5.
Radiological response to treatment according to the iRECIST criteria
| (immuno) RADIOLOGICAL RESPONSE TO TRETMENT (iRECIST) | |
|---|---|
| Complete response (CR) | 0 (0%) |
| Partial response (PR) | 19 (37.3%) |
| Stable disease (SD) | 26 (51.0%) |
| Progressive disease (PD) | 6 (11.8%) |
| Overall response rate (ORR) | 37.2% |
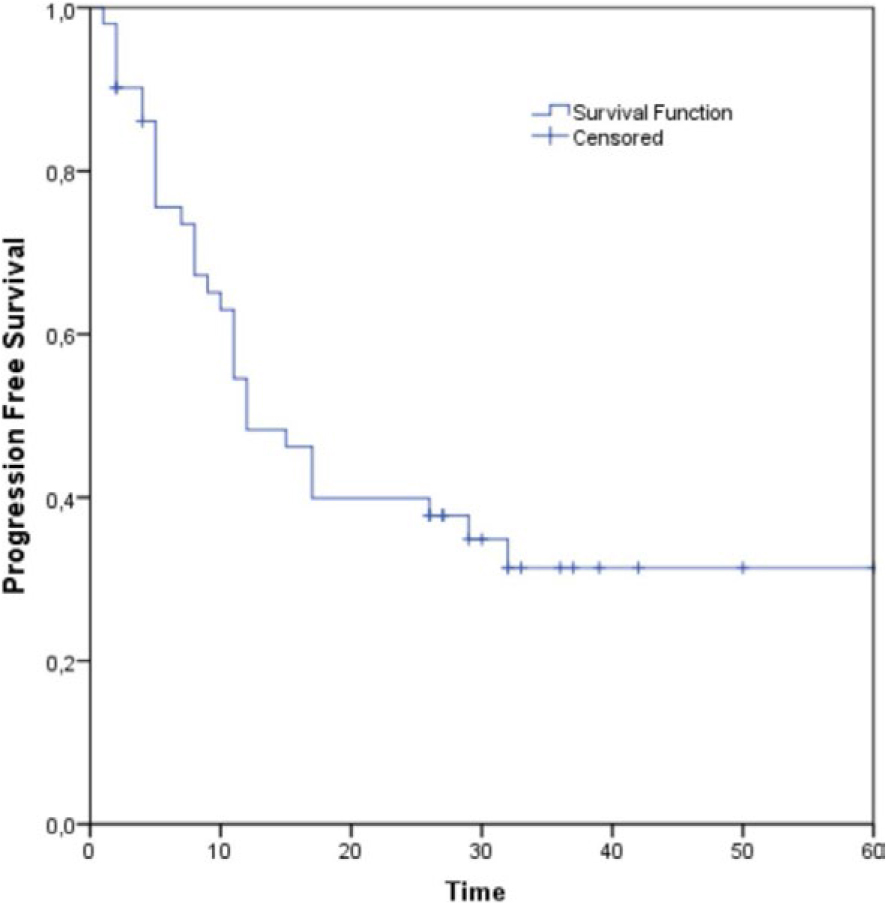
FIGURE 1.
Progression free survival (PFS) for all patients evaluated in the real-world data (RWD) analysis.
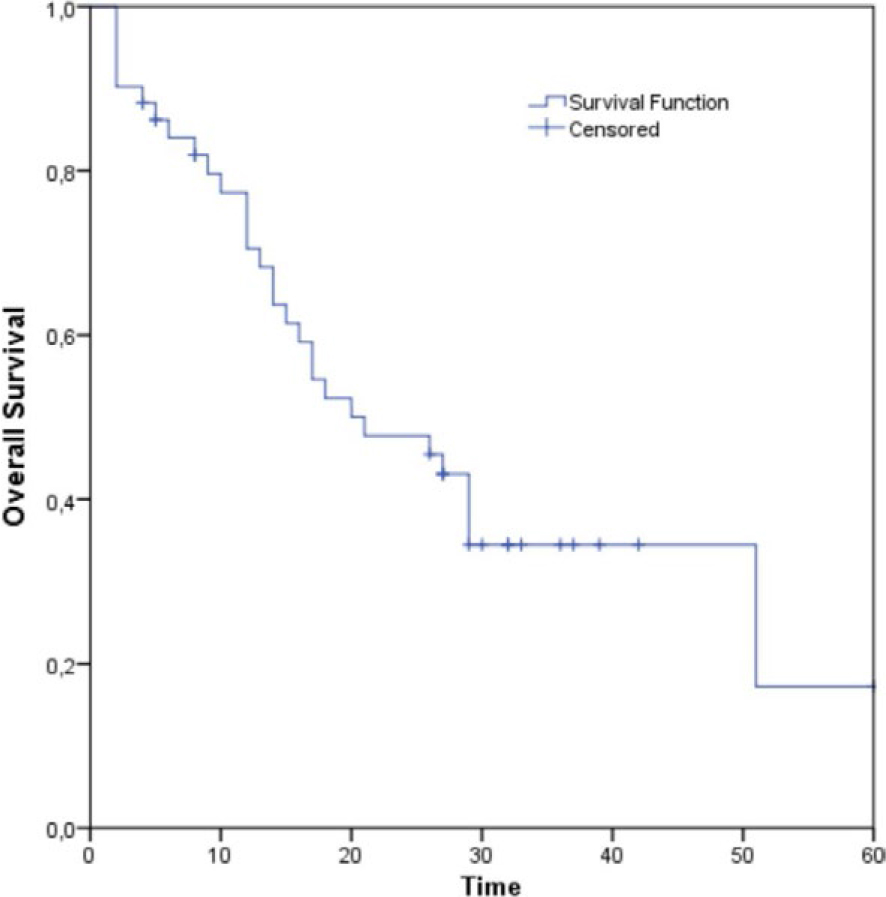
FIGURE 2.
Overall survival (OS) for all patients evaluated in the real-world data (RWD) analysis.
TABLE 6.
Multivariate analysis of patient characteristics in relation to PD-L1 expression
| Characteristic | PD-L1 (50–79%) | PD-L1 (80–100%) | p value |
|---|---|---|---|
| Age (± SD) | 65.4 (7.9) | 68.2 (5.8) | 0.166 |
| Gender, N (%) | |||
| Male | 19 (76.0) | 12 (46.2) | 0.029 |
| Female | 6 (24.0) | 14 (53.8) | |
| BMI | |||
| < 18.5 | 1 (4.0) | 2 (7.7) | 0.394 |
| 18.5–24.9 | 9 (36.0) | 13 (50.0) | |
| 25.0–29.9 | 12 (48.0) | 11 (42.3) | |
| 30.00–34.9 | 1 (4.0) | 0 (0.0) | |
| 35.00–39.9 | 0 (0.0) | 0 (0.0) | |
| > 40 | 2 (8.0) | 0 (0.0) | |
| Smoking status, N (%) | |||
| Nonsmokers | 0 (0.0) | 3 (11.5) | 0.099 |
| Smokers | 22 (88.0) | 17 (65.4) | |
| Former smokers | 3 (12.0) | 6 (23.1) | |
| Type of NSCLC, N (%) | |||
| Squamous | 11 (44.0) | 11 (42.3) | 0.903 |
| Non-squamous | 14 (56.0) | 15 (57.7) | |
| Stage, N (%) | |||
| IVa | 21 (84.0) | 15 (57.7) | 0.039 |
| IVb | 4 (16.0) | 11 (42.3) | |
| Best response, N (%) | |||
| PR | 12 (48.0) | 7 (26.9) | 0.262 |
| SD | 10 (40.0) | 16 (61.5) | |
| PD | 3 (12.0) | 3 (11.5) | |
| Progression, N (%) | |||
| No | 13 (52.0) | 11 (42.3) | 0.488 |
| Yes | 12 (48.0) | 15 (57.7) | |
| Outcome, N (%) | |||
| Alive | 12 (48.0) | 9 (34.6) | 0.332 |
| Deceased | 13 (52.0) | 17 (65.4) | |
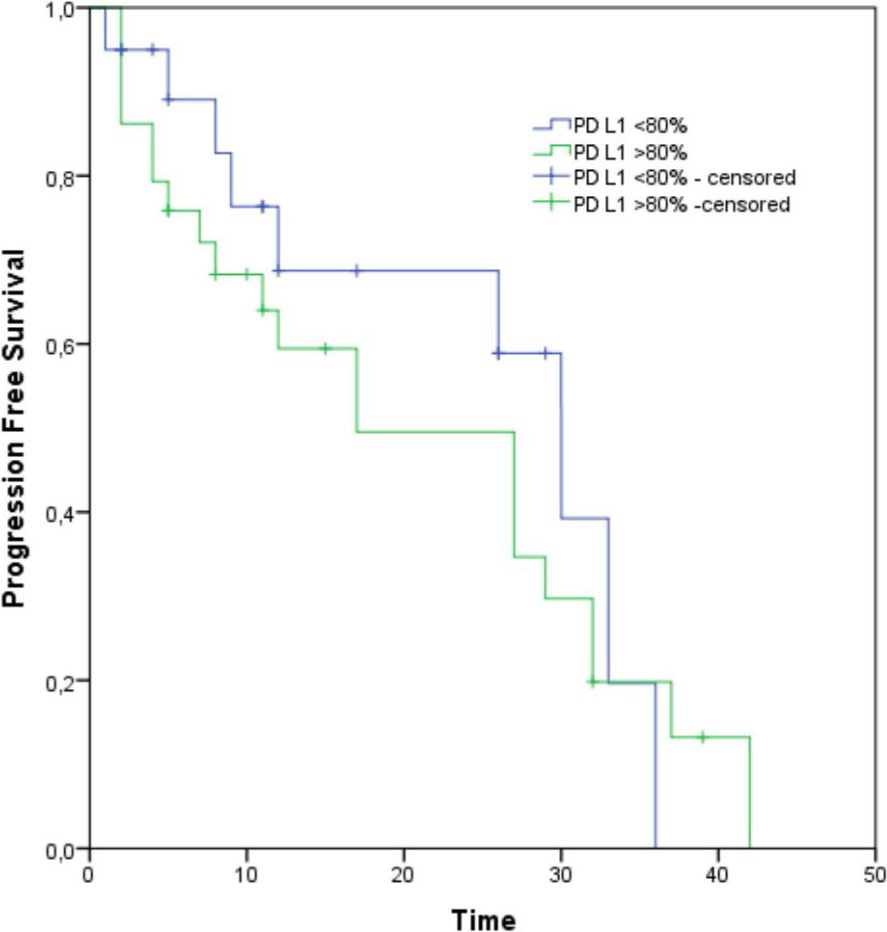
FIGURE 3.
Progression Free Survival (PFS) between PD-L1 ≥ 80% group and PD-L1 < 80%; p = 0.548.
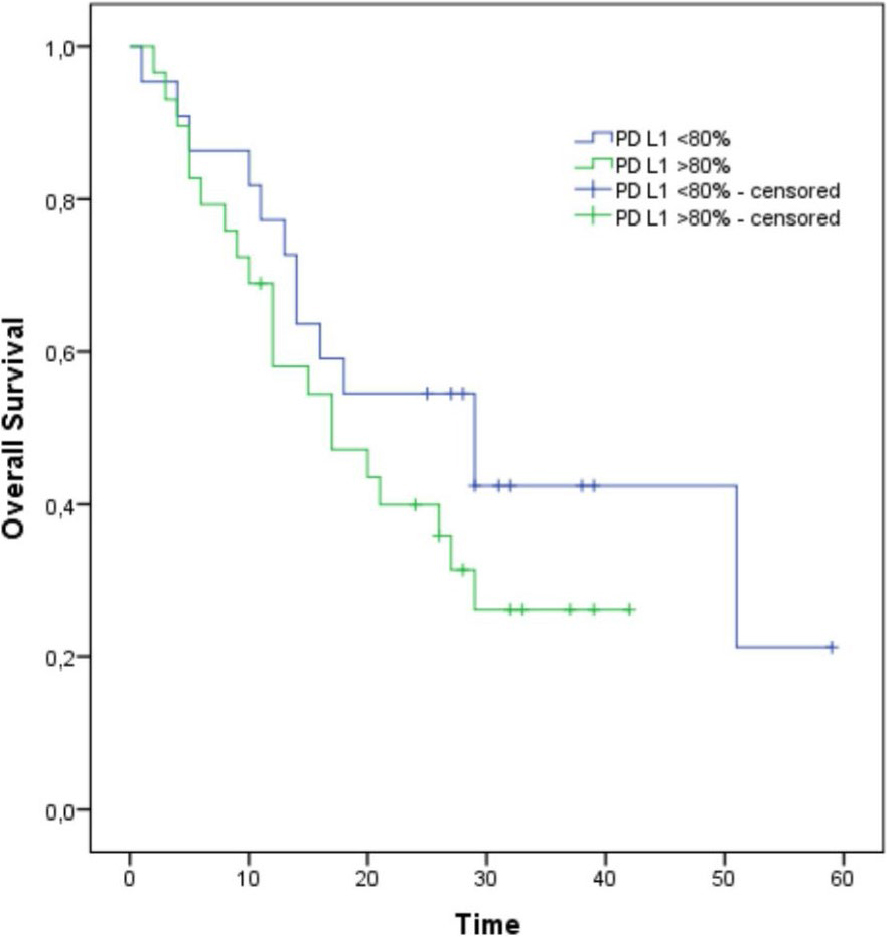
FIGURE 4.
Overall Survival (OS) between PD-L1 ≥ 80% group and PD-L1 < 80%; p = 0.153