
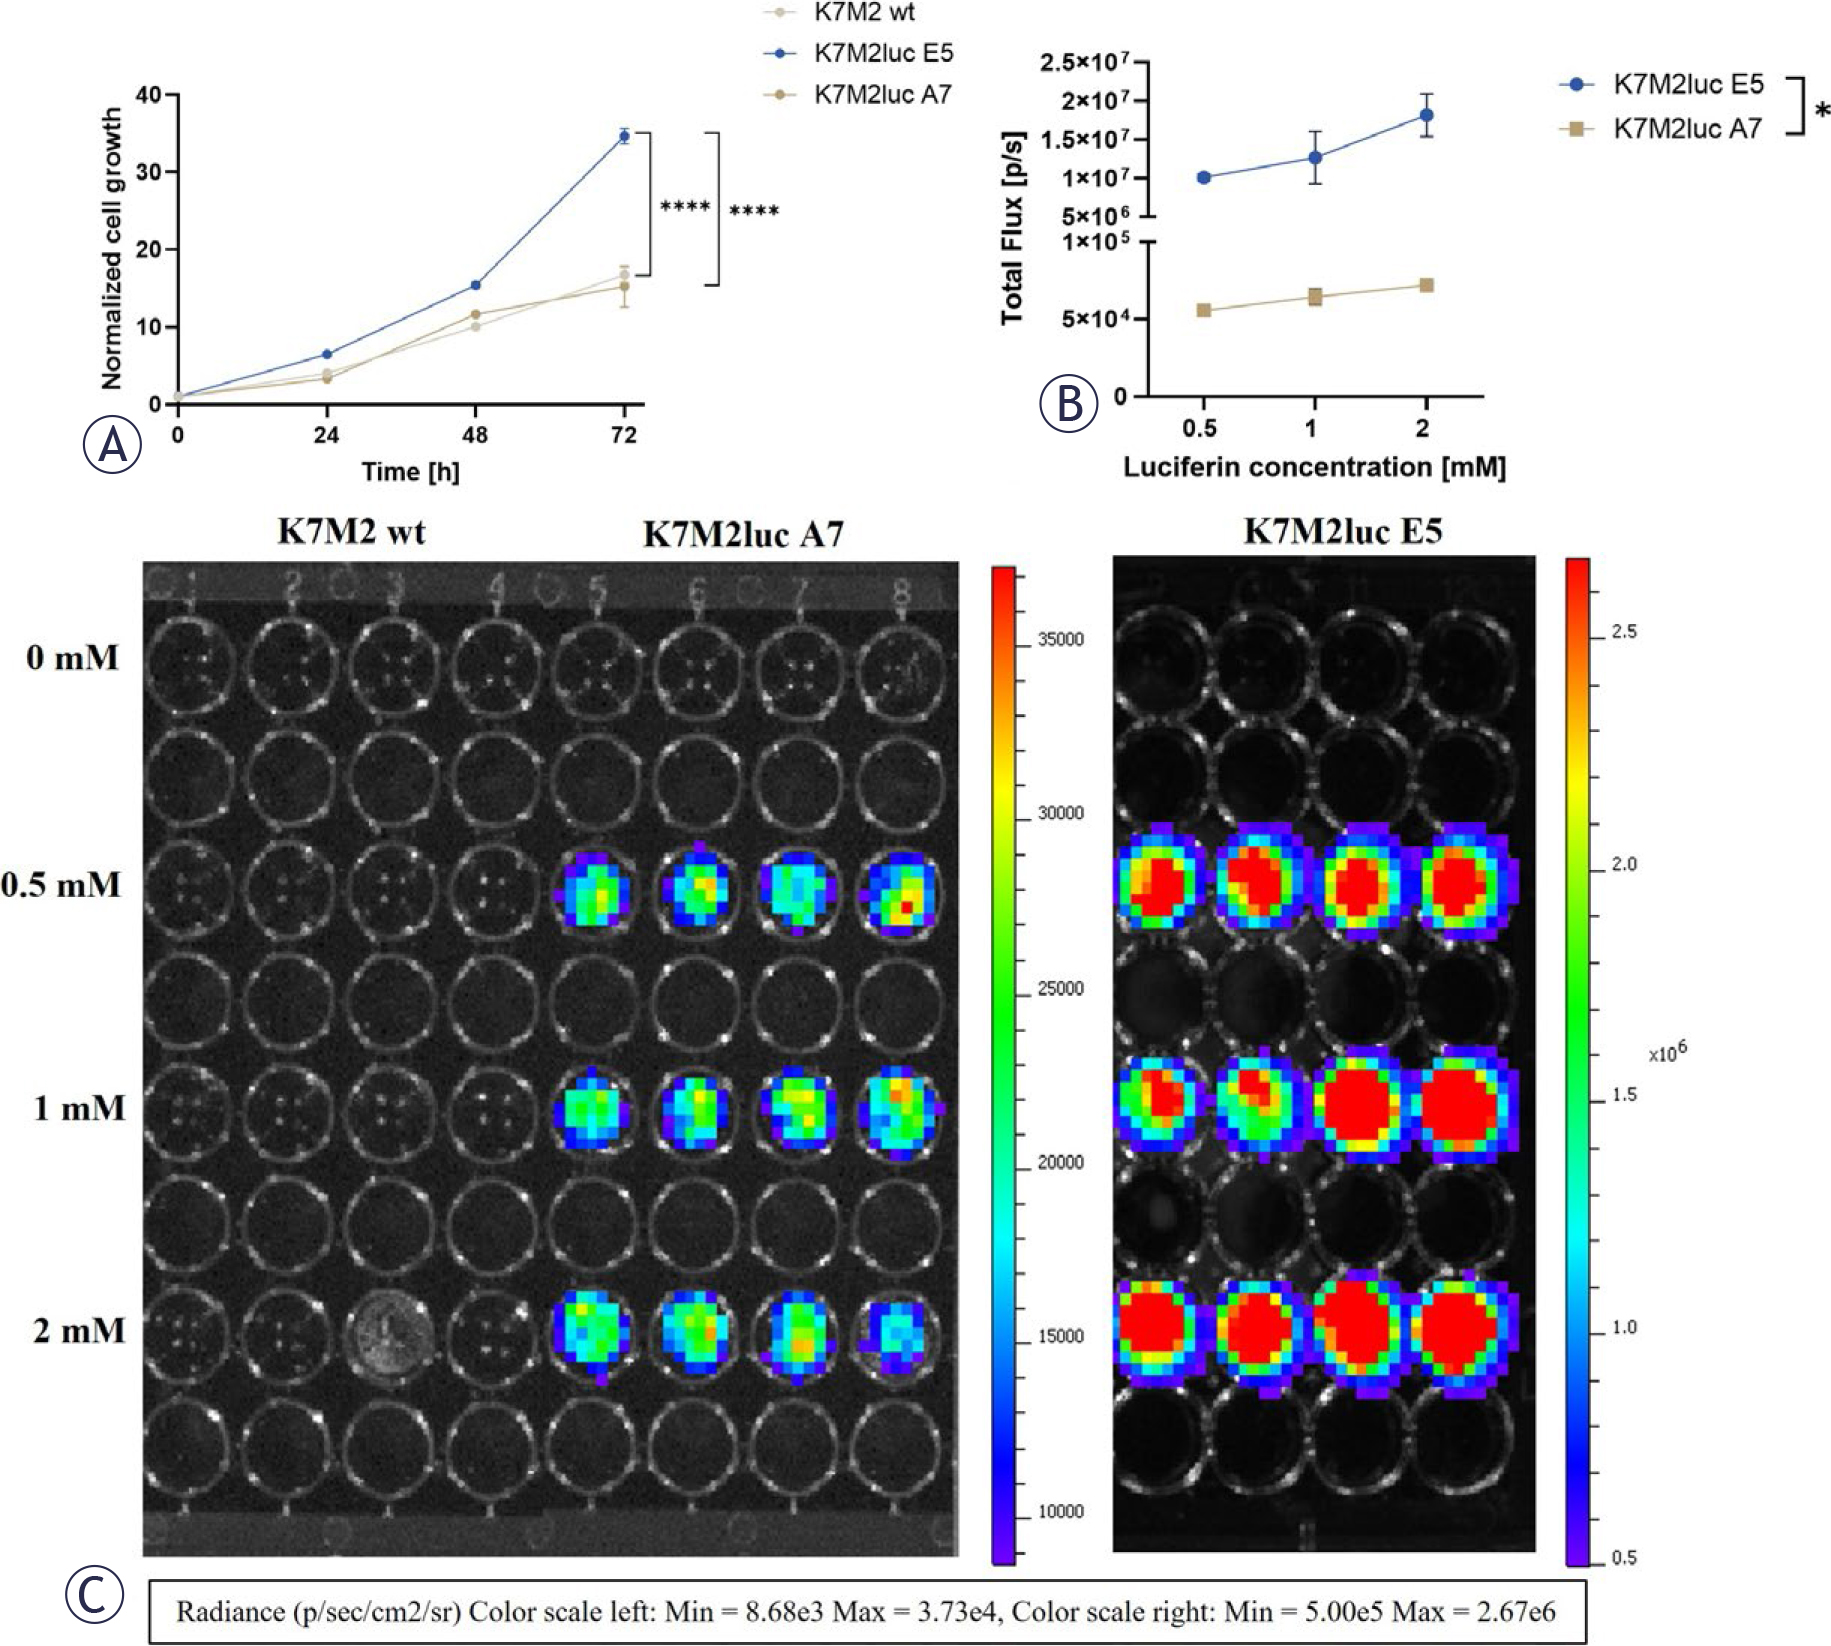
FIGURE 1.
(A) All cell lines show exponential growth during time points 24 h, 48 h and 72 h. (B) K7M2luc A7 and K7M2luc E5 clonal lines show no dose-dependent statistically significant differences in bioluminescent signal, K7M2luc E5 has a higher bioluminescent signal at all added luciferin doses. (C) BLI of cell lines with added luciferin (0 –2 mM). n = 4–12.
Values are presented as Arithmetic Mean (AM) ± Standard Error of the Mean (SEM).
* p < 0.01, **** p < 0.0001. Where not indicated with *, differences are not significant. Paired t-test, one-way ANOVA.
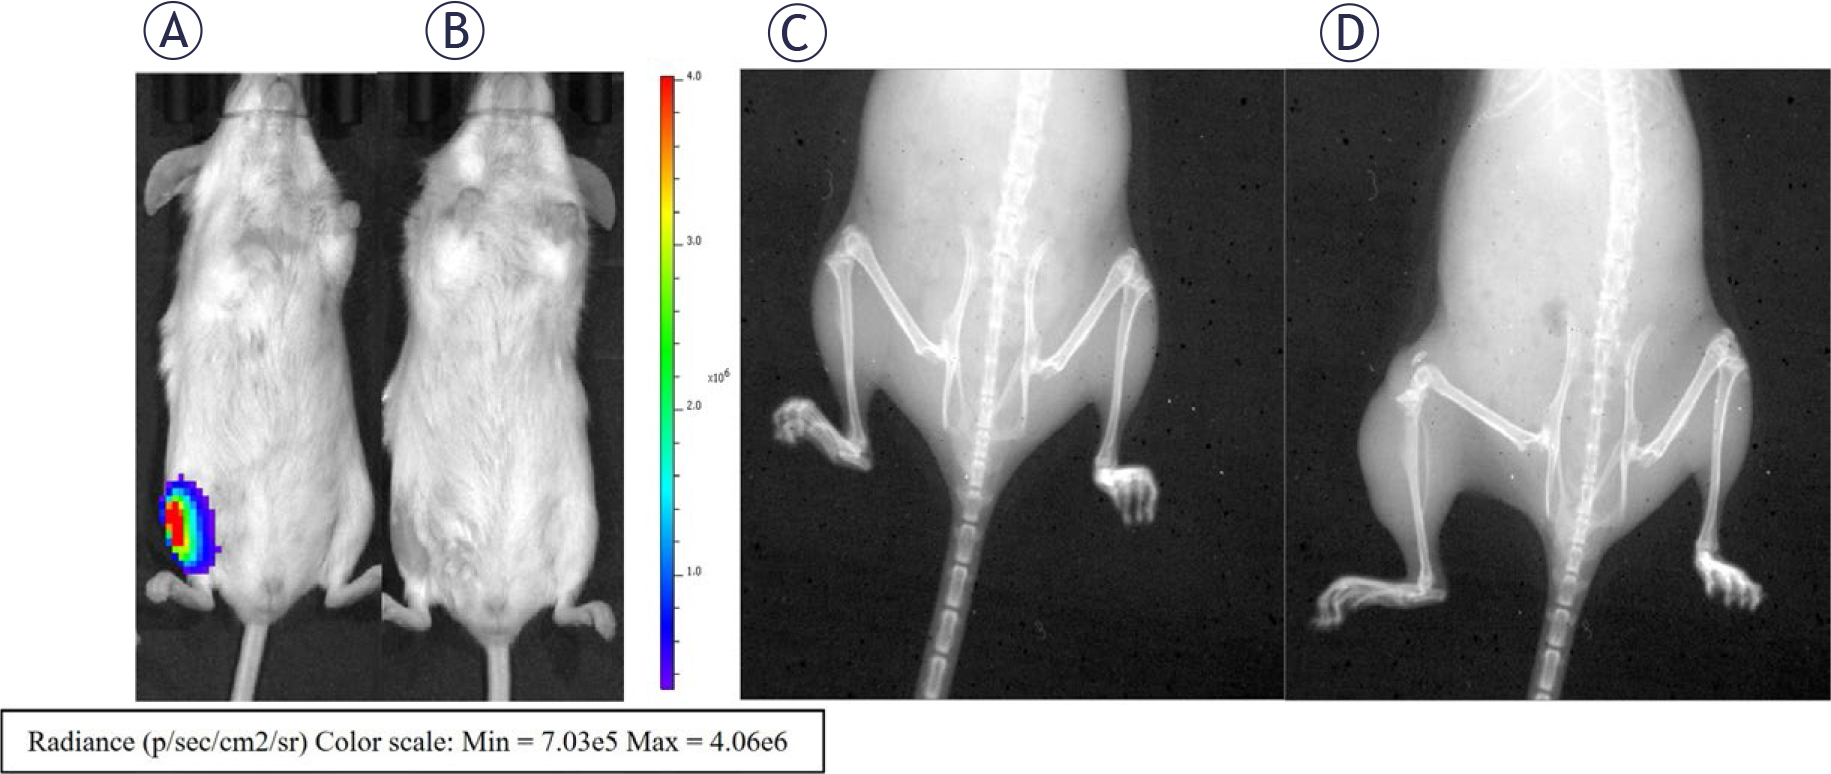
FIGURE 2.
Representative images of BLI and X-ray imaging. BALB/c mice, inoculated with K7M2luc A7 at (A) day 6 and (B) day 8 demonstrating a decrease in signal. BALB/c mice, inoculated with K7M2 wt at (C) day 6 and (D) day 25 demonstrating progressive tumor growth due to bone lysis.
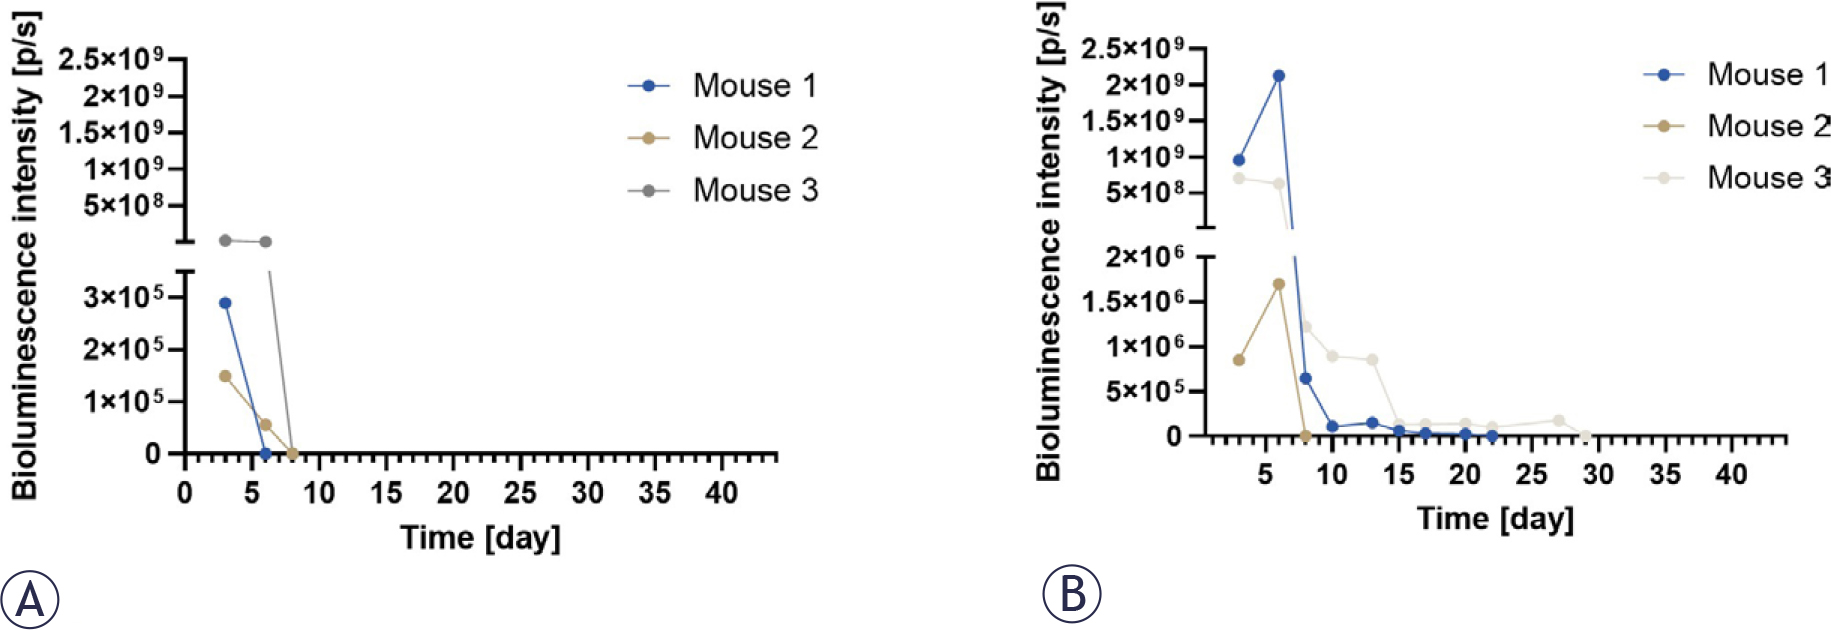
FIGURE 3.
(A) BALB/c mice, inoculated with K7M2luc A7, showed a strong signal on day 3 with a drastic drop on day 6. (B) K7M2luc E5-inoculated BALB/c mice had an increase in signal strength on day 6 and a delayed fall day 8–29. n = 3.
Values are presented as Arithmetic Mean (AM) ± Standard Error of the Mean (SEM).
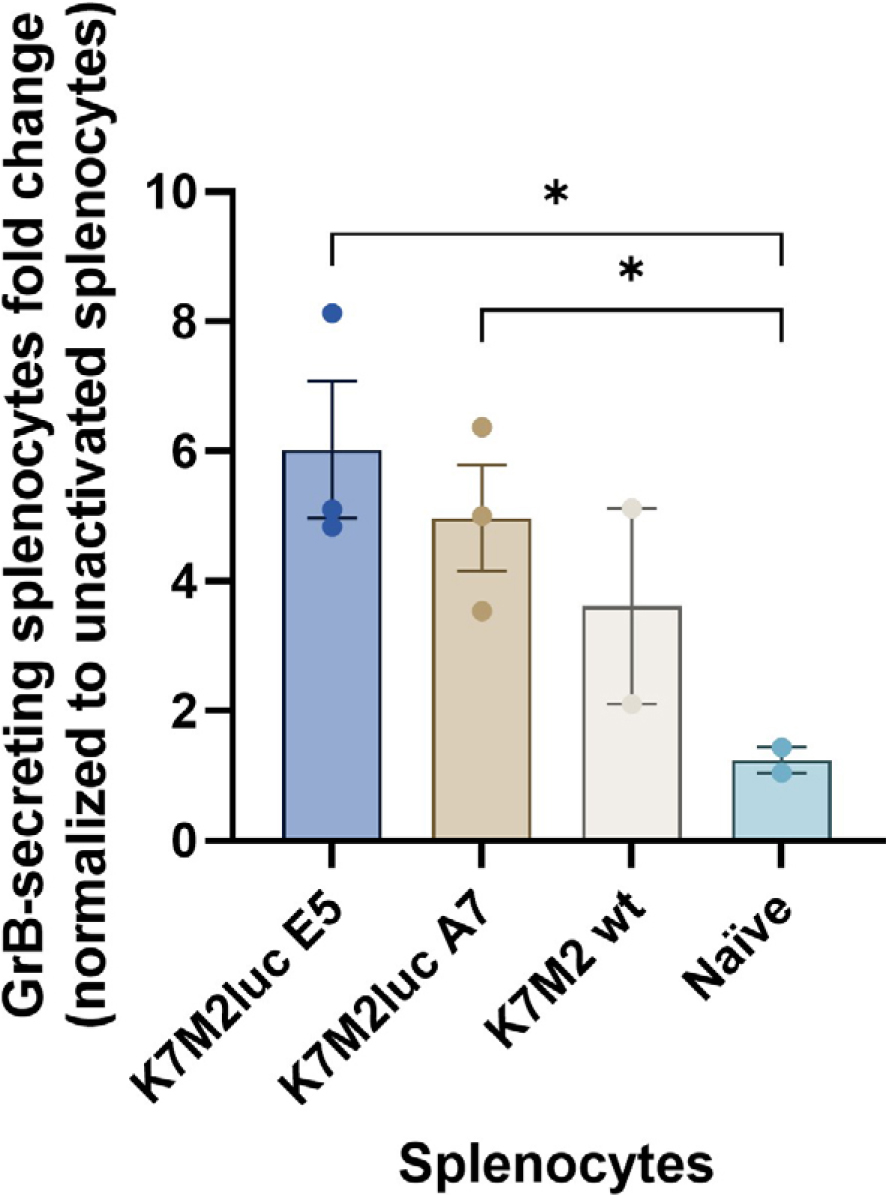
FIGURE 4.
GrB positive splenocytes from inoculated mice with unsuccessful tumor growth. Splenocytes underwent secondary activation with luciferin peptide. n = 2–3.
Values are presented as Arithmetic Mean (AM) ± Standard Error of the Mean (SEM).
* p < 0.05. Where not indicated with *, differences are not significant. Welch’s t test.
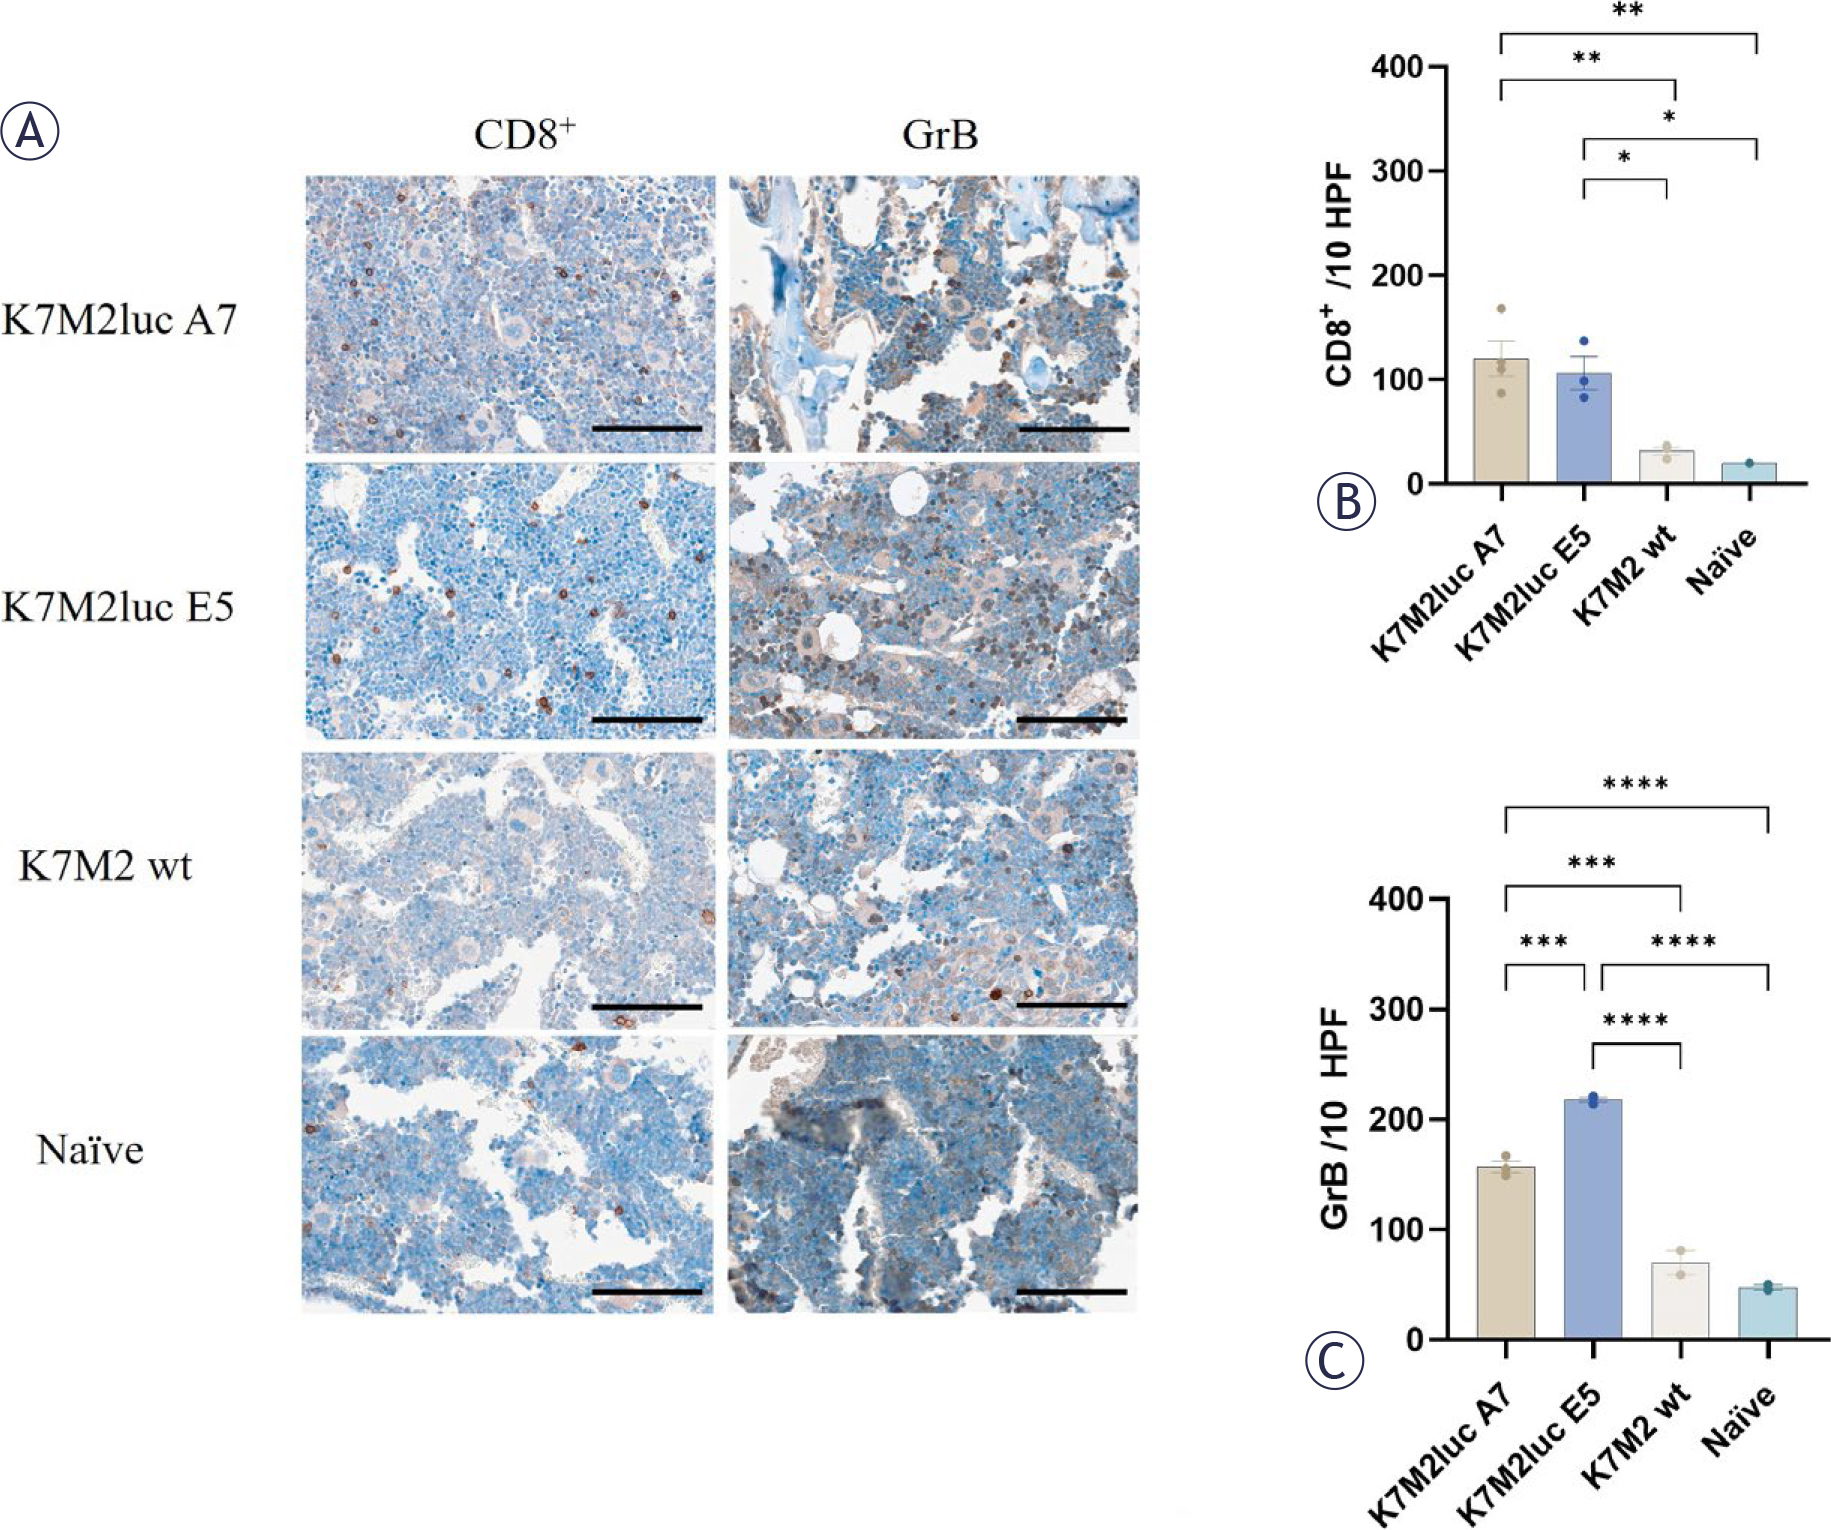
FIGURE 5.
(A) Representative images of tibial paraffin sections collected after the bioluminescence signal dropped below the detection threshold and stained with anti-CD8 and anti-GrB antibodies. 40x magnification, scale bar = 100 μm. (B) CD8+ positive cells/10 high-perfusion fields (HPF). (C) GrB positive cells/10 (HPF). n = 2–3.
Values are presented as Arithmetic Mean (AM) ± Standard Error of the Mean (SEM).
* p < 0.05. Where not indicated with *, differences are not significant. One-way ANOVA.
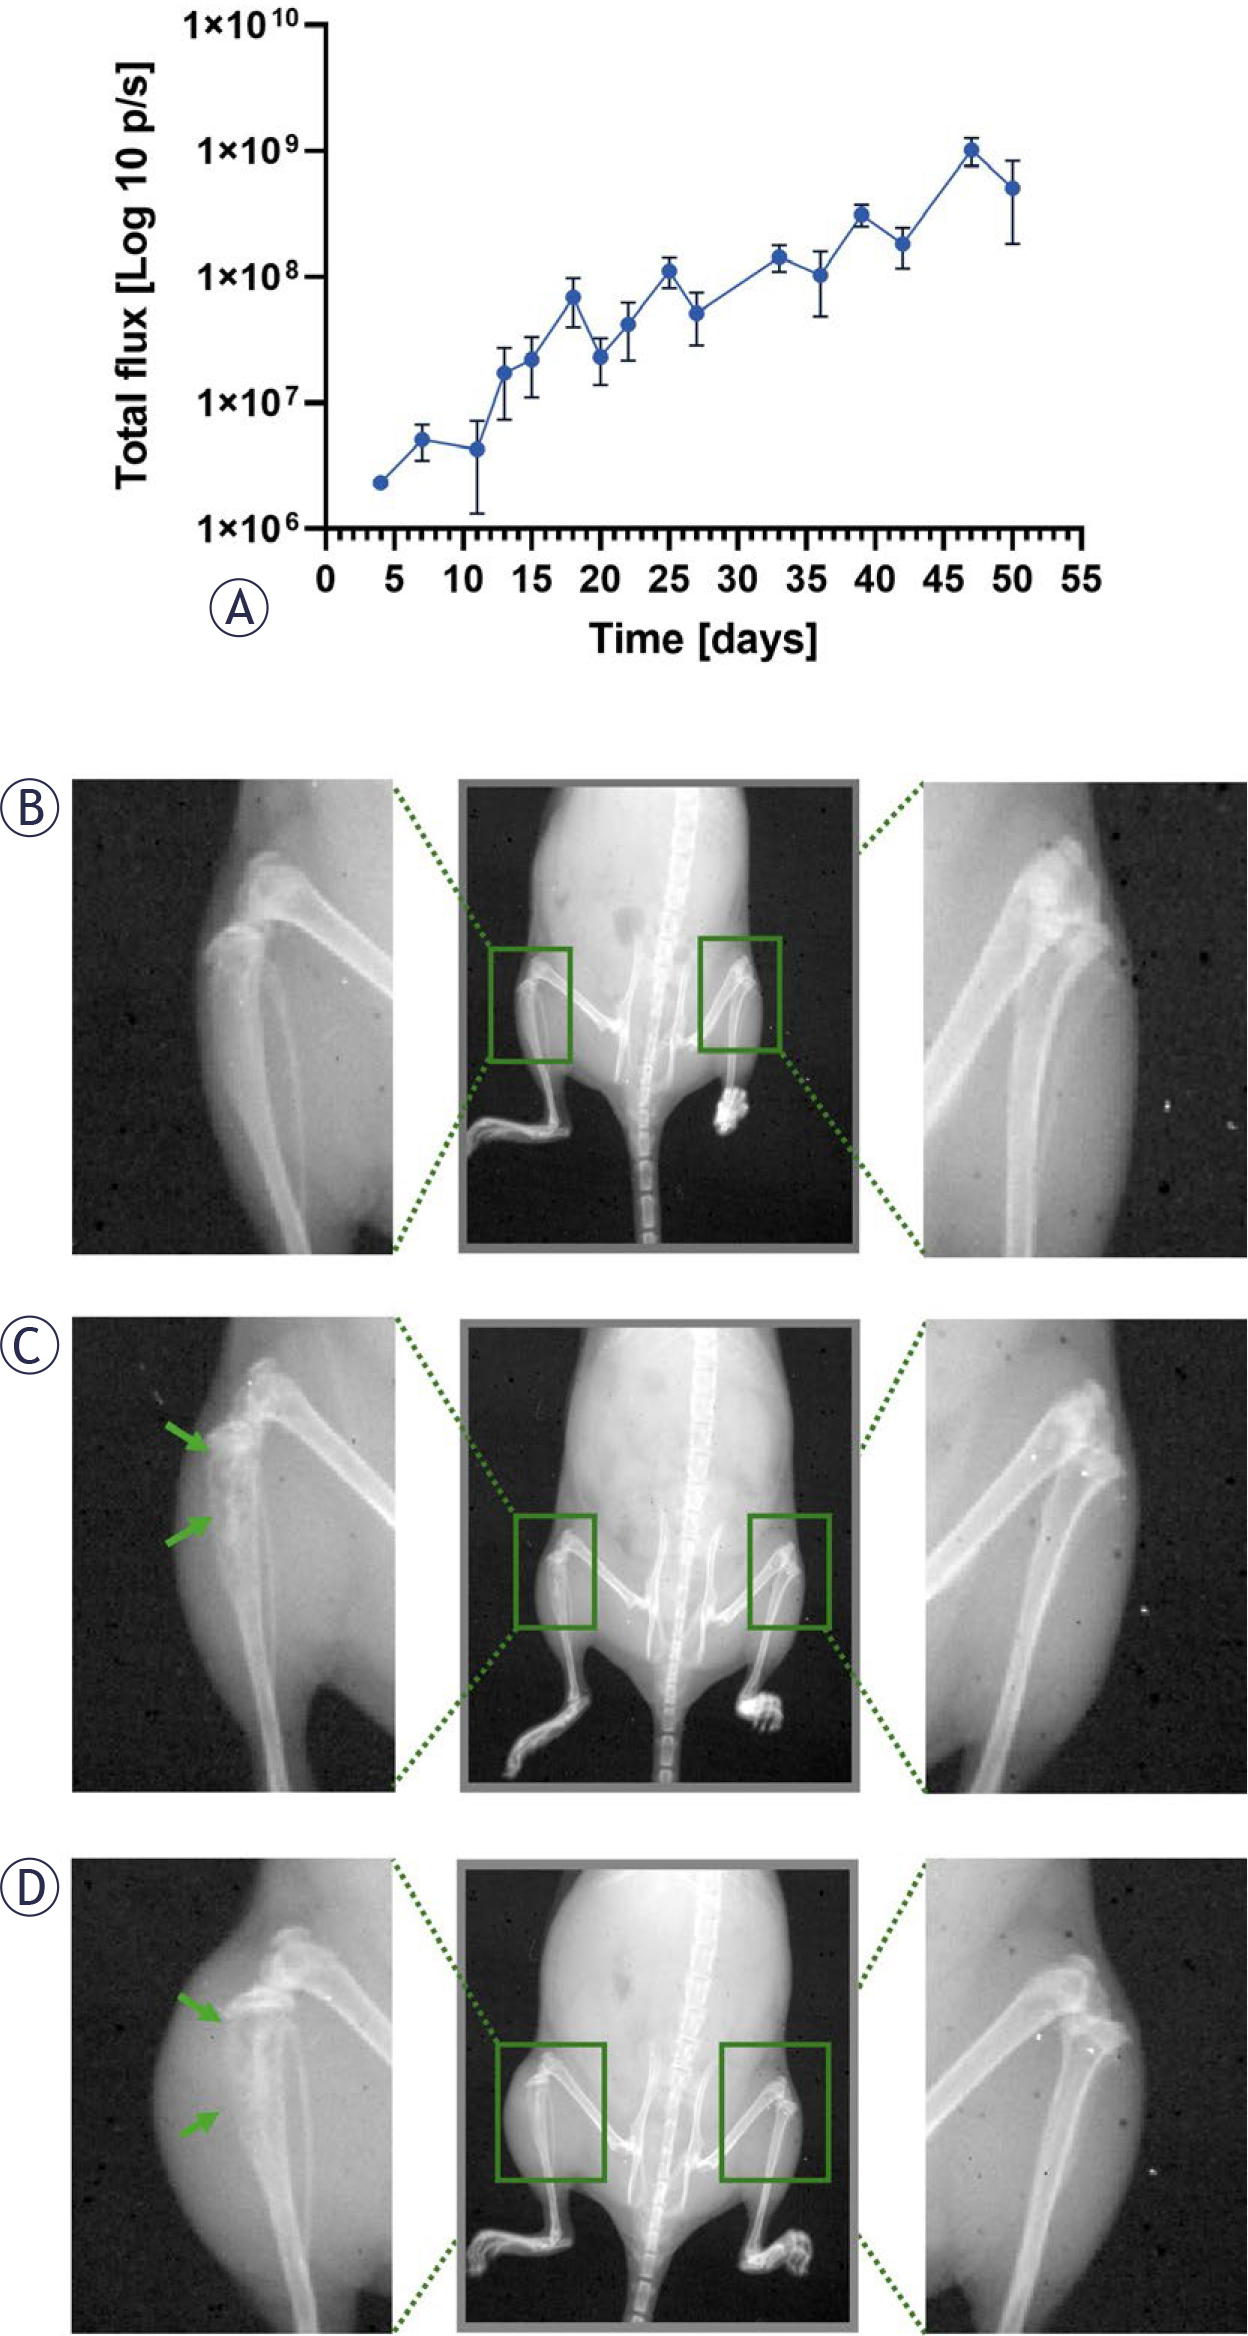
FIGURE 6.
(A) Bioluminescent signal growth in NUDE mice, inoculated with K7M2luc A7 cells. (B-D) X-ray images of NUDE mice, inoculated with K7M2luc A7 cells on day 8, 25, 50. n = 4.
Arrows mark bone lysis. Values are presented as Arithmetic Mean (AM) ± Standard Error of the Mean (SEM).
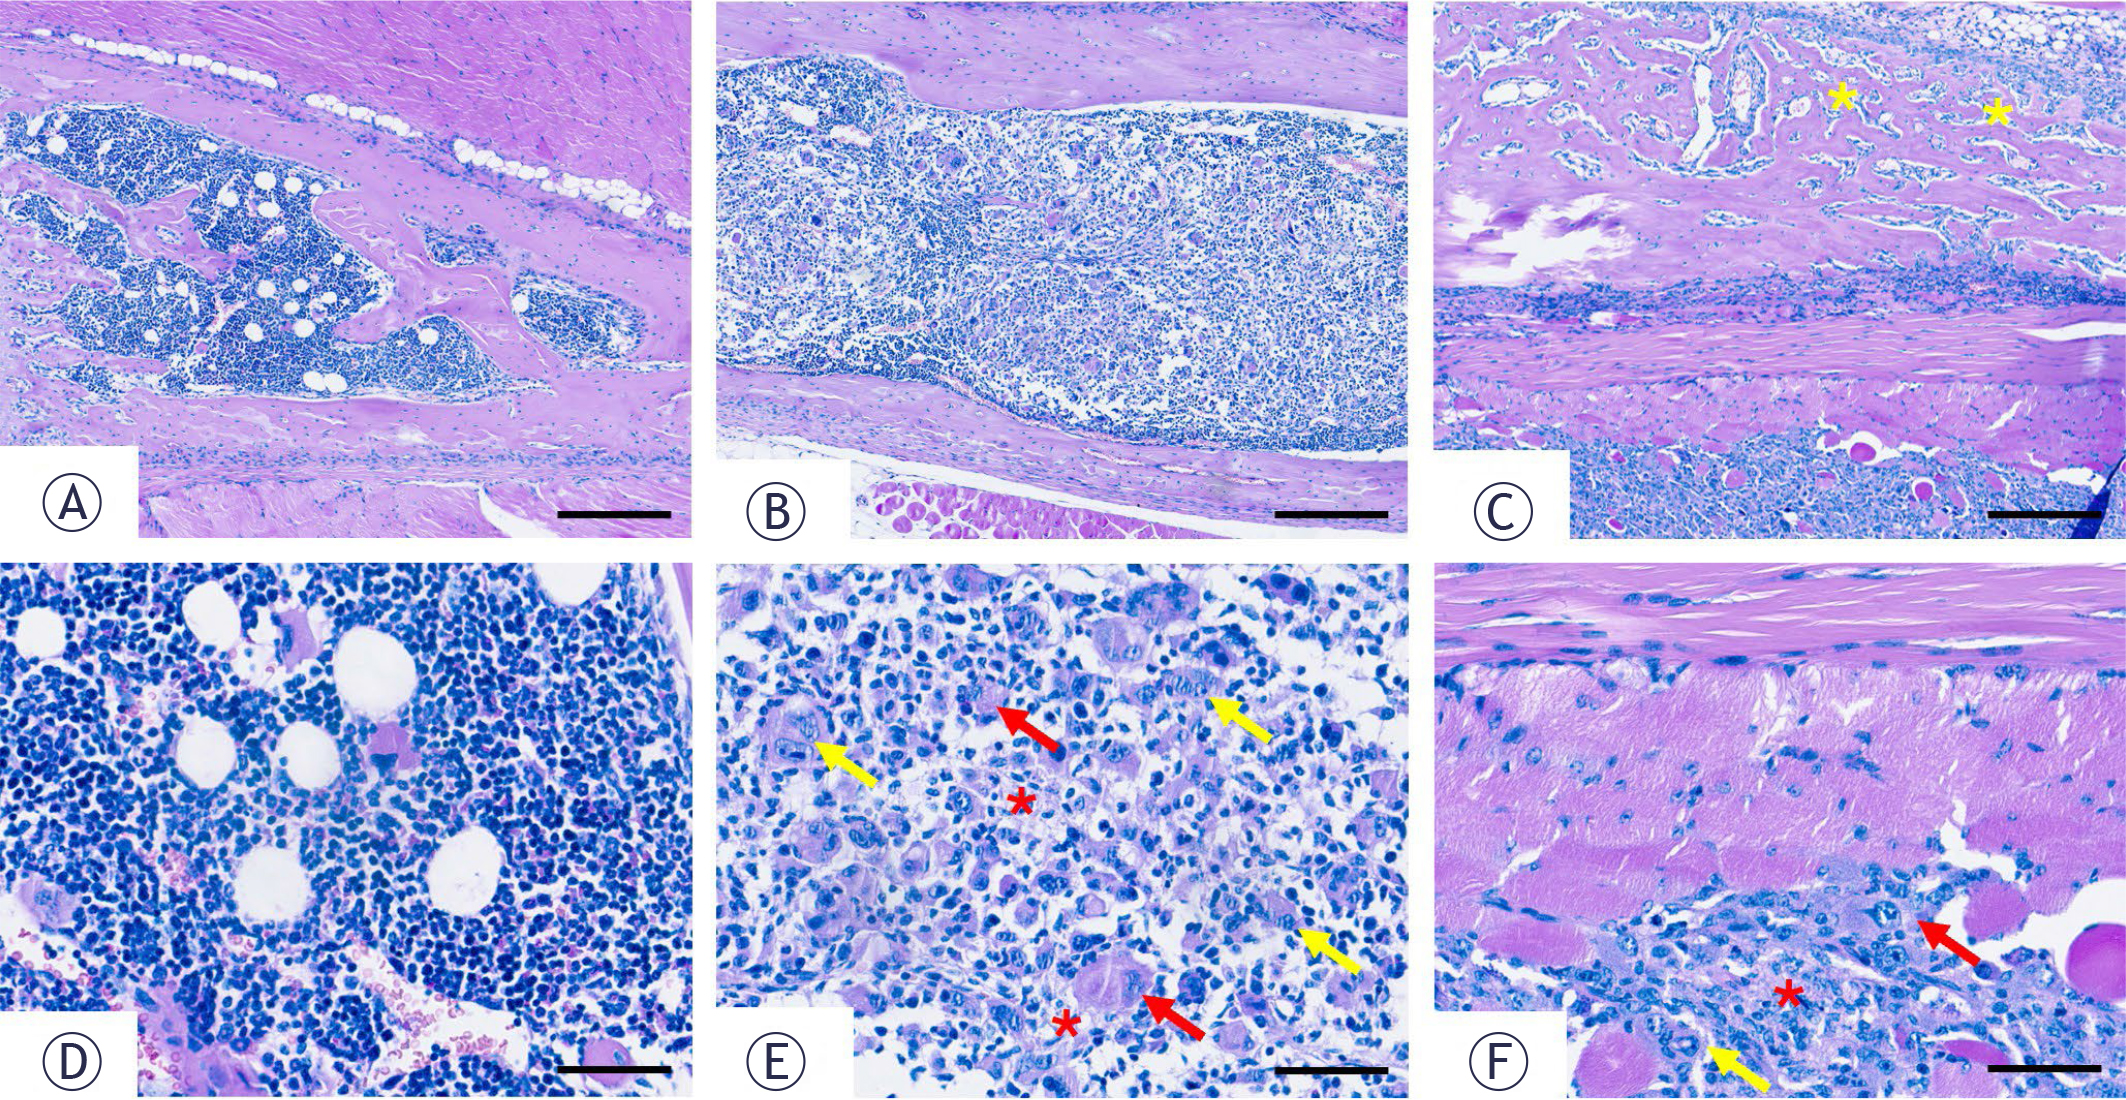
FIGURE 7.
Representative images of paraffin tibia samples; (A, D) healthy, (B, E) established and (C, F) progressive tumor with soft tissue invasion. Yellow arrows mark tumor cells with enlarged or multiple nuclei, red arrows mark changed nucleus:cytoplasm ratio in tumor cells, red asterisks mark lace-like malignant osteoid matrix and yellow asterisks mark bone lysis. (A, D) 5x magnification, scale bar = 100 μm. (B, C, E, F) 40x magnification, scale bar = 60 μm.