
TABLE 1.
Baseline demographic, clinical, and tumor characteristics of patients stratified by 18F-FDG PET/CT group classification
| Parameter | G1 | G2 | G3 | P |
|---|---|---|---|---|
| N | 10 | 34 | 33 | - |
| Age Med (range) | 61.5 (46-76) | 63.5 (35-78) | 63.0 (32-73) | 0.765 |
| Sex Male/female | 8/2 | 29/5 | 27/6 | 0.894 |
| Histopathology type EAC/ESCC | 9/1 | 12/22 | 19/14 | 0.007 |
| CEA Normal/elevated | 8/2 | 11/23 | 8/25 | 0.005 |
| CA19-9 Normal/elevated | 5/5 | 12/22 | 8/25 | 0.280 |
| Therapy Th1/Th2/Th3 | 6/2/2 | 10/17/7 | 4/16/13 | 0.030*F |
1 18F-FDG PET/CT = 18F-fluorodeoxyglucose positron emission tomography/computed tomography; CA19-9 = Carbohydrate antigen 19-9; CEA = carcinoembryonic antigen; EAC = esophageal adenocarcinoma; ESCC = esophageal squamous cell carcinoma;
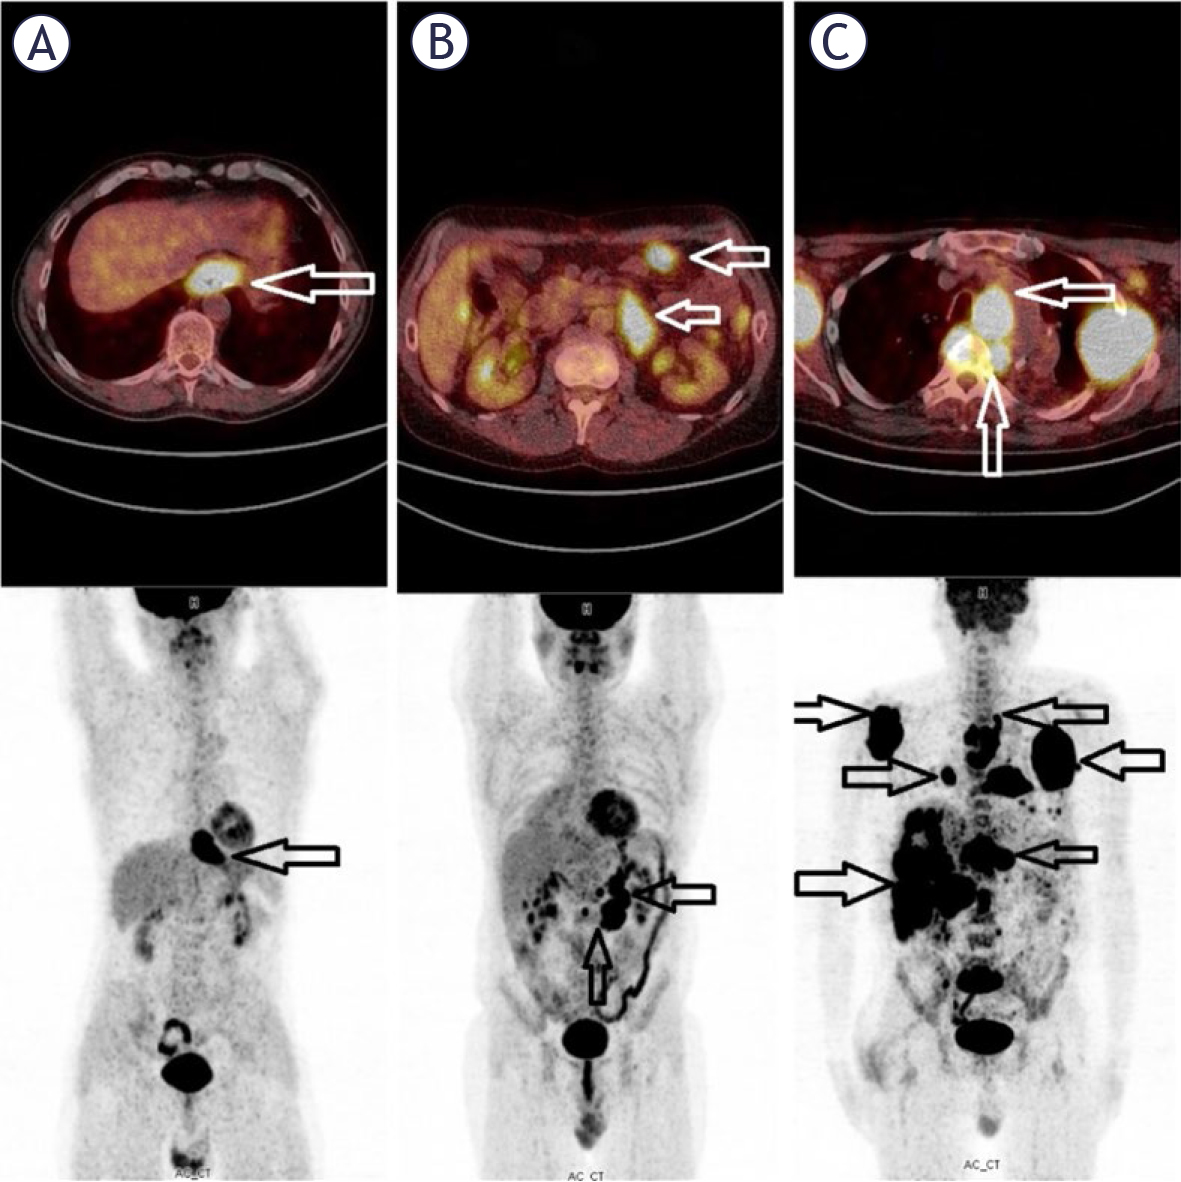
FIGURE 1.
Representative imaging examples of patients from each study group (G1–G3). (A) Patient from the G1 group on 18F-FDG PET/CT demonstrating isolated locoregional esophageal recurrence. The white arrow indicates the locoregional lesion on the fused 18F-FDG PET/CT image, while the black arrow indicates the locoregional lesion on the MIP image. (B) Patient from the G2 group on 18F-FDG PET/CT demonstrating metastatic sites of esophageal recurrence without locoregional recurrence. The white arrows indicate metastatic lesions on the fused 18F-FDG PET/CT image, while the black arrows indicate metastatic lesions on the MIP image. (C) Patient from the G3 group on 18F-FDG PET/CT demonstrating metastatic sites of esophageal recurrence with locoregional recurrence. The white arrows indicate lesions on the fused 18F-FDG PET/CT images, while the black arrows indicate metastatic lesions on the MIP image.
TABLE 2.
Semiquantitative and quantitative 18F-FDG PET/CT parameters according to group classification
| Parameter | G1 | G2 | G3 | P |
|---|---|---|---|---|
| SUVmax | 5.9 (4.2-33.7) | 7.8 (1.9-29.3) | 12.7 (3.6-30.5) | 0.001 |
| SUVpeak | 4.3 (3.1-30.1) | 6.1 (1.3-24.7) | 9.9 (3.3-23.2) | 0.001 |
| SUVmean | 3.1 (2.2-21.5) | 3.9 (1.6-14.9) | 6.7 (2.3-20.3) | <0.001 |
| MTV | 8.4 (0.9-313.3) | 13.2 (0.5-121.0) | 24.4 (3.8-292.5) | 0.007 |
| TLG | 9.7 (3.3-74.4) | 19.5 (0.7-1768.5) | 30.1 (2.9-790.5) | 0.042 |
1 18F-FDG PET/CT = 18F-fluorodeoxyglucose positron emission tomography/computed tomography; G1 = isolated locoregional disease; G2 = metastases without locoregional recurrence; G3 = locoregional disease and metastases; MTV = metabolic tumor volume; SUV = standardized uptake value; TLG = total lesion glycolysis.
1 Continuous variables are expressed as median (range). Differences between groups were assessed using the Kruskal-Wallis test. Post-hoc pairwise comparisons using the Mann–Whitney U test with Holm correction showed significant differences for SUVmax between G2 and G3 (p = 0.002), for SUVpeak between G2 and G3 (p = 0.002), for SUVmean between G1 and G3 (p = 0.008) and between G2 and G3 (p < 0.001), and for MTV between G2 and G3 (p = 0.007). Although TLG differed significantly in the Kruskal–Wallis test, post-hoc pairwise comparisons did not reach statistical significance.
TABLE 3.
18F-FDG PET/CT metabolic parameters by histopathology and treatment groups
| Parameter | EAC med (range) | ESCC med (range) | P | Th1 med (range) | Th2 med (range) | Th3 med (range) | P |
|---|---|---|---|---|---|---|---|
| N | 40 | 37 | - | 20 | 35 | 22 | - |
| SUVmax | 10.2 (1.9-33.7) | 9.9 (3.6-29.3) | 1.000 | 11.2 (4.2-33.7) | 7.6 (1.9-23.7) | 11.9 (4.2-30.5) | 0.124 |
| SUVpeak | 8.3 (1.3-30.1) | 8.2 (2.4-24.7) | 0.943 | 8.7 (3.1-30.1) | 6.4 (1.3-20.1) | 9.4 (3.6-23.2) | 0.089 |
| SUVmean | 5.3 (1.6-21.5) | 5.4 (1.9-14.9) | 0.874 | 5.9 (1.9-21.5) | 4.2 (1.6-14.5) | 6.5 (2.8-20.3) | 0.889 |
| MTV | 16.8 (0.5-313.3) | 15.5 (1.5-118.8) | 0.984 | 16.7 (0.9-118.3) | 14.2 (0.5-121.0) | 21.8 (1.5-313.3) | 0.417 |
| TLG | 26.1 (0.7-1768.5) | 25. 9(5.1-900.1) | 0.915 | 28.7 (3.3-900.1) | 21.7 (0.7-1768.5) | 25.4 (2.9-70.5) | 0.853 |
1 18F-FDG PET/CT = 18F-fluorodeoxyglucose positron emission tomography/computed tomography; EAC = esophageal adenocarcinoma; ESCC = esophageal squamous cell carcinoma; MTV = metabolic tumor volume; SUV = standardized uptake value; TLG = total lesion glycolysis; Th1 = therapeutic group 1 (surgical resection only); Th2 = therapeutic group 2 (surgical resection plus chemotherapy and/or radiotherapy); Th3 = therapeutic group 3 (chemotherapy and/or radiotherapy without prior surgical resection).
TABLE 4.
Distribution of metastatic sites in G2 and G3 groups
| Site of metastasis | G2 (n=34) | G3 (n=33) |
|---|---|---|
| Supradiaphragmatic lymph node | 11 | 10 |
| Lungs/pleura | 8 | 3 |
| Abdominal solid organs | 6 | 6 |
| Infradiaphragmatic lymph nodes | 3 | 6 |
| Bones | 5 | 5 |
| Small intenstine/large intestine | 1 | 2 |
| Peritoneum | - | 1 |
TABLE 5.
Clinical outcomes according to 18F-FDG PET/CT groups
| Outcome | G1 | G2 | G3 | P |
|---|---|---|---|---|
| N | 10 | 32 | 30 | - |
| Progression Yes/No | 3/7 | 27/5 | 25/5 | 0.001 |
| Mortality Yes/No | 3/7 | 20/12 | 20/10 | 0.112 |
| PFS median (range) | 18.0 (7-105) | 11.0 (6-125) | 10.0 (6-116) | 0.190 |
| OS median (range) | 21.0 (10-105) | 18.5 (6-132) | 15.5 (6-126) | 0.707 |
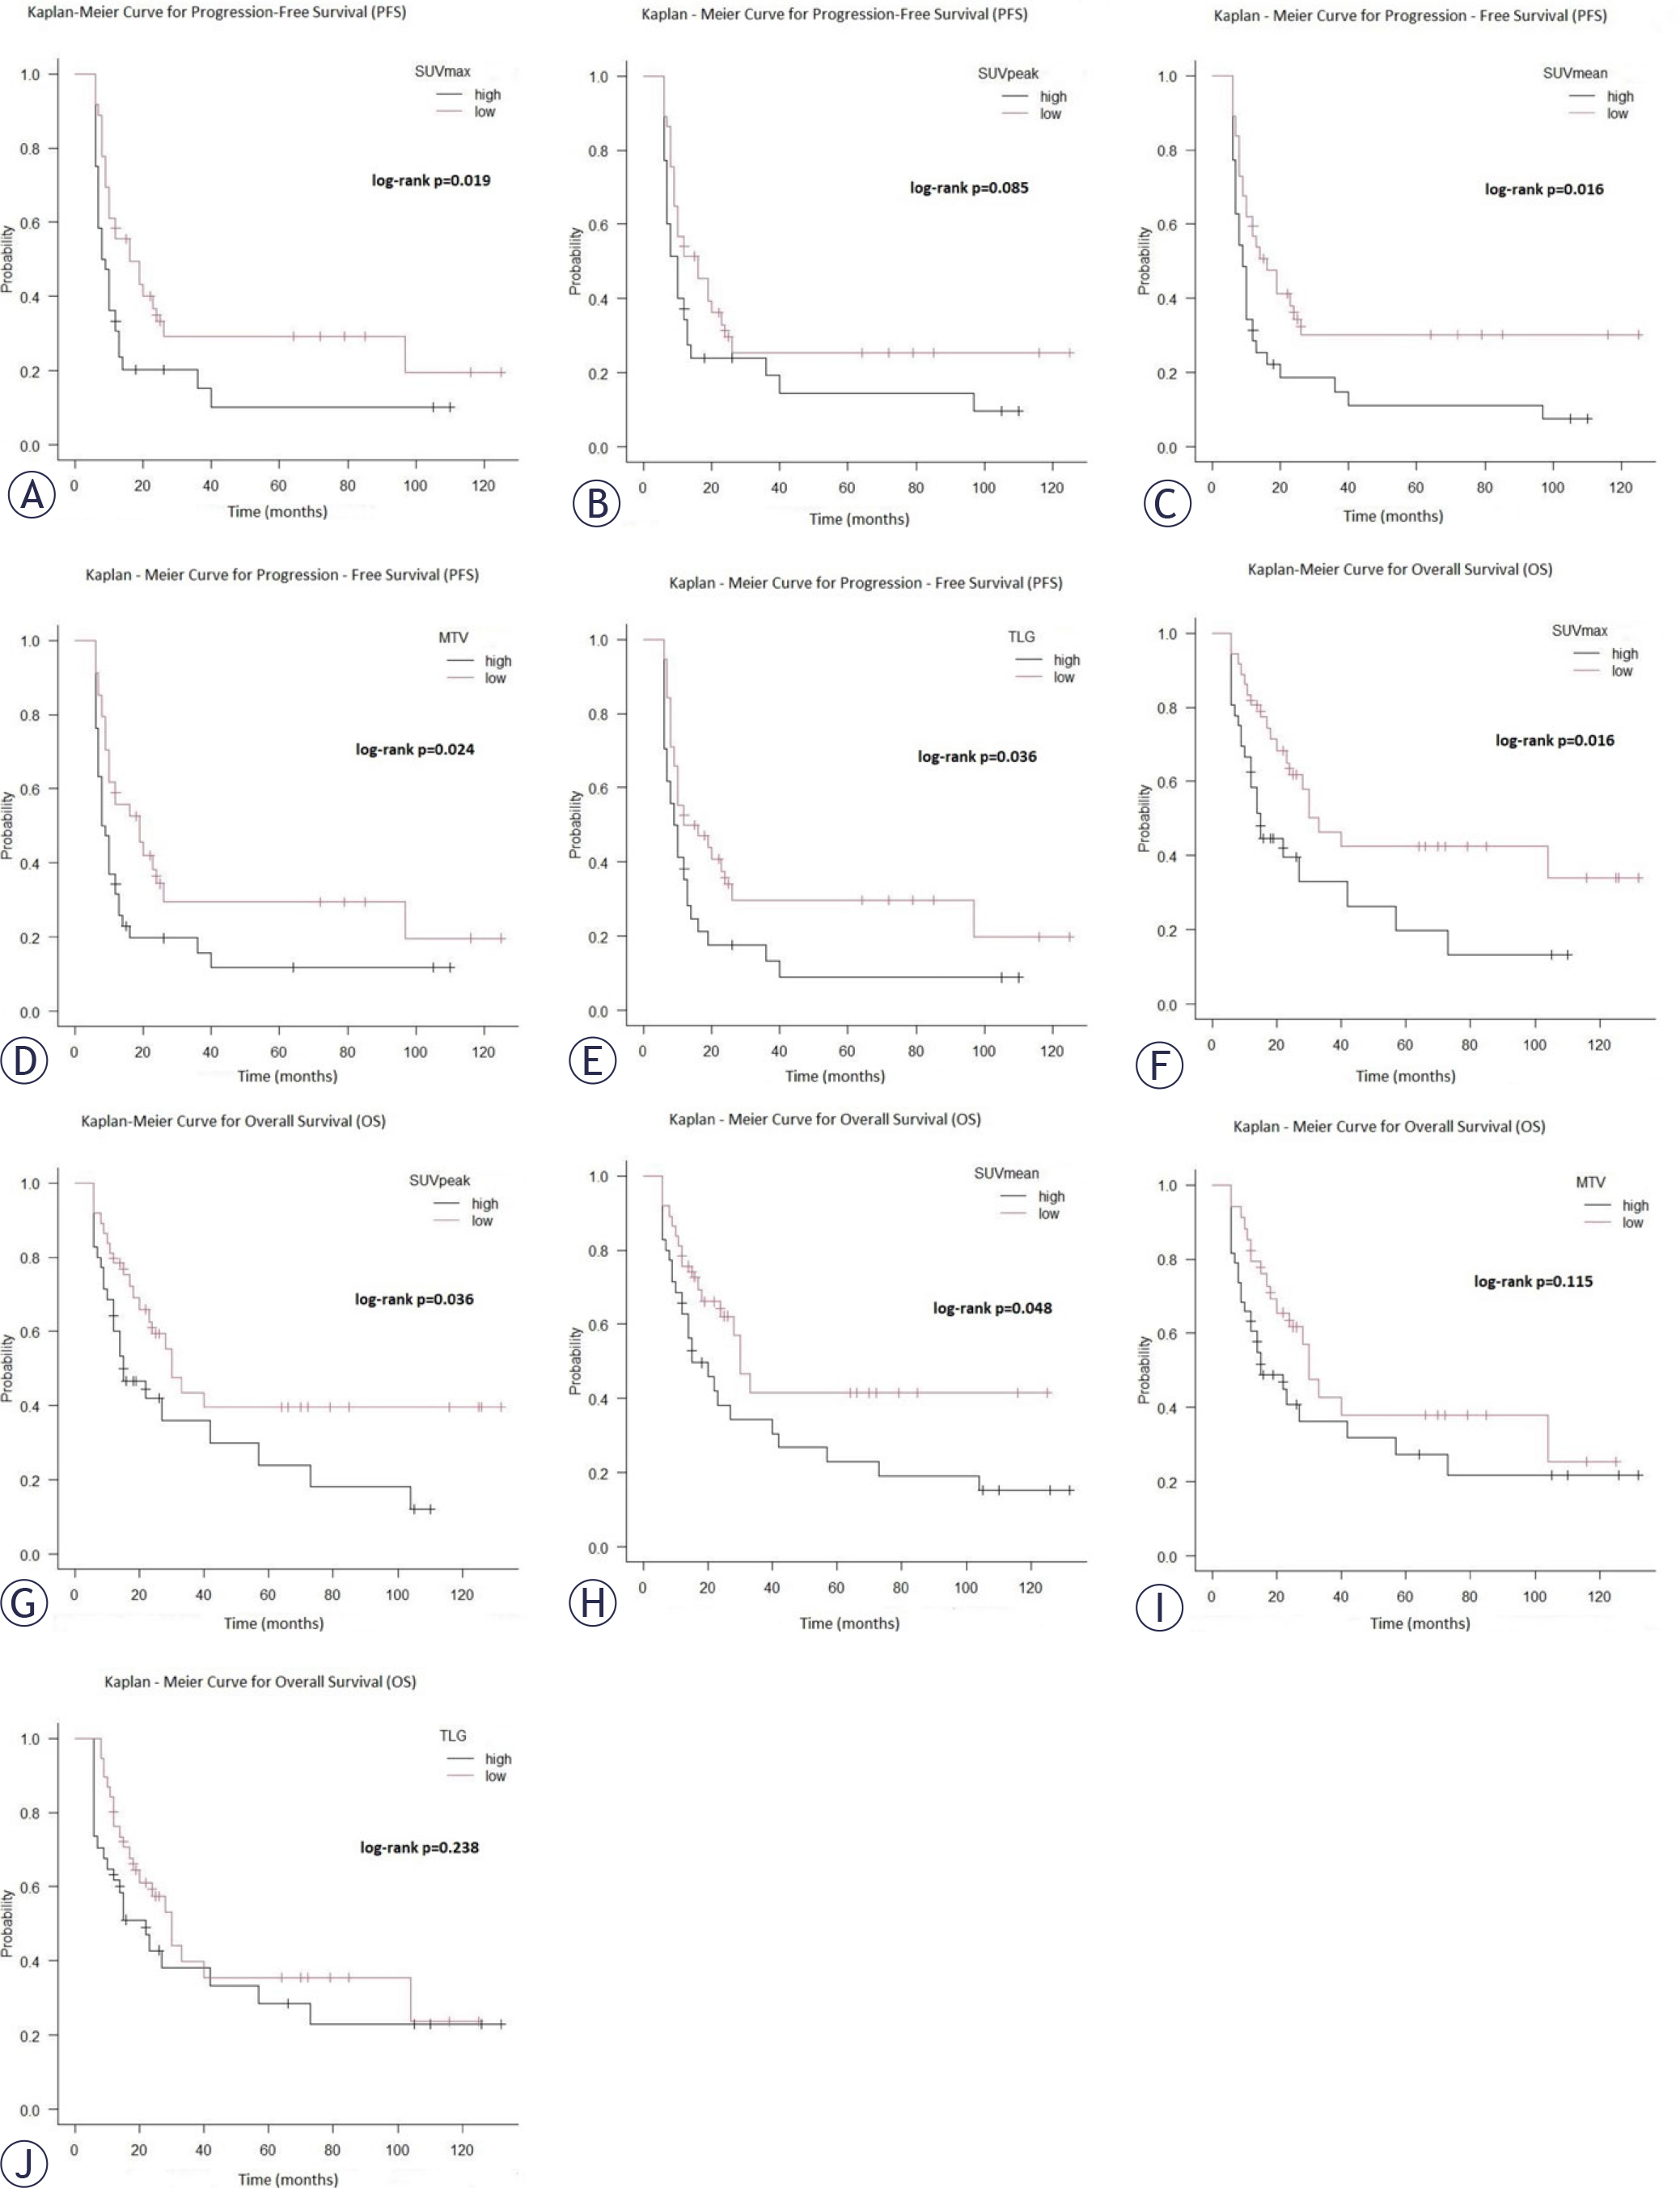
FIGURE 2.
Kaplan–Meier survival curves showing progression-free survival (A-E) and overall survival (F-J) according to the median values of SUVmax, SUVpeak, SUVmean, metabolic tumor volume (MTV), and total lesion glycolysis (TLG) (high vs. low). The median values used as cut-offs for stratification were: SUVmax = [9.9], SUVpeak = [8.2], SUVmean = [5.4], MTV = [16.5], and TLG = [25.9].
TABLE 6.
Median progression-free and overall survival times according to low and high 18F-FDG PET/CT parameters
| Parameter | Cut-off (median) | Median PFS Low vs. high (months) | Median OS Low vs. high (months) |
|---|---|---|---|
| SUVmax | 9.9 | 8.5 vs. 16.0 | 15.0 vs. 33.0 |
| SUVpeak | 8.2 | 10.0 vs. 16.0 | 15.0 vs. 30.0 |
| SUVmean | 5.4 | 9.0 vs. 16.0 | 15.0 vs. 30.0 |
| MTV | 16.5 | 8.5 vs. 19.0 | 15.0 vs. 30.0 |
| TLG | 25.9 | 9.5 vs. 14.0 | 22.0 vs. 30.0 |