
TABLE 1.
Clinicopathological characteristics of the study cohort (n = 11)
| Case No. | Gender | Age | Primary site | Mitotic count (per 50 HPFs) | Ki-67 Index | NIH risk category | CD117 / DOG1 | Maximum diameter (cm)* |
|---|---|---|---|---|---|---|---|---|
| 1 | Female | 72 | Stomach | 10 | 5% | Intermediate | +/+ | 2 |
| 2 | Female | 61 | Stomach | ≤ 2 | <5% | Intermediate | +/+ | 4 |
| 3 | Male | 39 | Stomach | 6 | 8% | Intermediate | +/+ | 3 |
| 4 | Female | 82 | Stomach | < 5 | 5% | Intermediate | +/+ | 7 |
| 5 | Male | 51 | Stomach | < 5 | 5% | Intermediate | +/+ | 3 |
| 6 | Female | 81 | Stomach | > 20 | 15% | High | +/+ | 5 |
| 7 | Female | 68 | Stomach | > 10 | 20% | High | +/+ | 3 |
| 8 | Male | 37 | Stomach | > 20 | 10% | High | +/+ | 4.5 |
| 9 | Male | 61 | Stomach | > 20 | 20% | High | +/+ | 7 |
| 10 | Male | 67 | Rectum | > 10 | 15% | High | +/+ | 6.5 |
| 11 | Female | 57 | Stomach | 14 | 3% | High | +/- | 3.5 |
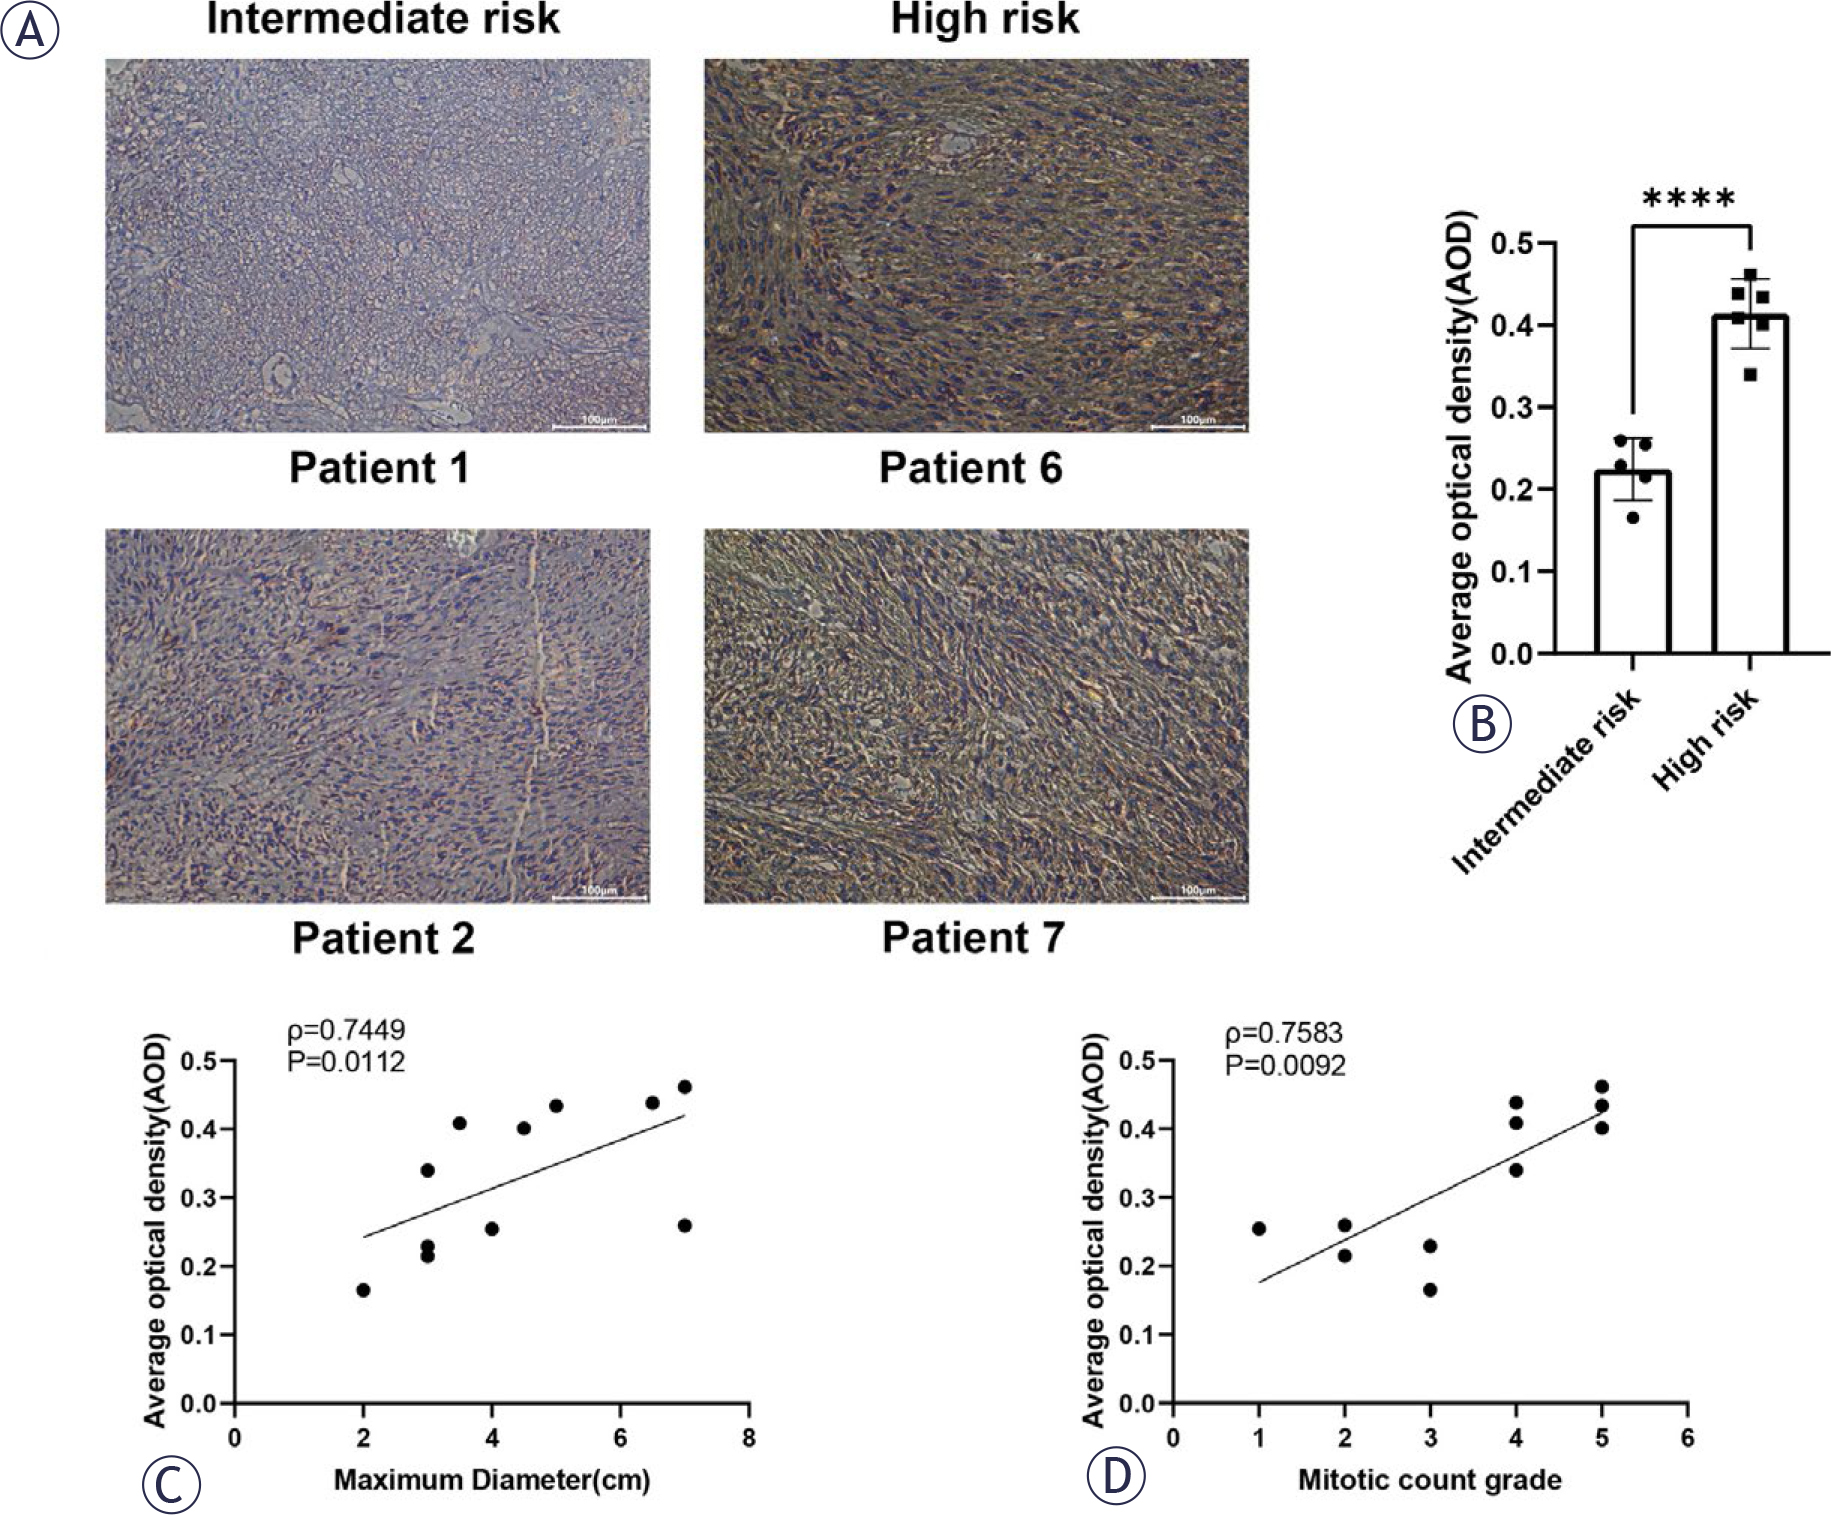
FIGURE 1.
EPHA3 expression is elevated in high-risk GIST specimens and correlates with clinicopathological features. (A) Representative immunohistochemical (IHC) images of EPHA3 staining in intermediate-risk and high-risk GIST specimens, Scale bar = 100 μm. Full EPHA3 IHC images for all 11 patients are shown in Supplementary Figure S1, and the case numbers correspond to those listed in Table 1. (B) Quantification of EPHA3 staining by average optical density (AOD) in intermediaterisk and high-risk GIST specimens. Each dot represents one patient. Data are presented as the mean ± SD. ****p < 0.0001. (C) Spearman correlation analysis between maximum tumor diameter and EPHA3 AOD values in 11 GIST patients (ρ = 0.7449, p = 0.0112). (D) Spearman correlation analysis between mitotic count grade and EPHA3 AOD values in 11 GIST patients (ρ = 0.7583, p = 0.0092).
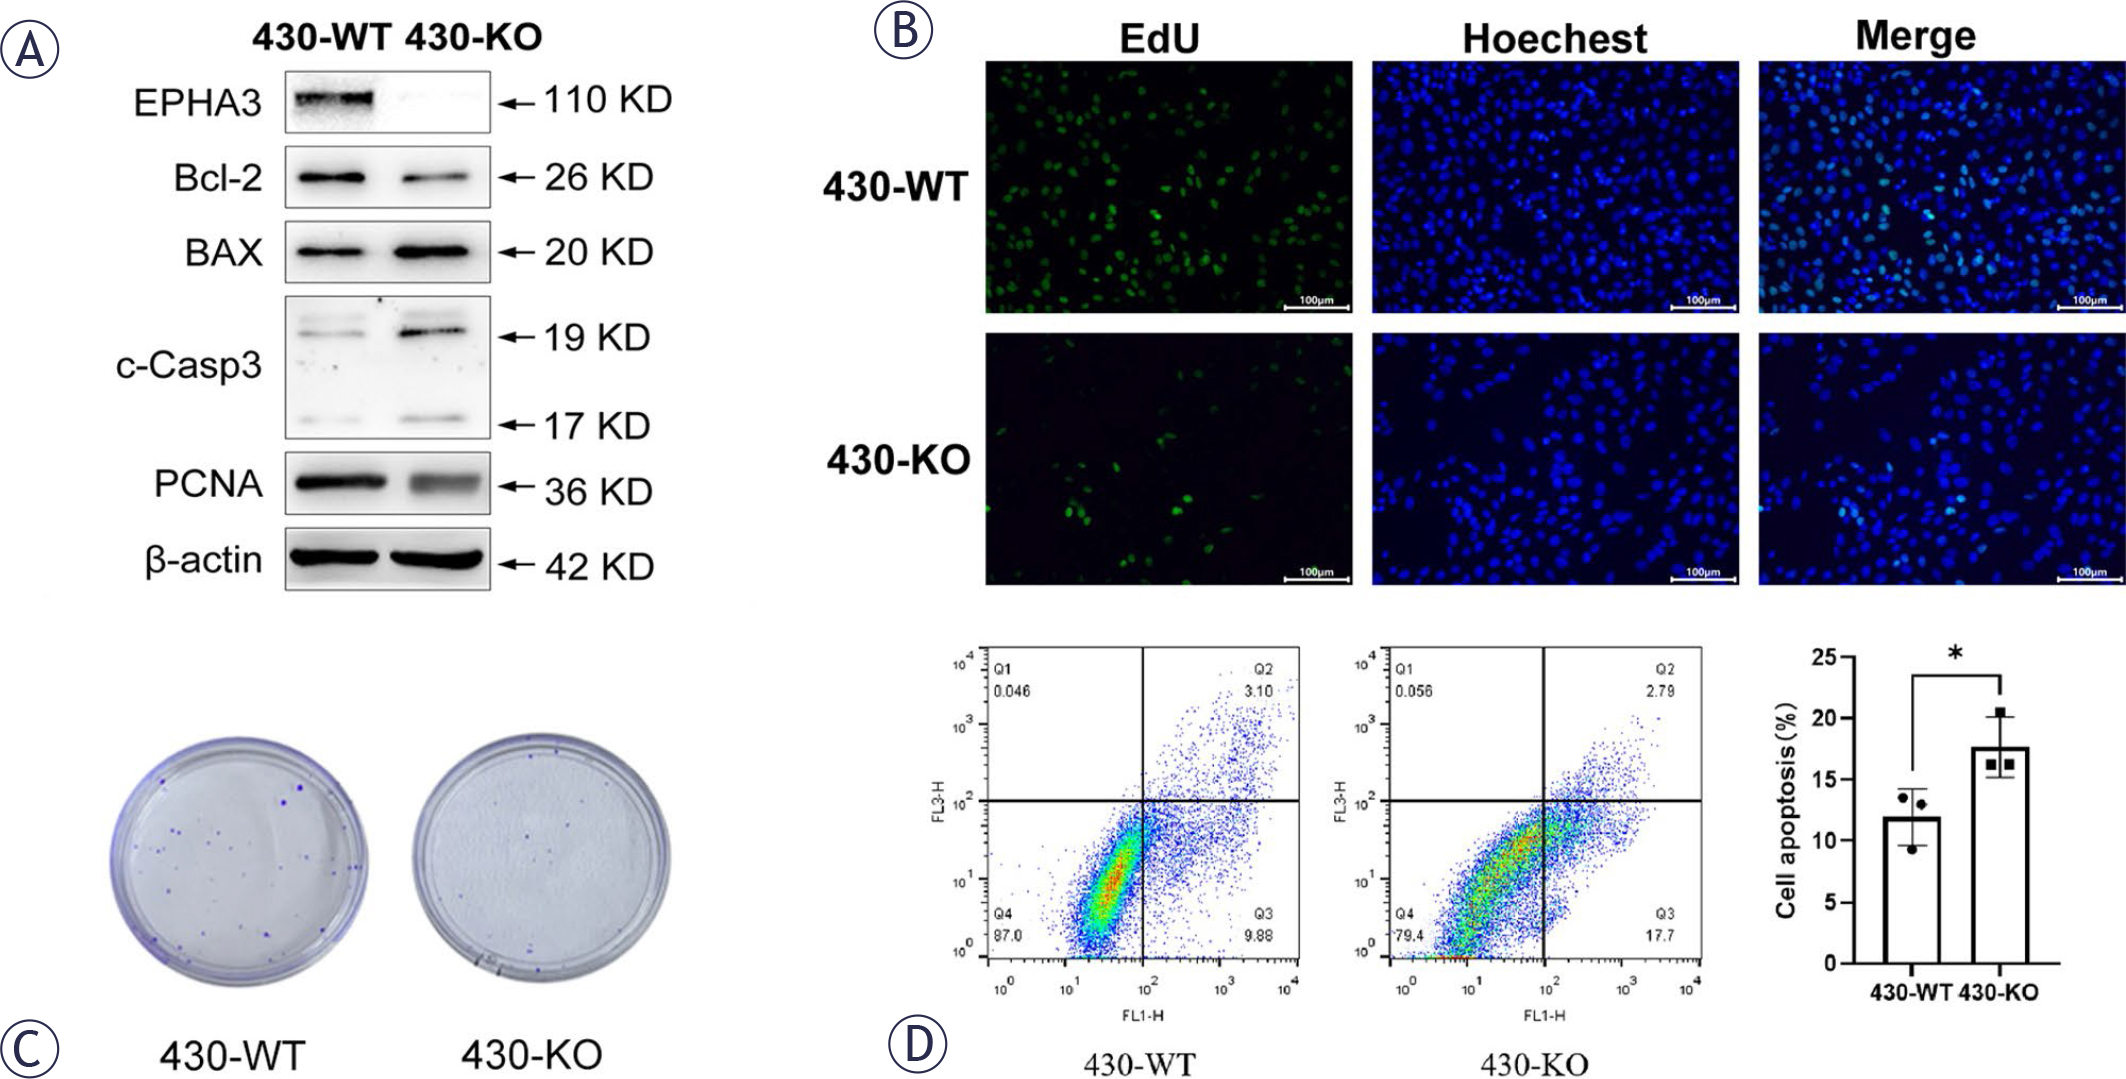
FIGURE 2.
EPHA3 promotes the proliferation and survival of GIST-430 cells. (A) Representative Western blot images showing showing the expression of EPHA3, Bcl-2, Bax, cleaved caspase-3, and PCNA in 430-WT and 430-KO cells, with β-actin as the loading control. (B) 5-ethynyl-2’-deoxyuridine, EdU) assay showing the proliferative capacity of 430-WT and 430-KO cells, Scale bar = 100 μm. (C) Colony formation assay of 430-WT and 430-KO cells. (D) Representative flow cytometry plots and quantification of apoptotic cells in 430-WT and 430-KO cells using Annexin V/PI staining. Data are presented as mean ± SD from three independent experiments. *p < 0.05, **p < 0.01, ***p < 0.001.
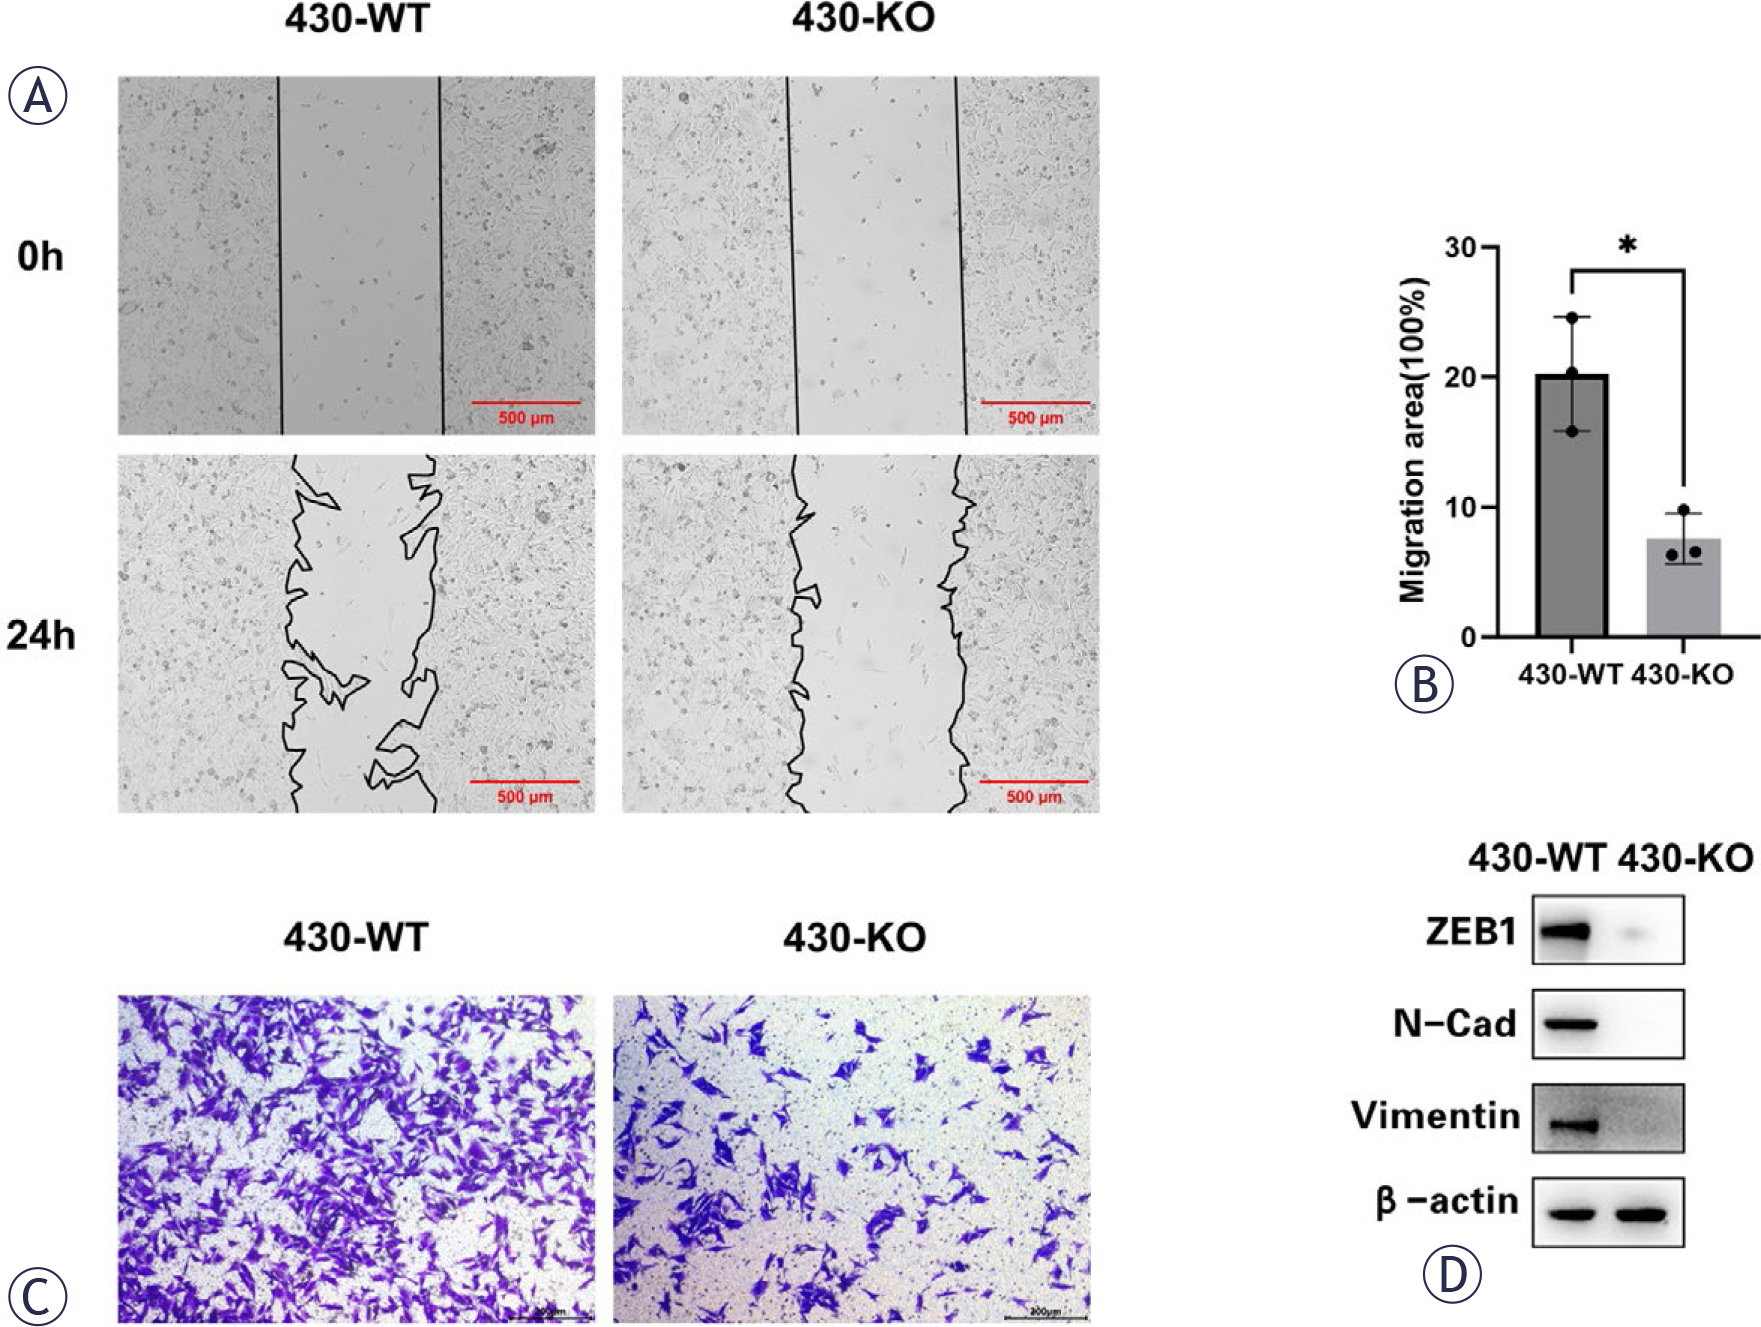
FIGURE 3.
EPHA3 promotes the migration of GIST-430 cells. (A) Representative images of the wound-healing assay in 430-WT and 430-KO cells at 0 and 24 h. Scale bar = 500 μm. (B) Quantification of wound closure in 430-WT and 430-KO cells after 24 h. (C) Transwell migration assay showing the migratory ability of 430-WT and 430-KO cells. Scale bar = 200 μm. (D) Representative Western blot images showing ZEB1, N-cadherin, and Vimentin expression in 430-WT and 430-KO cells, with β-actin as the loading control. Data are presented as mean ± SD from three independent experiments. *p < 0.05, **p < 0.01, ***p < 0.001.
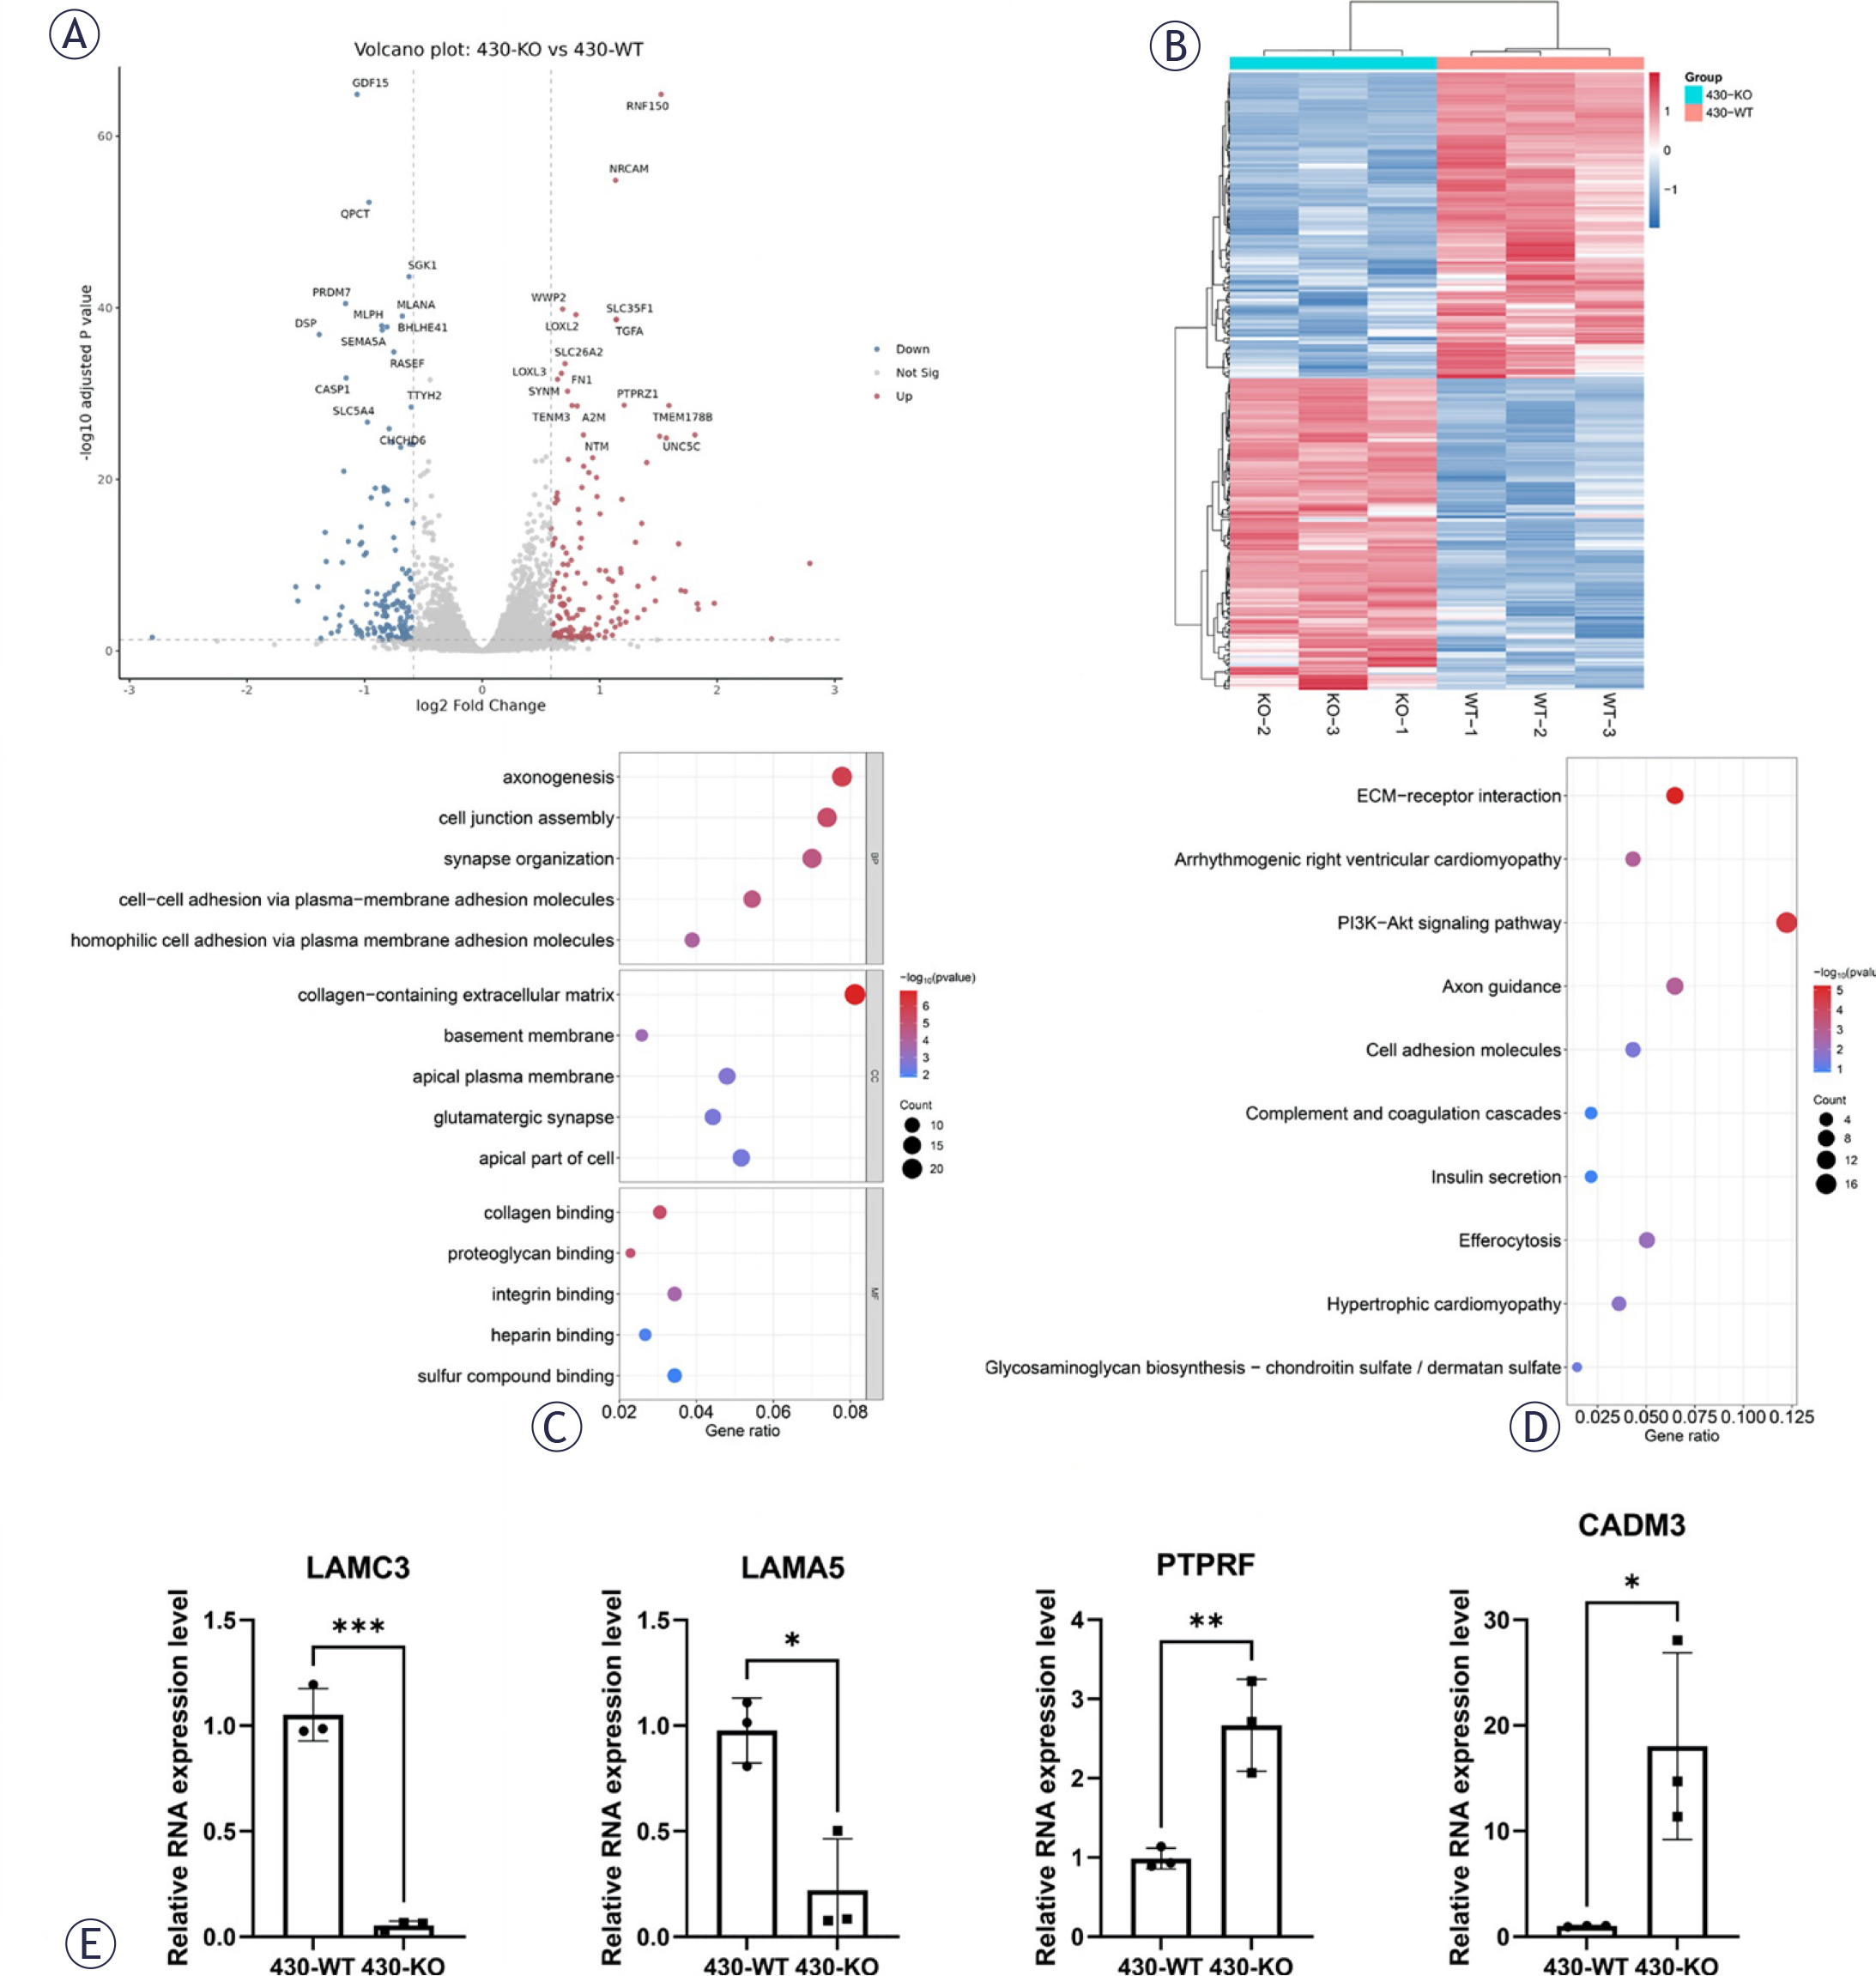
FIGURE 4.
RNA sequencing (RNA-seq) analysis of EPHA3-knockout GIST-430 cells. (A) Volcano plot showing differentially expressed genes (DEGs) in 430-KO cells relative to 430-WT cells. DEGs were defined using the criteria of an adjusted P value < 0.05 and |log2 fold change| > 0.585. Red dots indicate upregulated genes, blue dots indicate downregulated genes, and grey dots indicate genes without significant differential expression. (B) Hierarchical-clustering heatmap showing the expression patterns of DEGs in 430-WT and 430-KO cells. Rows represent genes, columns represent samples, and the colour scale indicates row-wise Z-score-normalized expression levels. (C) Gene Ontology (GO) enrichment analysis showing the top five enriched terms in each GO category, including biological process, cellular component, and molecular function. (D) Kyoto Encyclopaedia of Genes and Genomes (KEGG) pathway-enrichment analysis showing the top 10 enriched pathways. (E) RT-qPCR validation of the relative mRNA expression levels of LAMC3, LAMA5, PTPRF, and CADM3 in 430-WT and 430-KO cells. Data are presented as the mean ± SD from three independent experiments. *p < 0.05, **p < 0.01, ***p < 0.001.