
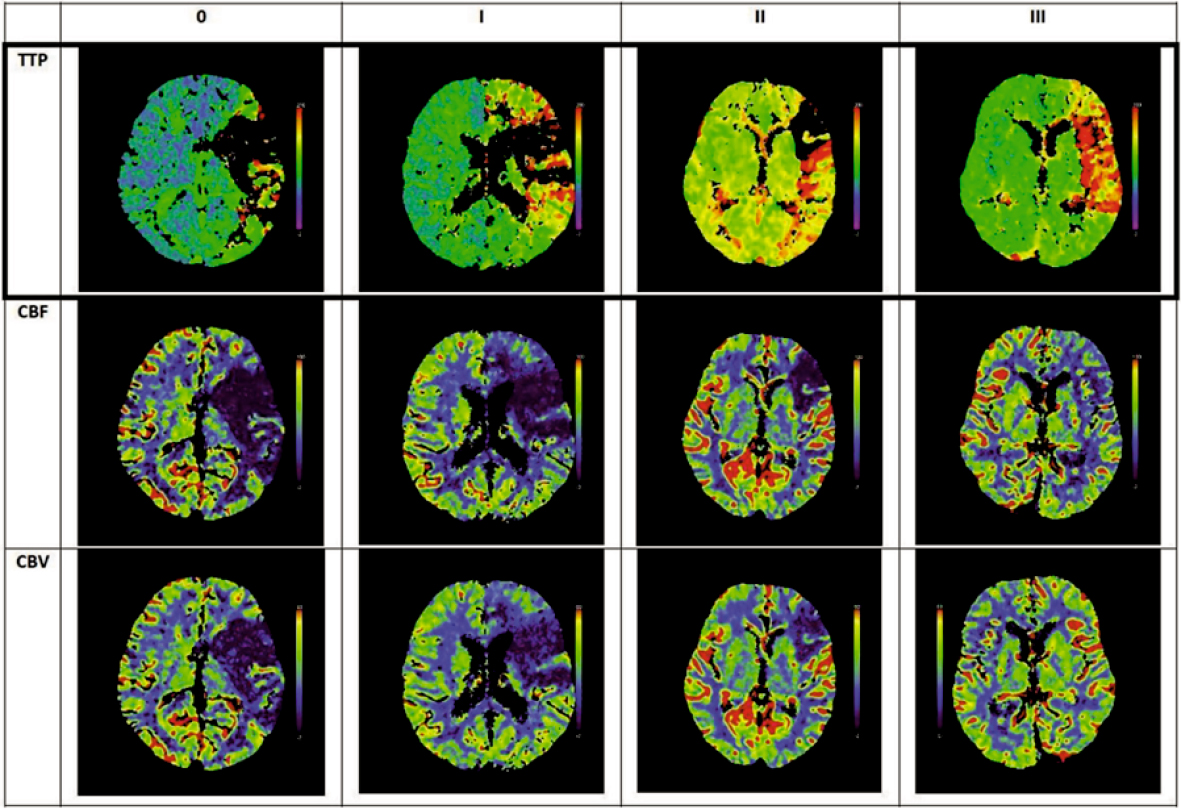
FIGURE 1.
Examples of time to peak (TTP) based CT perfusion (CTP) maps divided into four categories, according to the percentage of »black hole« estimation in the hypoperfused region, with their corresponding cerebral blood flow (CBF) and cerebral blood volume (CBV) perfusion images.
TABLE 1.
Distribution of patients according to visual CT perfusion (CTP) and outcome
| Visual CTP (penumbra category) | mRS ≤ 3 | mRS > 3 | Total |
|---|---|---|---|
| 0–25% penumbra | 14 | 27 | 41 |
| 25–50% penumbra | 26 | 27 | 53 |
| 50–75% penumbra | 84 | 60 | 144 |
| 75–100% penumbra | 215 | 86 | 301 |
| Total | 339 | 200 | 539 |
TABLE 2.
Distribution of patients according to automated CT perfusion (CTP) and outcome
| Automated CTP (penumbra category) | mRS ≤ 3 | mRS > 3 | Total |
|---|---|---|---|
| 0–25% penumbra | 2 | 7 | 9 |
| 25–50% penumbra | 14 | 18 | 32 |
| 50–75% penumbra | 71 | 65 | 136 |
| 75–100% penumbra | 239 | 112 | 351 |
| Total | 326 | 202 | 528 |
TABLE 3.
Distribution of patients between visual CT perfusion (CTP) and automated CTP
| Automated CTP category (rows)/Visual CTP category (columns) | 0–25% penumbra | 25–50% penumbra | 50–75% penumbra | 75–100% penumbra | Row total |
|---|---|---|---|---|---|
| 0–25% penumbra | 5 | 1 | 0 | 0 | 6 |
| 25–50% penumbra | 13 | 9 | 4 | 5 | 31 |
| 50–75% penumbra | 21 | 25 | 60 | 25 | 131 |
| 75–100% penumbra | 0 | 15 | 70 | 267 | 352 |
| Column total | 39 | 50 | 134 | 297 | 520 |
TABLE 4A.
Multivariable logistic regression including visual CT perfusion (CTP) (n = 539) for favourable outcome (mRS ≤ 3); baseline model (without CT angiography [CTA] collaterals)
| Predictor | OR (95% CI) | p-value |
|---|---|---|
| Age (per year) | 0.94 (0.92–0.96) | < 0.01 |
| ASPECTS (per point) | 1.29 (1.09–1.51) | < 0.01 |
| Time to groin puncture | 1.01 (0.92–1.11) | 0.82 |
| IV thrombolysis | 0.75 (0.49–1.15) | 0.18 |
| TICI < 2b | 0.31 (0.18–0.54) | < 0.01 |
| Visual CTP 0–25 % | 0.22 (0.10–0.47) | < 0.01 |
| Visual CTP 25–50 % | 0.30 (0.15–0.62) | < 0.01 |
| Visual CTP 50–75 % | 0.51 (0.31–0.83) | < 0.01 |
TABLE 4B.
Multivariable logistic regression including visual CT perfusion (CTP) (n = 539) for favourable outcome (mRS ≤ 3); extended model (with CT angiography [CTA] collaterals)
| Predictor | OR (95% CI) | p-value |
|---|---|---|
| Age (per year) | 0.94 (0.92–0.96) | < 0.01 |
| ASPECTS (per point) | 1.26 (1.07–1.49) | < 0.01 |
| Time to groin puncture | 1.01 (0.92–1.10) | 0.92 |
| IV thrombolysis | 0.71 (0.46–1.10) | 0.13 |
| TICI < 2b | 0.33 (0.19–0.57) | < 0.01 |
| Collaterals absent/minimal | 0.37 (0.07–2.10) | 0.26 |
| Collaterals reduced | 0.56 (0.34–0.92) | 0.02 |
| Visual CTP 0–25% | 0.39 (0.16–0.97) | 0.04 |
| Visual CTP 25–50% | 0.44 (0.20–0.96) | 0.04 |
| Visual CTP 50–75% | 0.64 (0.38–1.07) | 0.09 |
TABLE 5A.
Multivariable logistic regression including automated CT perfusion (CTP) (n = 528) for favourable outcome (mRS ≤ 3); baseline model (without CT angiography [CTA] collaterals)
| Predictor | OR (95% CI) | p-value |
|---|---|---|
| Age (per year) | 0.94 (0.92–0.96) | < 0.01 |
| ASPECTS (per point) | 1.29 (1.10–1.52) | < 0.01 |
| Time to groin puncture | 1.01 (0.92–1.10) | 0.90 |
| IV thrombolysis | 0.80 (0.52–1.22) | 0.29 |
| TICI < 2b | 0.28 (0.16–0.49) | < 0.01 |
| CTP 0–25% | 0.14 (0.02–0.78) | 0.03 |
| CTP 25–50% | 0.38 (0.16–0.93) | 0.04 |
| CTP 50–75% | 0.58 (0.36–0.94) | 0.03 |
TABLE 5B.
Multivariable logistic regression including automated syngo.via (SYV) CT perfusion (CTP) (n = 528) for favourable outcome (mRS ≤ 3); extended model (with CT angiography [CTA] collaterals)
| Predictor | OR (95% CI) | p-value |
|---|---|---|
| Age (per year) | 0.95 (0.93–0.97) | < 0.01 |
| ASPECTS (per point) | 1.26 (1.07–1.50) | < 0.01 |
| Time to groin puncture | 1.00 (0.92–1.10) | 0.98 |
| IV thrombolysis | 0.72 (0.47–1.13) | 0.15 |
| TICI < 2b | 0.28 (0.16–0.50) | < 0.01 |
| Collaterals absent/minimal | 0.22 (0.03–1.50) | 0.12 |
| Collaterals reduced | 0.39 (0.24–0.63) | < 0.01 |
| CTP 0–25% | 0.21 (0.02–2.07) | 0.18 |
| CTP 25–50% | 0.93 (0.33–2.57) | 0.88 |
| CTP 50–75% | 0.76 (0.46–1.27) | 0.30 |
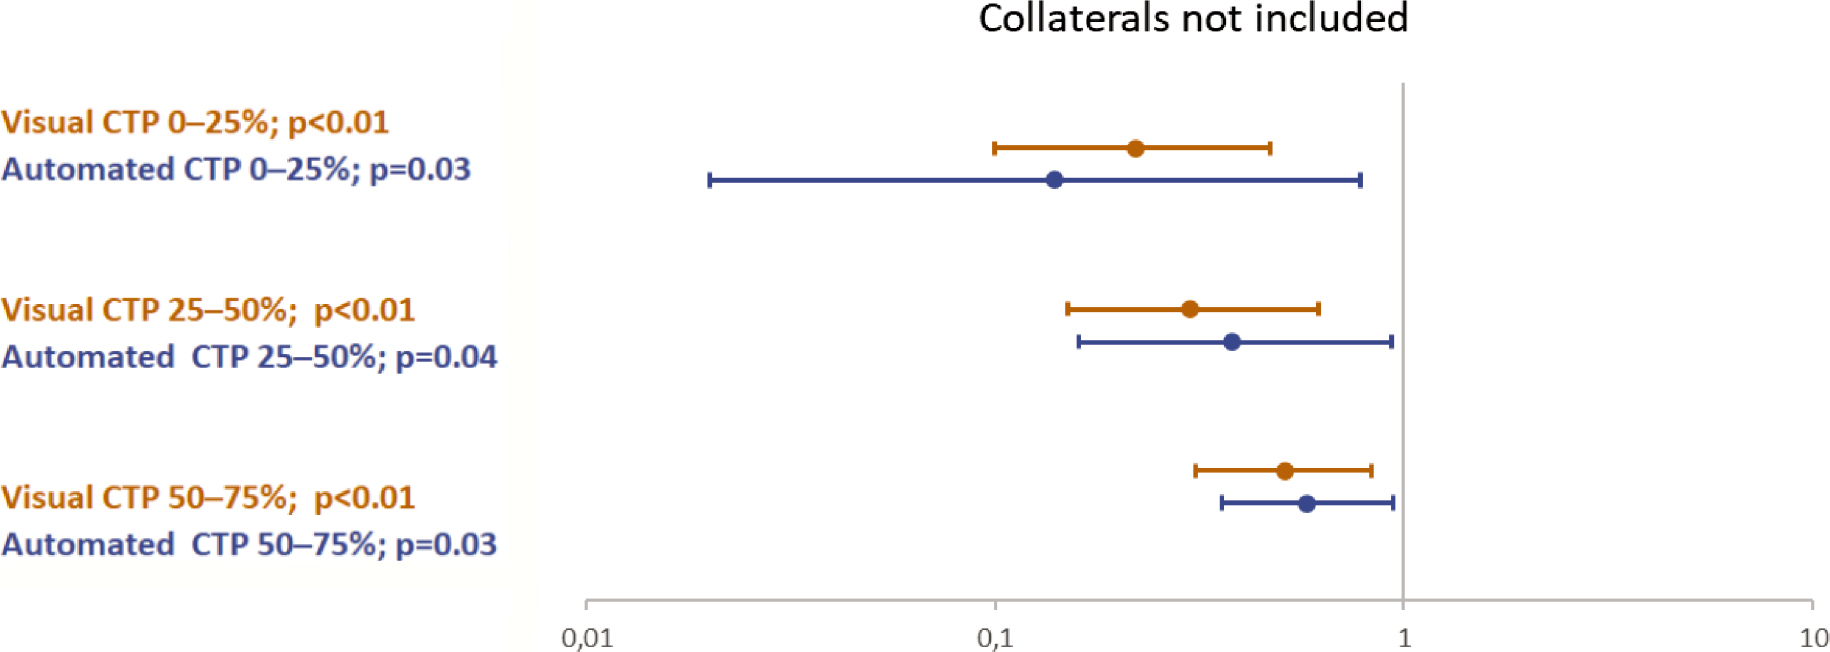
FIGURE 2A.
Odds ratios comparisons between automated (n = 528) and visual (n = 539) CT perfusion (CTP) for favourable outcome (mRS ≤ 3) in multivariable logistic regression; baseline model (without CT angiography [CTA] collaterals).
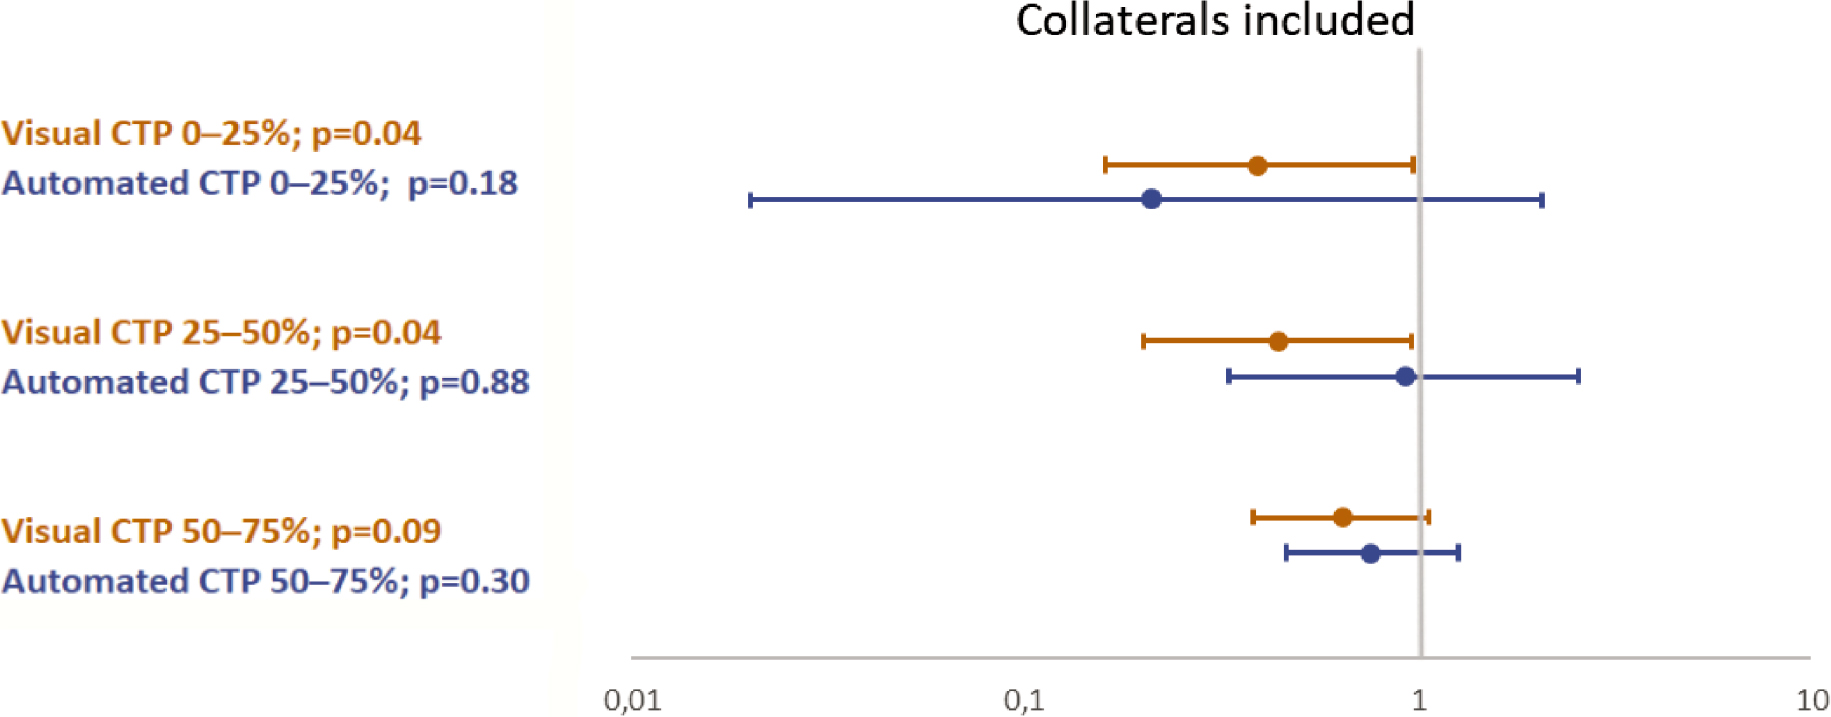
FIGURE 2B.
Odds ratios comparisons between automated (n = 528) and visual (n = 539) CT perfusion (CTP) for favourable outcome (mRS ≤ 3) in multivariable logistic regression; extended model (with CT angiography [CTA] collaterals).