
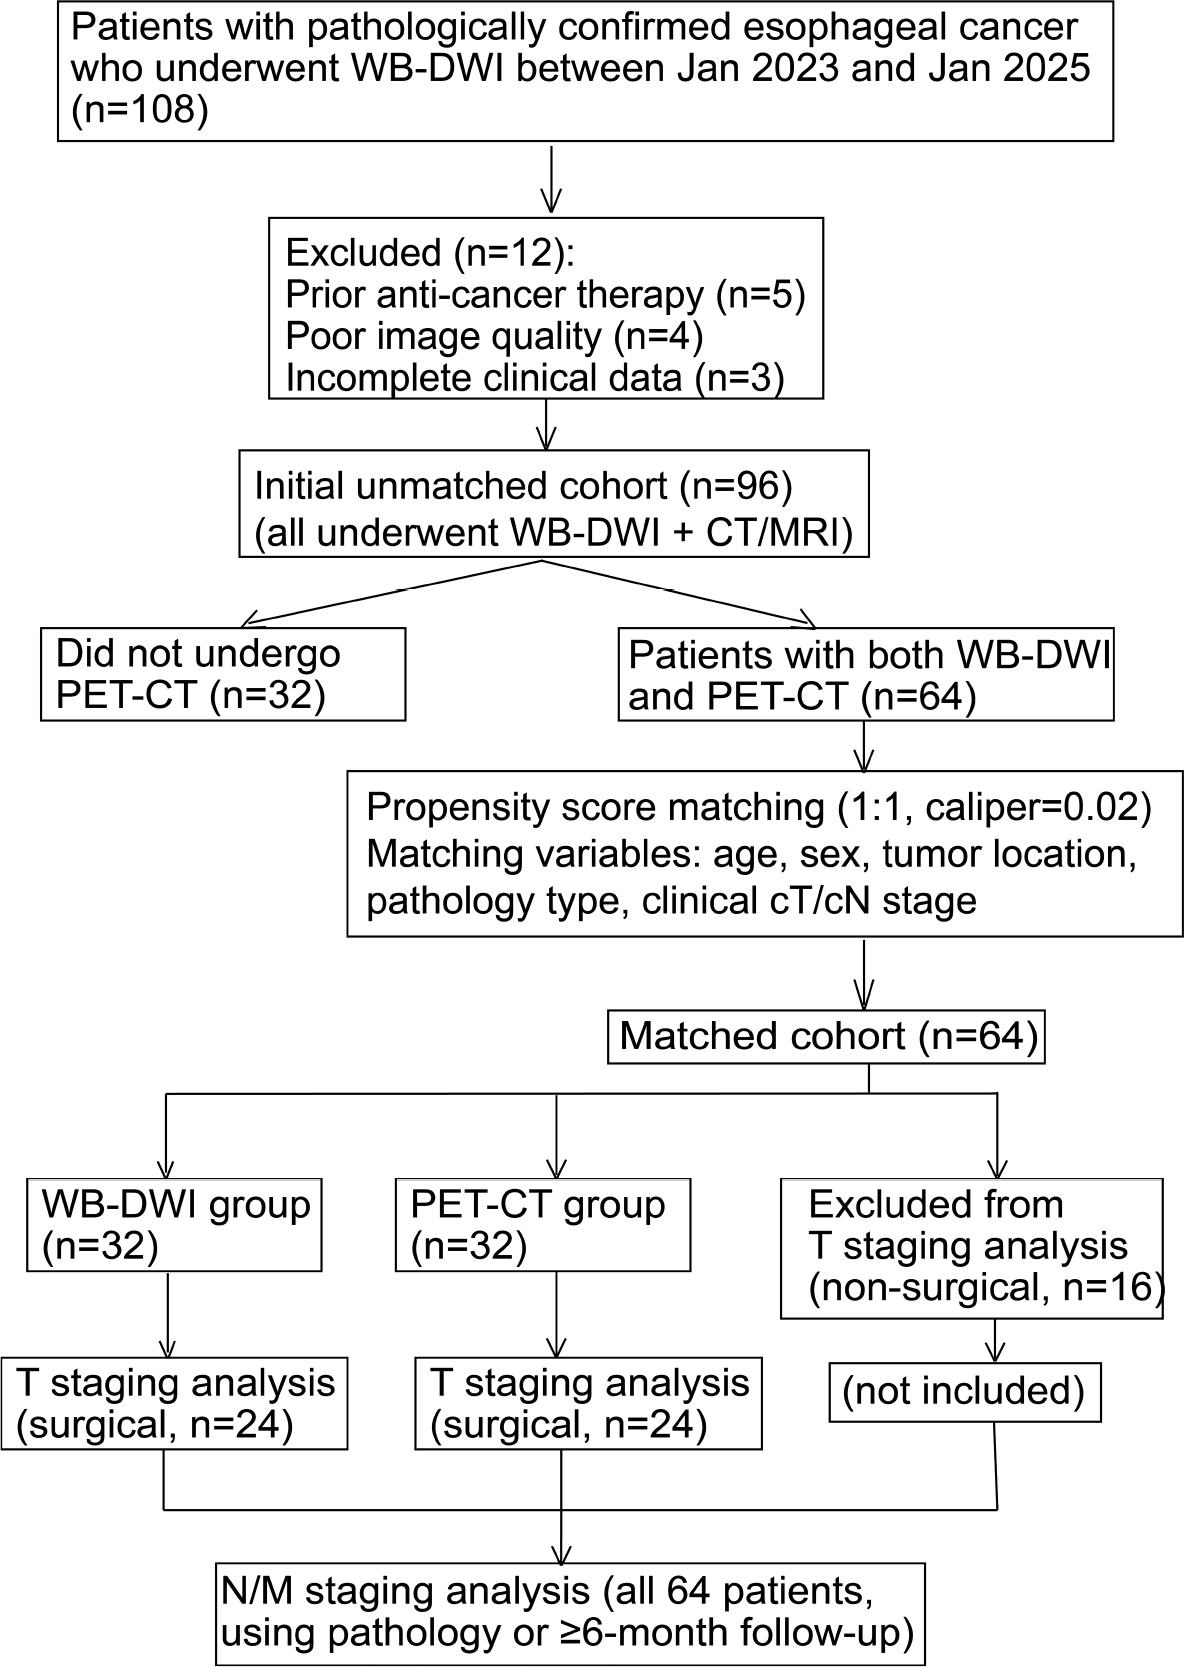
FIGURE 1.
Flowchart.
WB-DWI = whole-body diffusion-weighted imaging
TABLE 1A.
Baseline characteristics before propensity score matching (unmatched cohort, n = 64)
| Variable | WB-DWI group (n = 32) | PET-CT group (n = 32) | SMD |
|---|---|---|---|
| Age (years), mean ± SD | 62.5 ± 9.1 | 65.8 ± 8.2 | 0.38 |
| Gender, male, n (%) | 23 (71.9) | 25 (78.1) | 0.14 |
| Tumor location, n (%) | |||
| Cervical | 2 (6.3) | 3 (9.4) | 0.12 |
| Thoracic | 24 (75.0) | 23 (71.9) | 0.07 |
| Abdominal | 6 (18.7) | 6 (18.7) | 0.00 |
| Pathological type, n (%) | |||
| Squamous cell carcinoma | 27 (84.4) | 26 (81.3) | 0.08 |
| Adenocarcinoma | 5 (15.6) | 6 (18.7) | 0.08 |
| Preliminary clinical T stage, n (%) | |||
| cT1-2 | 13 (40.6) | 15 (46.9) | 0.13 |
| cT3-4 | 19 (59.4) | 17 (53.1) | 0.13 |
| Preliminary clinical N stage, n (%) | |||
| cN0 | 10 (31.3) | 12 (37.5) | 0.13 |
| cN+ | 22 (68.7) | 20 (62.5) | 0.13 |
| Tumor length (cm), mean ± SD | 4.3 ± 1.6 | 4.9 ± 1.8 | 0.35 |
| Degree of differentiation, n (%) | |||
| High | 4 (12.5) | 5 (15.6) | 0.09 |
| Medium | 18 (56.3) | 19 (59.4) | 0.06 |
| Low | 10 (31.3) | 8 (25.0) | 0.14 |
| Body mass index (kg/m2), mean ± SD | 21.9 ± 3.0 | 22.3 ± 2.9 | 0.14 |
TABLE 1B.
Baseline characteristics after propensity score matching (matched cohort, n = 64)
| Variable | WB-DWI group (n = 32) | PET-CT group (n = 32) | SMD |
|---|---|---|---|
| Age (years), mean ± SD | 63.2 ± 8.5 | 64.1 ± 7.9 | 0.11 |
| Gender, male, n (%) | 24 (75.0) | 25 (78.1) | 0.07 |
| Tumor location, n (%) | |||
| Cervical | 2 (6.3) | 3 (9.4) | 0.12 |
| Thoracic | 25 (78.1) | 23 (71.9) | 0.14 |
| Abdominal | 5 (15.6) | 6 (18.7) | 0.08 |
| Pathological type, n (%) | |||
| Squamous cell carcinoma | 28 (87.5) | 26 (81.3) | 0.17 |
| Adenocarcinoma | 4 (12.5) | 6 (18.7) | 0.17 |
| Preliminary clinical T stage, n (%) | |||
| cT1-2 | 14 (43.8) | 13 (40.6) | 0.06 |
| cT3-4 | 18 (56.2) | 19 (59.4) | 0.06 |
| Preliminary clinical N stage, n (%) | |||
| cN0 | 11 (34.4) | 10 (31.3) | 0.07 |
| cN+ | 21 (65.6) | 22 (68.7) | 0.07 |
| Tumor length (cm), mean ± SD | 4.5 ± 1.8 | 4.7 ± 1.6 | 0.12 |
| Degree of differentiation, n (%) | |||
| High | 5 (15.6) | 4 (12.5) | 0.09 |
| Medium | 18 (56.3) | 20 (62.5) | 0.13 |
| Low | 9 (28.1) | 8 (25.0) | 0.07 |
| Body mass index (kg/m2) mean ± SD | 21.8 ± 3.2 | 22.2 ± 2.9 | 0.13 |
TABLE 2.
Comparison of diagnostic accuracy in T staging (n = 32, compared with pathology results)
| Imaging technology | Number of accurate diagnoses | Diagnostic accuracy (%) |
|---|---|---|
| WB-DWI | 23 | 71.9 |
| PET-CT | 27 | 84.4 |
| χ2 = 1.60, p = 0.206 | ||
TABLE 3.
Comparative diagnostic performance of N staging (n = 64, all lymph node regions)
| Imaging technology | Sensitivity (%) | Specificity (%) | PPV (%) | NPV (%) | Accuracy rate (%) |
|---|---|---|---|---|---|
| WB-DWI | 78.1 (25/32) | 87.5 (28/32) | 86.2 | 80.0 | 82.8 |
| PET-CT | 90.6 (29/32) | 87.5 (28/32) | 87.9 | 90.3 | 89.1 |
1 PPV = positive predictive value; NPV = negative predictive value; WB-DWI = whole-body diffusion-weighted imaging
1 Numbers in parentheses indicate sample size. Sensitivity comparison: c2 = 4.01, p = 0.045. In this table, the sensitivity of WB-DWI (78.1%, 25/32) is calculated based on the 32 patients in the WB-DWI group; the sensitivity of PET-CT (90.6%, 29/32) is calculated based on the 32 patients in the PET-CT group. The notation “n = 64” at the top of the table merely indicates that there are a total of 64 diagnostic results from both techniques (32 + 32), and it does not mean that the two groups of data are combined.
TABLE 4.
Comparative diagnostic performance of M staging (n = 64, patient level)
| Imaging Technology | Sensitivity (%) | Specificity (%) | PPV (%) | NPV (%) | Accuracy rate (%) |
|---|---|---|---|---|---|
| WB-DWI | 83.3 (10/12) | 92.3 (48/52) | 76.9 | 94.1 | 90.6 |
| PET-CT | 91.7 (11/12) | 94.2 (49/52) | 84.6 | 96.1 | 93.8 |
1 PPV = positive predictive value; NPV = negative predictive value; WB-DWI = whole-body diffusion-weighted imaging
1 1. The gold standard is pathological confirmation or confirmation via follow-up. The diagnostic parameters for WB-DWI in the table are calculated based on the 32 patients in the WB-DWI group; the diagnostic parameters for PET-CT are calculated based on the 32 patients in the PET-CT group. The notation “n = 32” at the top of the table corresponds to the sample size of each group and does not indicate that data from the two groups have been combined.
1 3. Explanation of the denominators 12 and 52: Among the 32 patients in the WB-DWI group, 6 were gold standard positive (M1) and 26 were negative (M0); in the PET-CT group of 32 patients, 6 were gold standard positive (M1) and 26 were negative (M0). In the table, 10/12 represents 10 true positives in the WB-DWI group (out of a total of 12 actual positives, i.e., the sum of positives from both groups), and 48/52 represents the sum of true negatives from both groups. To avoid misunderstanding, we clarify: the “12” in 10/12 refers to the total number of positive cases across both groups, and the “52” in 48/52 refers to the total number of negative cases across both groups. The sensitivity and specificity for both techniques were calculated based on data within their respective groups and then presented as aggregated results.
TABLE 5.
Comparison of overall accuracy in TNM staging (n = 64)
| Imaging technology | Number of accurate diagnoses | Overall staging accuracy rate (%) |
|---|---|---|
| WB-DWI | 54 | 84.4 |
| PET-CT | 56 | 87.5 |
1 Accurate diagnosis refers to complete agreement between the overall radiological staging and the final pathological/clinical staging (Stages I, II, III, or IV). 2. The accuracy rate for the WB-DWI group is calculated based on the 32 patients in that group; the accuracy rate for the PET-CT group is calculated based on the 32 patients in that group. The “n = 64” above the table represents the total number of diagnostic results for both techniques (32+32) and does not indicate a single accuracy rate calculated by combining data from both groups. 3. Intergroup comparisons were performed using the chi-square test: χ2 = 0.22, p = 0.639.
TABLE 6.
Objective and subjective evaluation of image quality and examination duration
| Evaluation Indicators | WB-DWI group (n = 32) | PET-CT group (n = 32) | F | p |
|---|---|---|---|---|
| Image signal-to-noise ratio, (mean ± SD) | 15.2 ± 4.1 | 22.8 ± 5.6 | t = 6.42 | < 0.001 |
| Subjective quality rating (5-point scale, mean ± SD) | 3.8 ± 0.7 | 4.5 ± 0.5 | t = 4.76 | < 0.001 |
| Inspection time (minute, mean ± SD) | 28.5 ± 5.2 | 45.3 ± 8.7 | t = 9.83 | < 0.001 |
TABLE 7.
Inter-observer agreement analysis (Kappa Coefficient)
| Evaluation Project | WB-DWI (κ-value) | PET-CT (κ-value) |
|---|---|---|
| T-Installment Assessment | 0.65 | 0.78 |
| N-period judgment | 0.72 | 0.81 |
| M-stage determination | 0.80 | 0.85 |
| Overall phasing assessment | 0.75 | 0.82 |
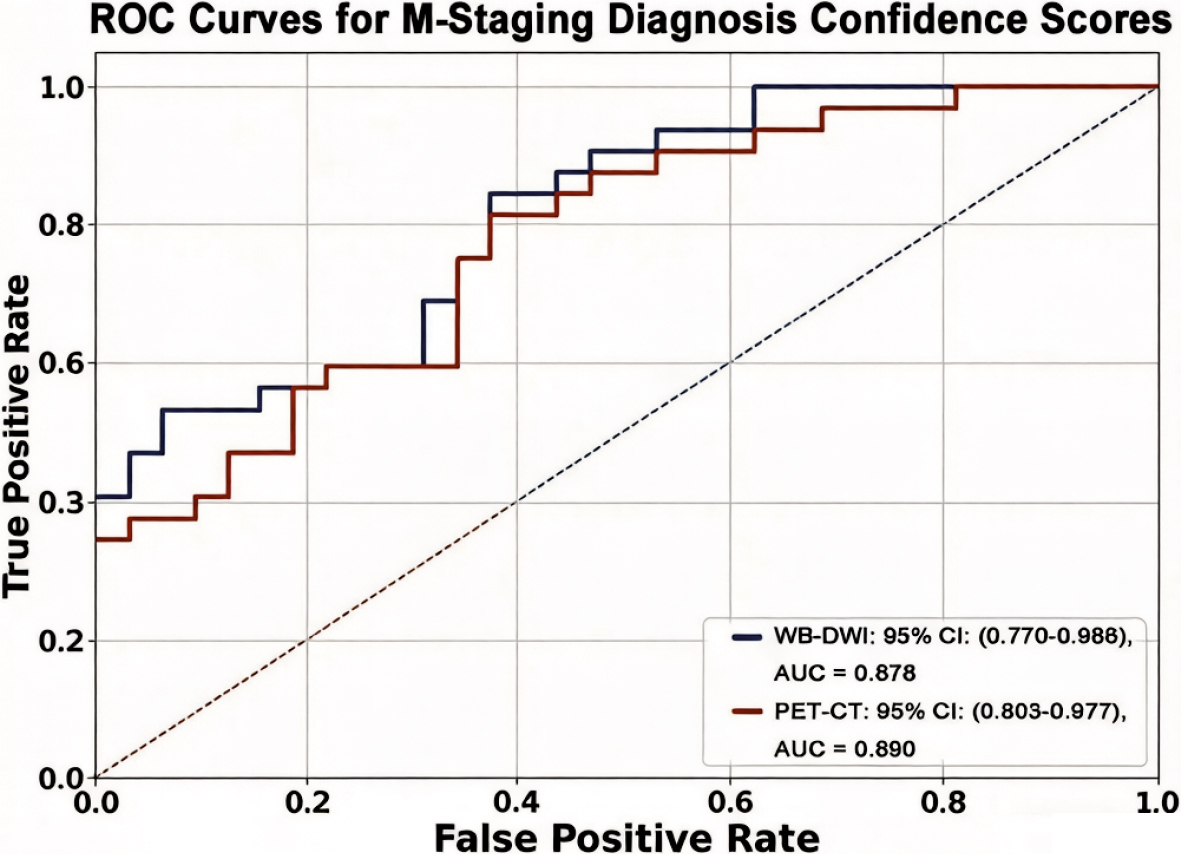
FIGURE 2.
ROC curves for M-staging diagnosis confidence score.
AUC = area under the curve; CI = confidence interval; WB-DWI = whole-body diffusion-weighted imaging
TABLE 8.
ROC curve analysis results (diagnostic performance of N staging and M staging)
| Imaging technology | Evaluation project | AUC (95% CI) | Yorden index |
|---|---|---|---|
| WB-DWI | N installments | 0.828 (0.715–0.941) | 0.656 |
| PET-CT | N installments | 0.890 (0.803–0.977) | 0.781 |
| WB-DWI | M installments | 0.878 (0.770–0.986) | 0.756 |
| PET-CT | M installments | 0.929 (0.850–1.000) | 0.859 |
1 AUC = area under the curve; CI = confidence interval; WB-DWI = whole-body diffusion-weighted imaging
1 The DeLong test revealed no statistically significant difference in AUC between the two techniques for N staging (Z = 1.34, p = 0.180) or for M staging (Z = 1.12, p = 0.263). # N and M staging diagnoses are based on qualitative assessments and do not utilize a single continuous variable; therefore, numerical cutoff values are not provided.
TABLE 9.
Detection of small metastatic lymph nodes: comparison of node size between true-positive and false-negative cases on WB-DWI and PET-CT
| Imaging modality | Detection outcome | Number of nodes (n) | Short-axis diameter (mm), median (range) | Statistical comparison (TP vs. FN) |
|---|---|---|---|---|
| WB-DWI | True-positive | 25 | 8.2 (4.5–18.6) | p = 0.008* |
| False-negative | 7 | 5.1 (3.2–6.8) | ||
| PET-CT | True-positive | 29 | —(3.8–†) | p = 0.278‡ |
| False-negative | 3 | 4.2 (3.5–5.0) |
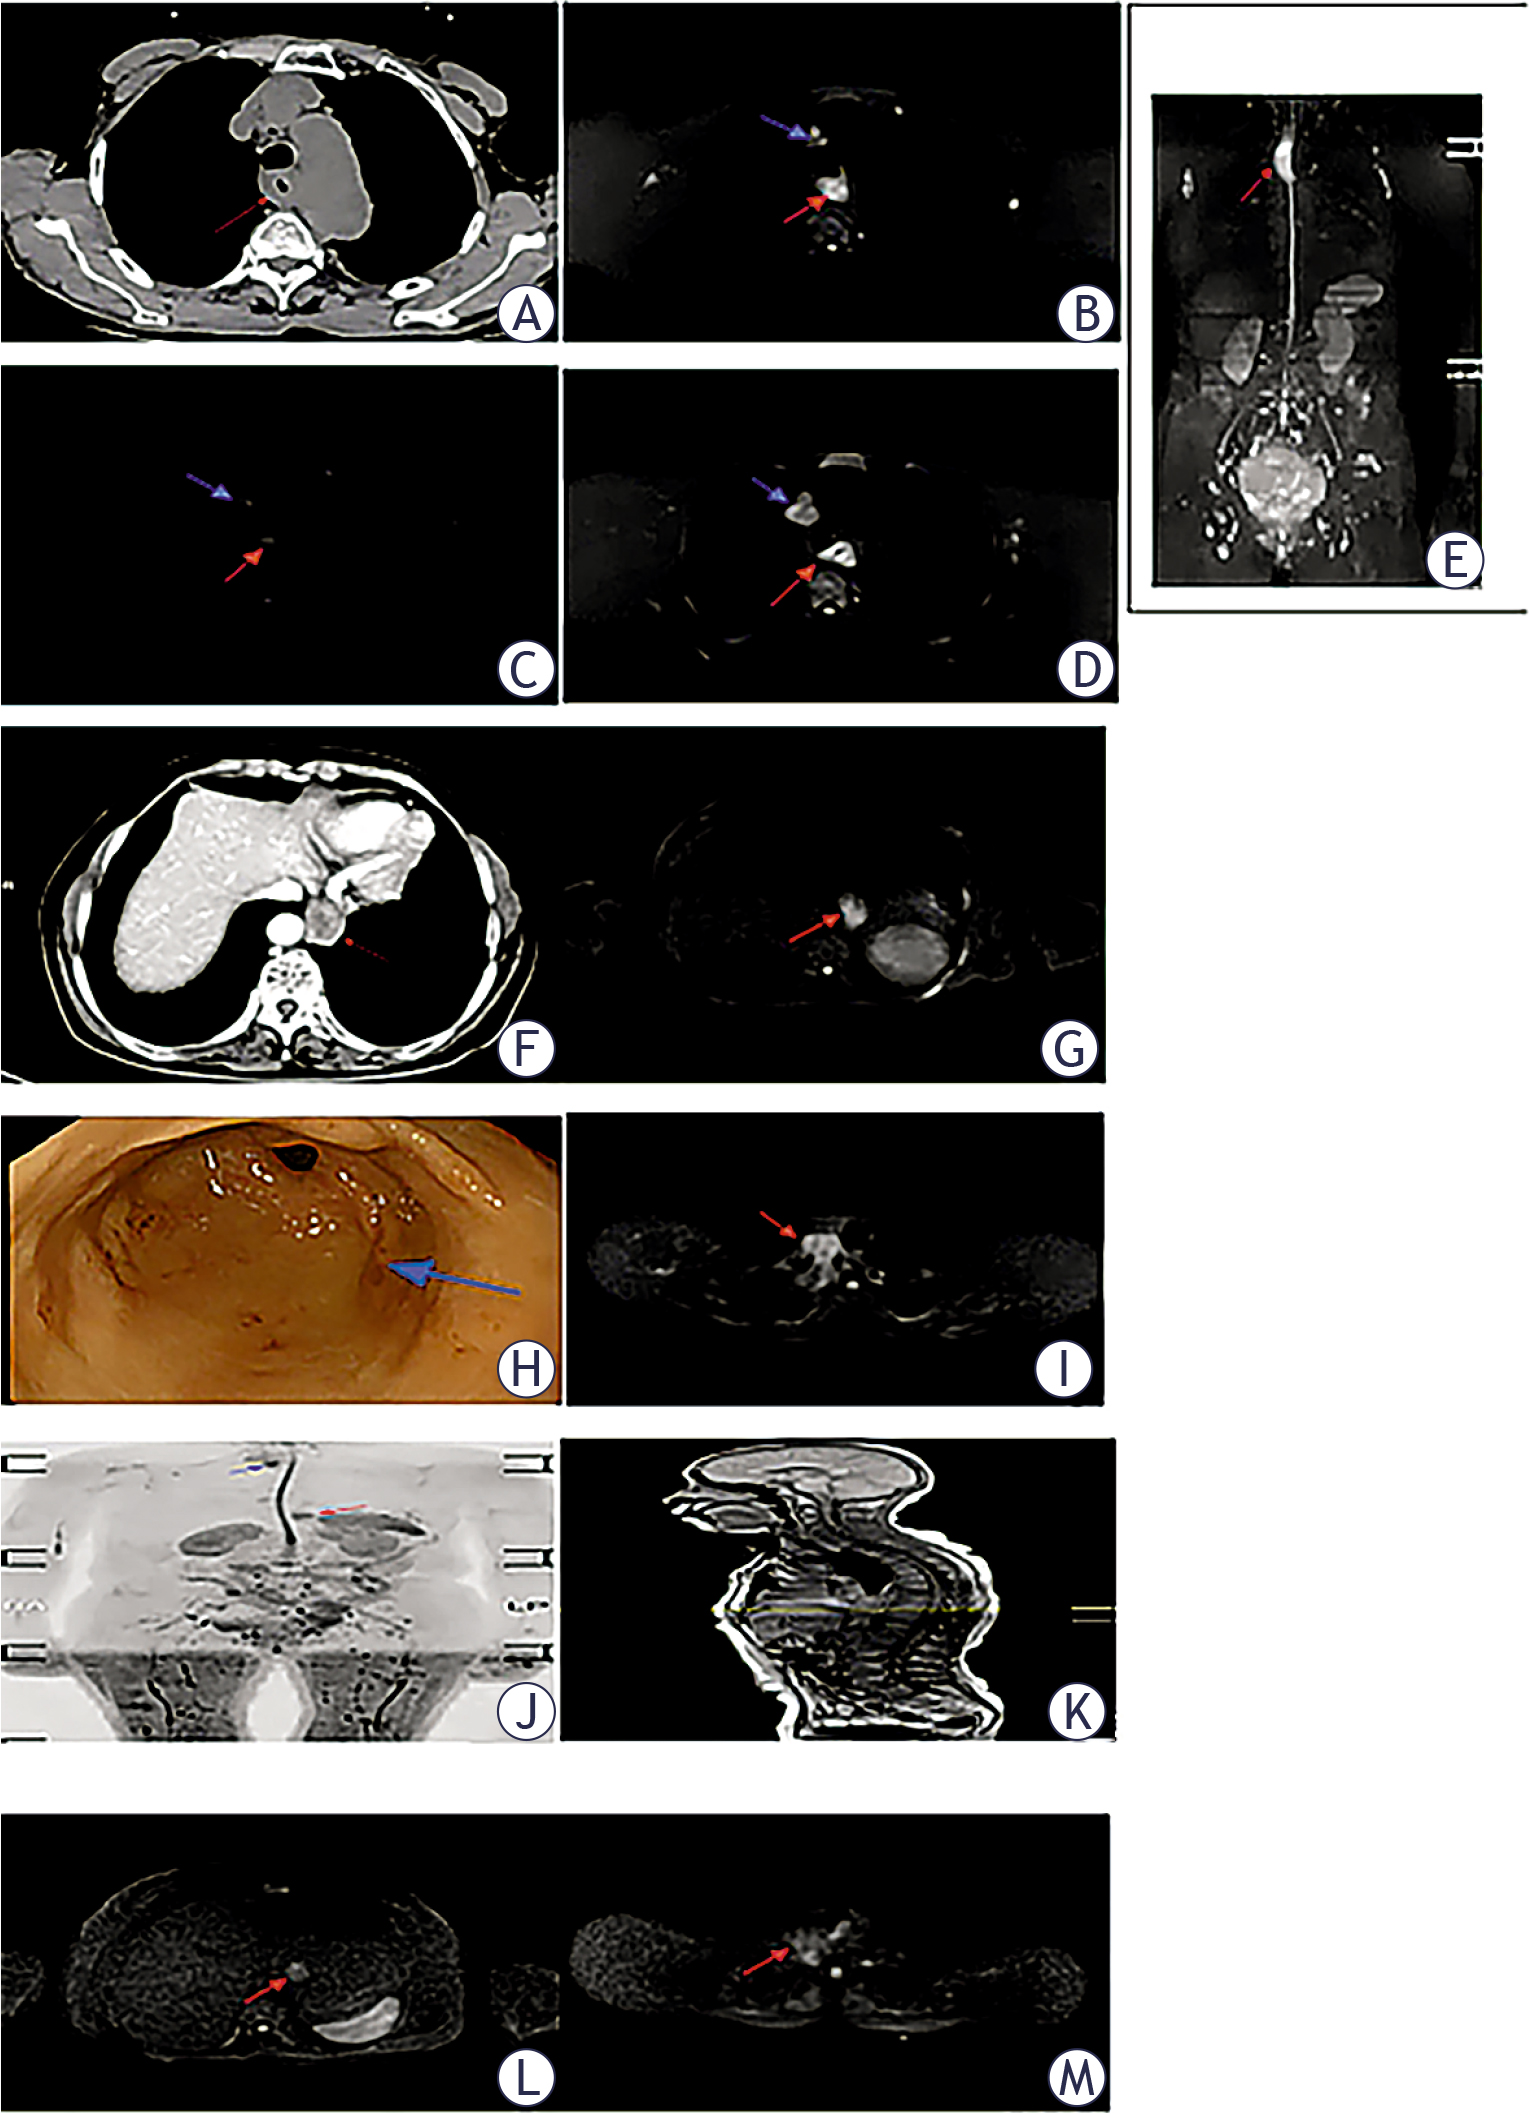
FIGURE 3.
Serial whole-body DWI for dynamic treatment monitoring and restaging in two representative esophageal cancer patients.
Case 1 (A-E): An 86-year-old female with newly diagnosed mid-upper esophageal cancer and mediastinal lymph node metastasis. (A) Baseline contrast-enhanced CT shows irregular wall thickening of the esophagus (red arrow) and a small pretracheal lymph node (blue arrow, indeterminate). (B) Baseline axial WB-DWI (b = 800 s/mm2) demonstrates marked hyperintensity of the primary tumor (red arrow) and the lymph node (blue arrow), indicating metastasis. (C) Whole-body DWI maximum intensity projection (MIP) delineates the longitudinal extent of the primary tumor (red arrows), correlating well with barium esophagography and endoscopy. (D) After 3 months of chemoradiotherapy, WB-DWI shows reduced signal intensity and size of both lesions, indicating partial response. (E) After 6 months, both lesions have progressed (increased size and signal), indicating disease progression.
Case2 (F-M): A 68-year-old female with lower esophageal cancer and right supraclavicular lymph node metastasis. (F) Baseline contrast-enhanced CT shows thickening and enhancement of the lower esophagus (red arrow). (G) Axial WB-DWI shows a hyperintense primary tumor (red arrow). (H) Endoscopy confirms the lower esophageal lesion (blue arrow). (I) Axial WB-DWI reveals hyperintense, partially confluent right supraclavicular lymph nodes (blue arrows). (J) Whole-body DWI MIP shows the primary tumor (red arrow) and supraclavicular nodes (blue arrows). (K) Sagittal WB-DWI localizer image corresponding to (F) can guide radiotherapy planning. (L) After 8 months of treatment, the primary tumor shows reduced signal and size (red arrow). (M) The supraclavicular nodes also show reduced signal (blue arrows), indicating treatment response.