
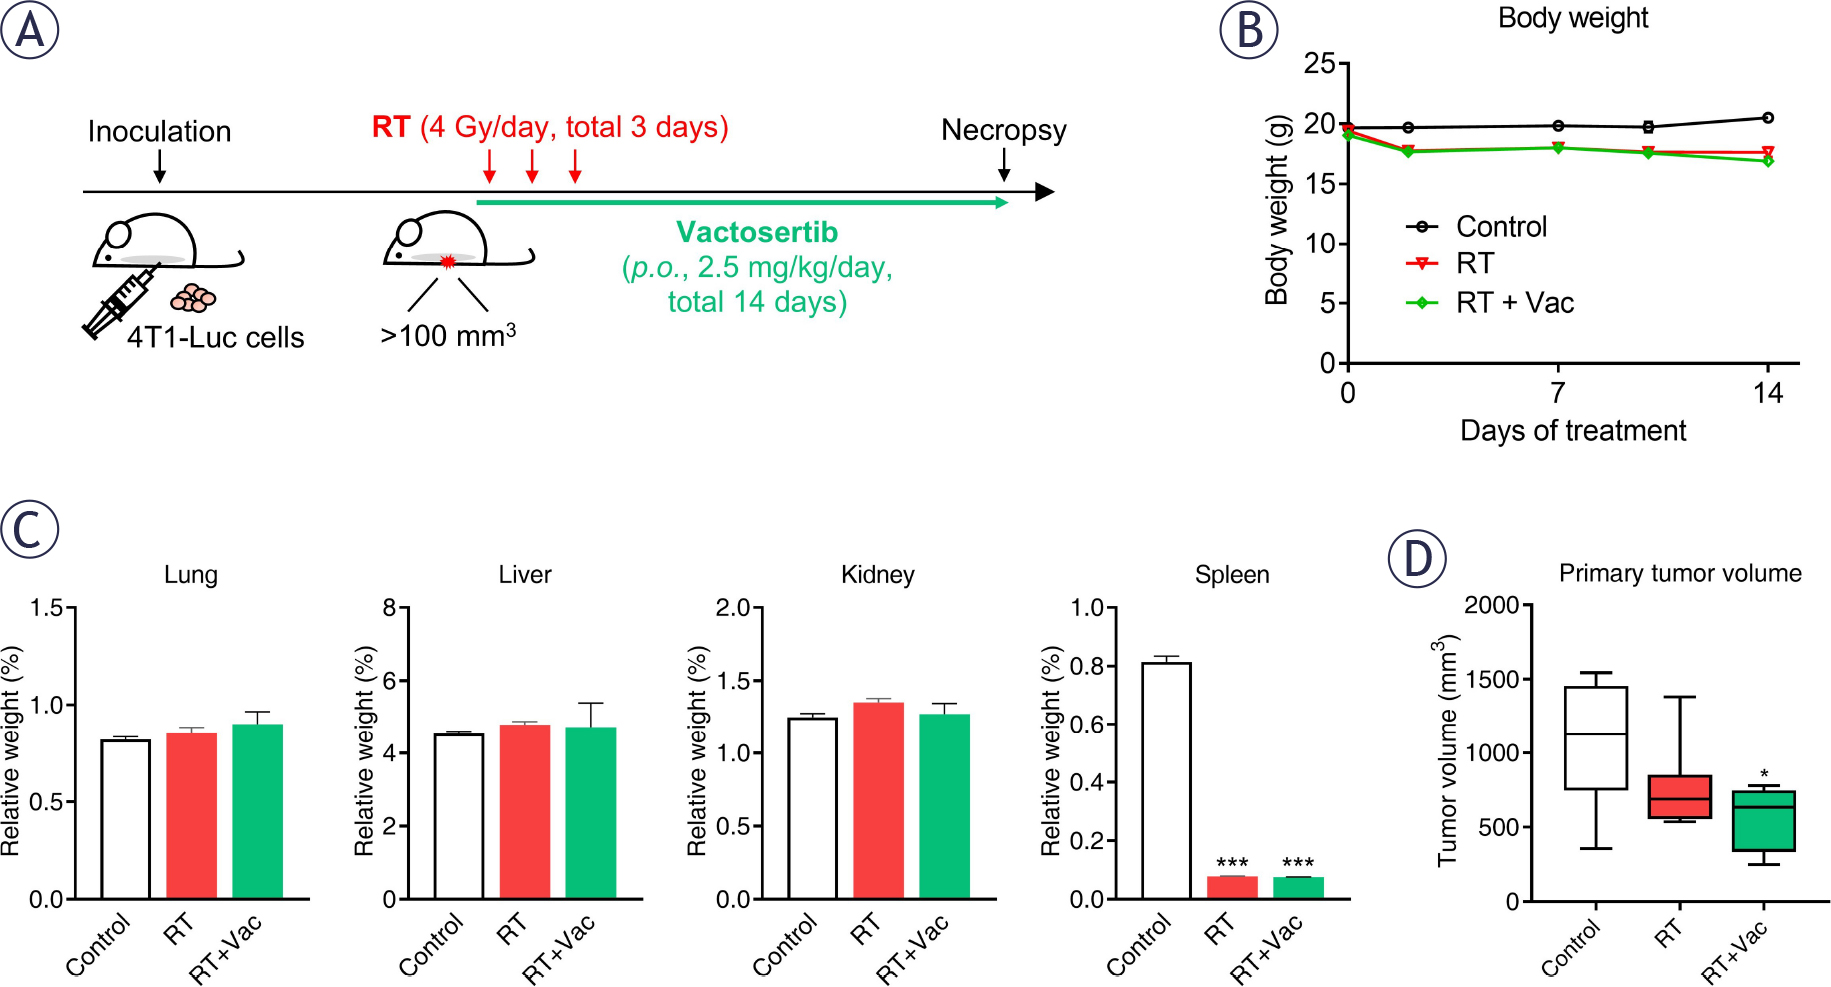
FIGURE 1.
Experimental design and treatment effects of RT and Vactosertib in a breast cancer mouse model. (A) Schematic overview of experimental design. BALB/c mice bearing 4T1-luc mammary tumors (~100 mm3) were randomly assigned to control, radiotherapy (RT), or radiotherapy plus Vactosertib (RT + Vac) groups. Mice received whole-body irradiation (4 Gy/day for 3 consecutive days) with or without Vactosertib treatment, followed by molecular and histological analyses including gene expression profiling. (B) Body weight changes during the treatment period (0, 2, 7, 10 and 14 days). No significant differences were observed among the groups. (C) Relative organ weights of lung, liver, kidney, and spleen at the endpoint. Spleen weight was significantly reduced in RT-treated groups compared with that in the control group. (D) Tumor volume at day 14 after treatment. Combination treatment (RT + Vac) resulted in greater tumor growth inhibition compared with RT alone. Data are presented as mean ± standard error of mean (SEM) (n = 8 per group). Statistical significance was determined using one-way analysis of variance (ANOVA) followed by Tukey’s post hoc test (*p < 0.05, ***p < 0.001).
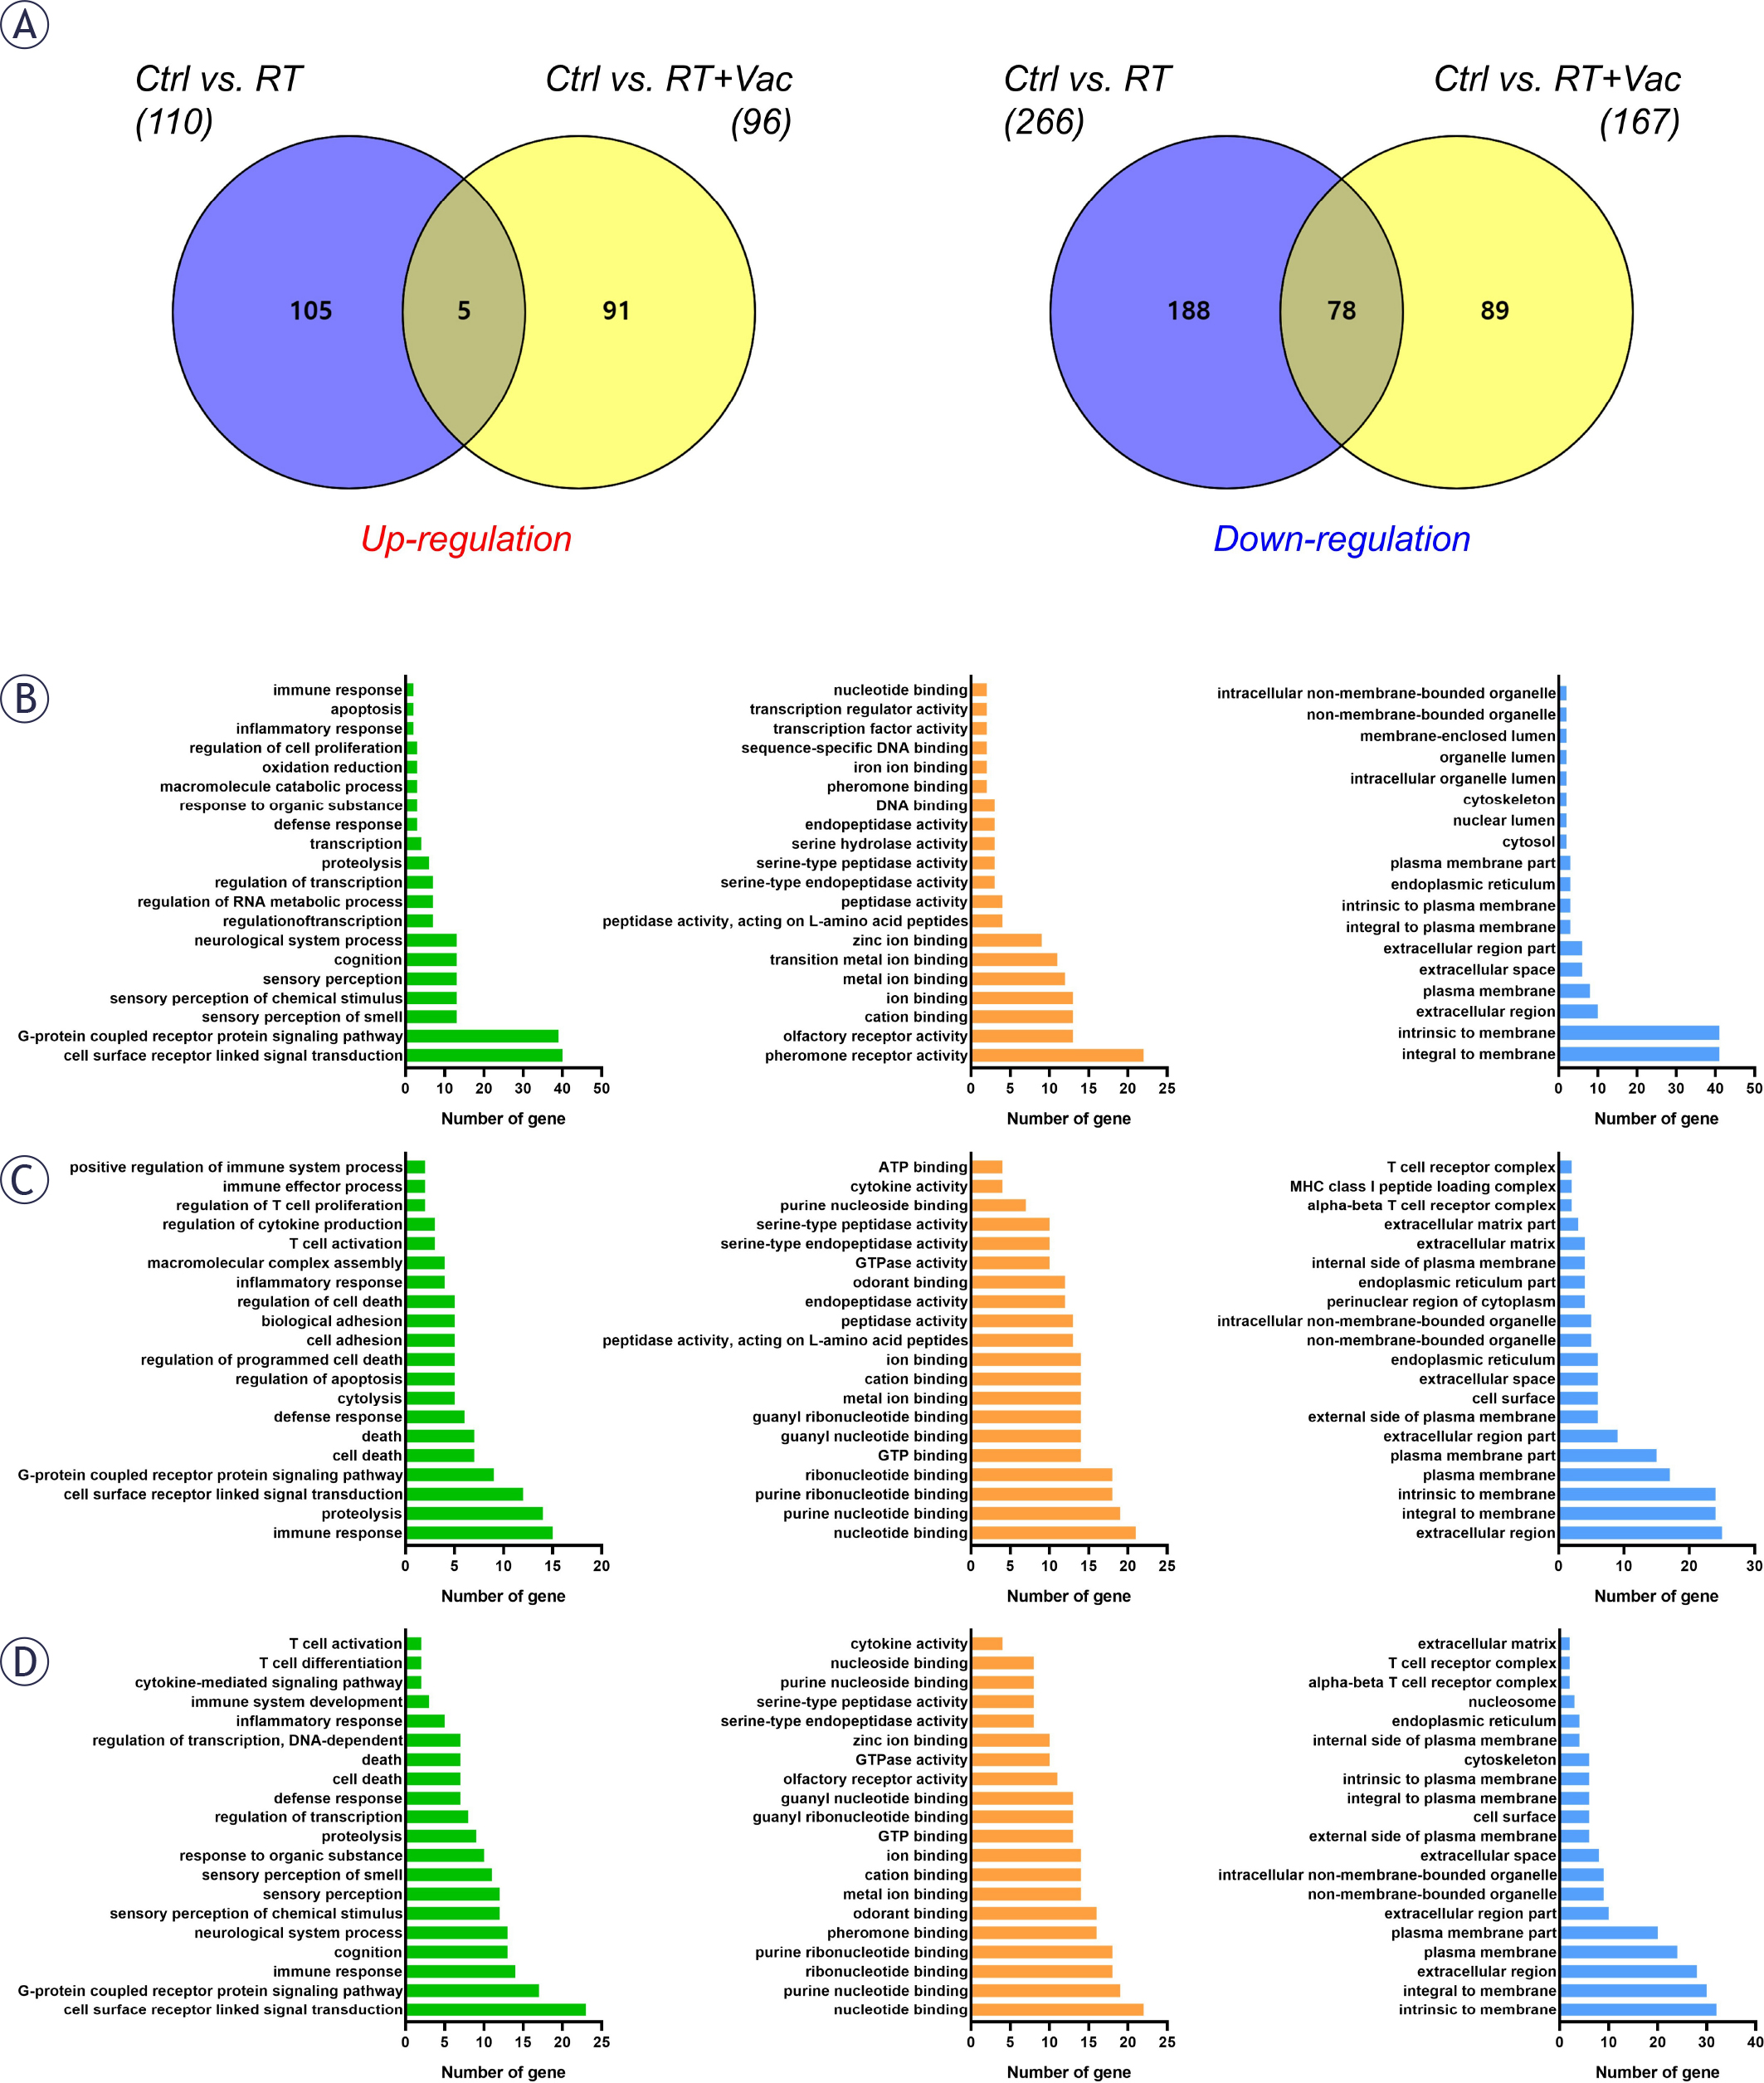
FIGURE 2.
Transcriptomic profiling and Gene Ontology (GO) functional enrichment analysis of differentially expressed genes. (A) Venn diagrams showing the number of unique and overlapping up-regulated (left, red) and down-regulated (right, blue) differentially expressed genes (DEGs) in tumor tissues from the radiotherapy (RT) and radiotherapy plus Vactosertib (RT + Vac) groups compared with the Control group (|FC|≥2, 2, p < 0.05). (B-D) GO enrichment analysis of DEGs categorized into Biological Process (green), Molecular Function (orange), and Cellular Component (blue). Panels represent enriched terms for the comparisons of (B) Control vs. RT, (C) Control vs. RT+Vac, and (D) RT vs. RT+Vac.
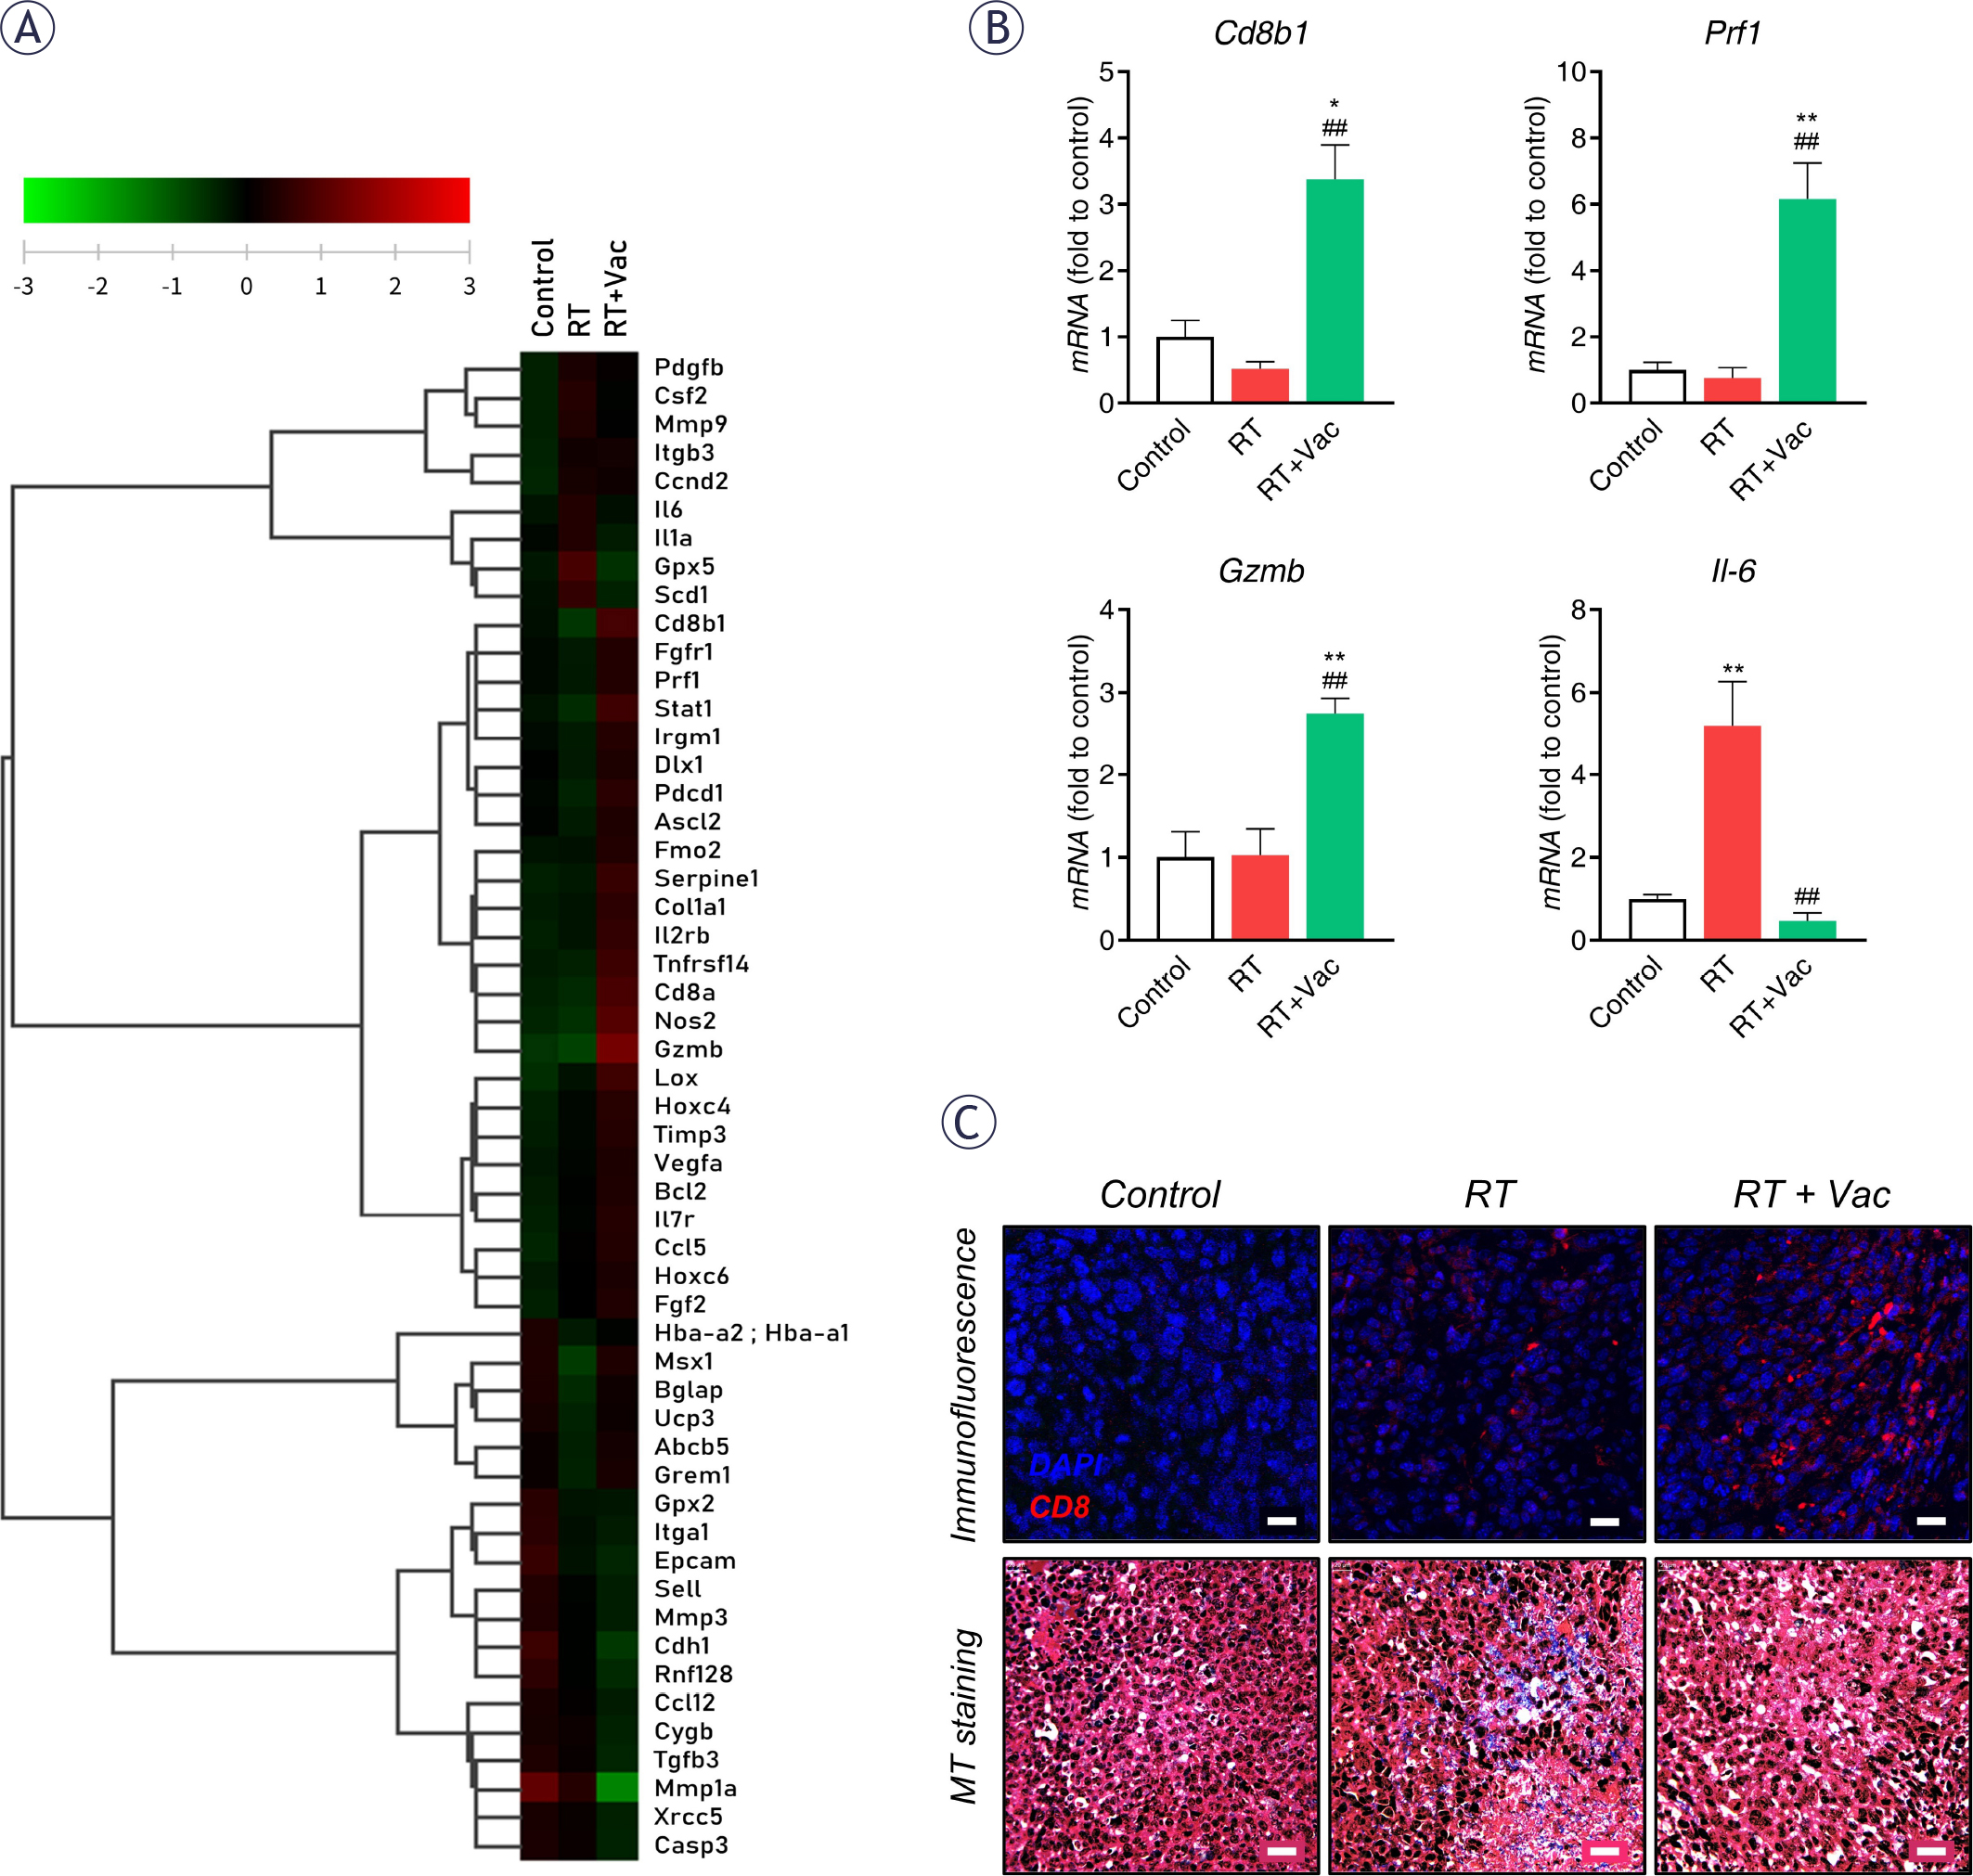
FIGURE 3.
Enhancement of anti-tumor immunity and modulation of the TME by the combination of RT and Vactosertib. (A) Heatmap analysis showing the differential expression of selected genes involved in immune response, apoptosis, and tissue remodeling in 4T1-luc tumors from Control, Radiotherapy (RT), and Radiotherapy plus Vactosertib (RT + Vac) groups. Red and green colors indicate up-regulated and down-regulated genes, respectively. (B) qRT-PCR validation of key immune-related genes, including Cd8bl, Gzmb, Prfl, and Il-6. The mRNA expression levels were normalized to those of the Control group. Data are presented as mean ± standard error of mean (SEM) (n = 8 per group). Statistical significance was determined using one-way analysis of variance (ANOVA) followed by Tukey’s post hoc test (*p < 0.05, **p < 0.01 vs. Control; ##p < 0.01 vs. RT). (C) Representative histological images of tumor sections. (Upper) Immunofluorescence staining for CD8 (red) and DAPI (blue) showing the infiltration of CD8+ T cells into the tumor tissue. Scale bar = 20 μm. (Lower) Masson’s trichrome (MT) staining for evaluating collagen deposition and tissue morphology within the TME. Scale bar = 20 μm.
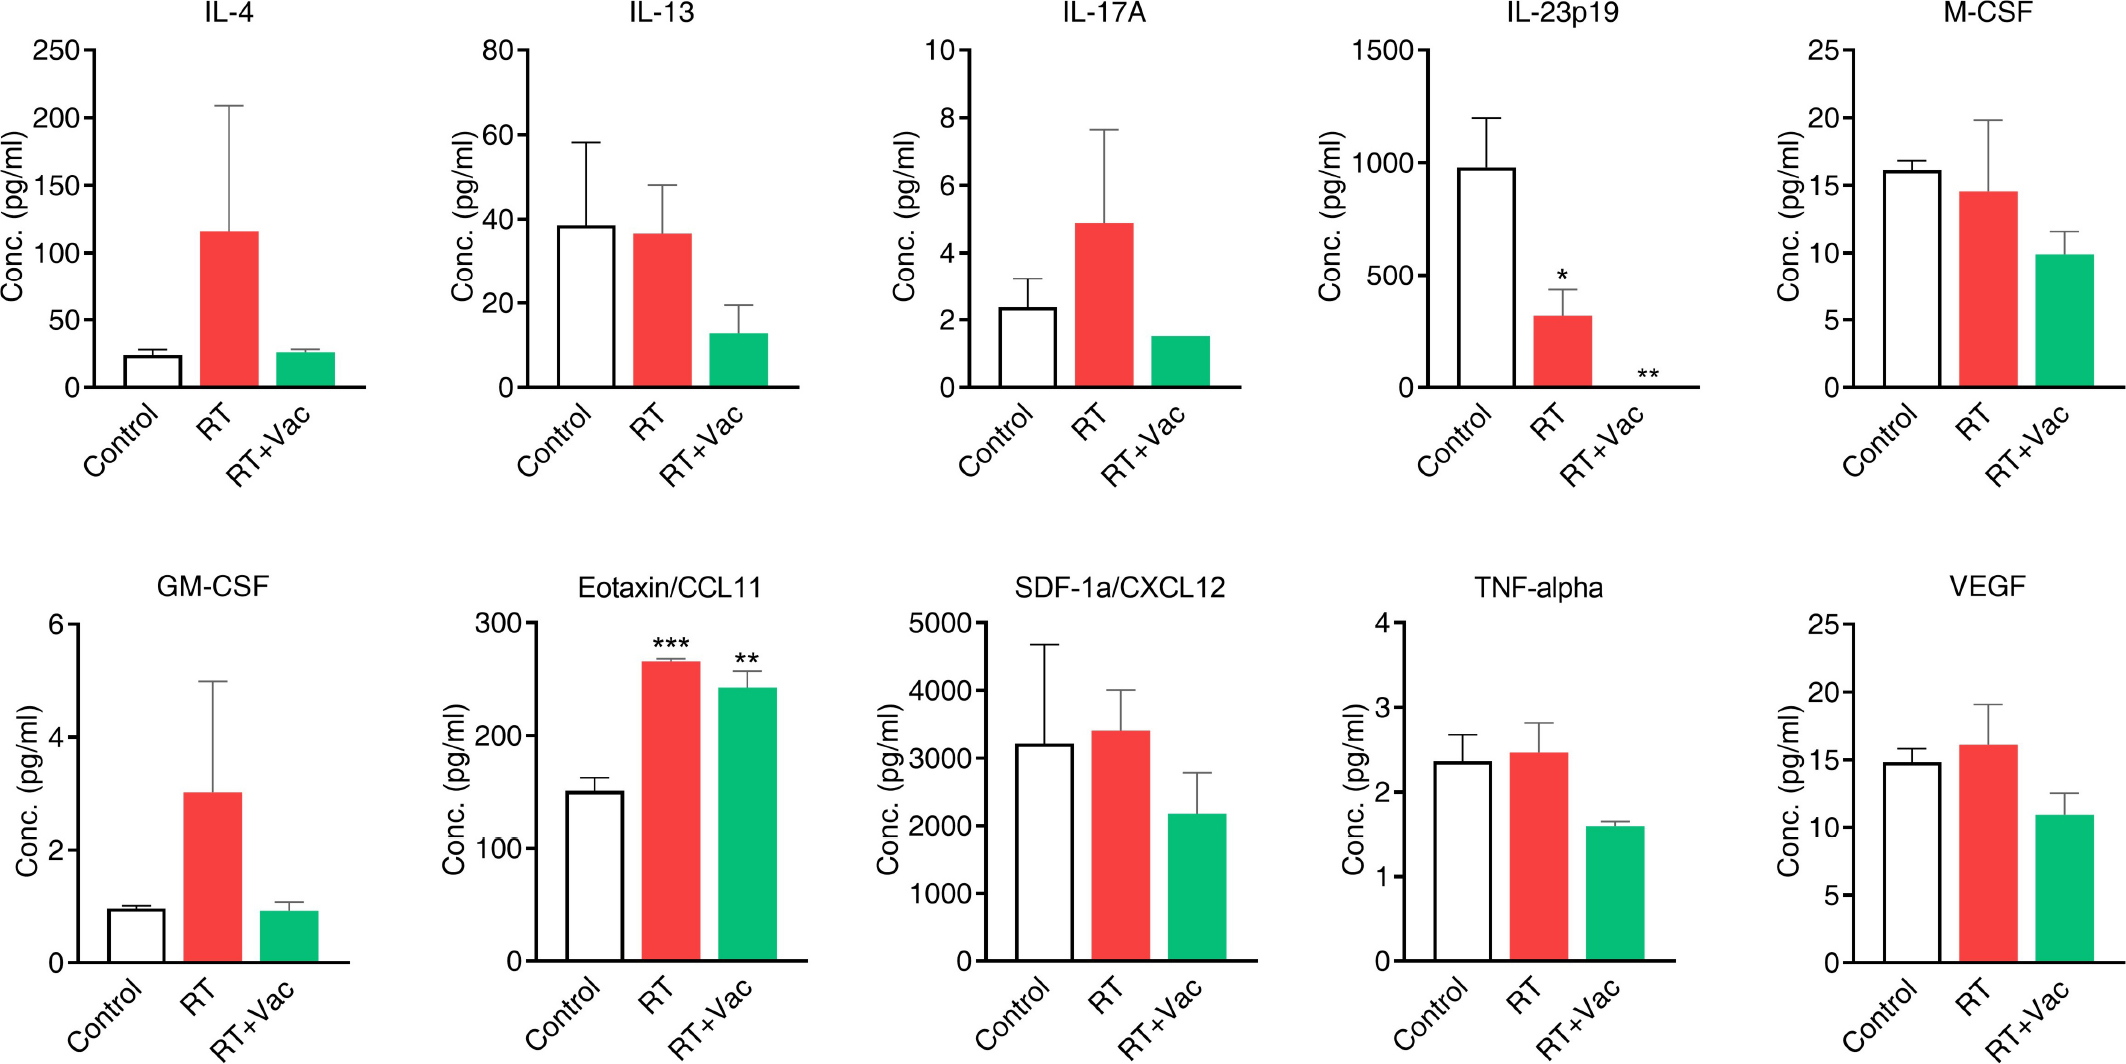
FIGURE 4.
Impact of RT and Vactosertib on cytokine and chemokine profiles in the TME. The concentrations of various cytokines and chemokines, including IL-4, IL-13, IL-17A, IL-23pl9, M-CSF, GM-CSF, Eotaxin/CCL11, SDF-1a/CXCL12, TNF-alpha, and VEGF, were measured in tumor lysates using ELISA. 4T1-luc tumor-bearing mice were treated with Control (white), Radiotherapy (RT, red), or Radiotherapy plus Vactosertib (RT + Vac, green). Data are expressed as mean ± standard error of mean (SEM) (n = 8 per group). Statistical significance was determined by one-way analysis of variance (ANOVA) followed by Tukey’s post hoc test (*p < 0.05, **p < 0.01, ***p < 0.001).