
TABLE 1.
Side effects during chemoradiation and HMGB1
| Patient | Toxicity (CTC) | Infection / complication | HMGB1 during treatment |
|---|---|---|---|
| 101 | 1° (skin) | upper extremity venous thrombosis | undulation / ascent*** |
| 102 | 1° (skin) | urinary tract infection | undulation / ascent*** |
| 103 | 2° (skin) | undulation / ascent*** | |
| 104 | 2° (skin) | undulation / ascent*** | |
| 105 | 3° (proctitis, diarrhea) | undulation / ascent*** | |
| 106 | 1° (skin) | undulation / ascent*** | |
| 107 | 2° (skin) | undulation / decline**** | |
| 108 | 2° (diarrhea) | rosacea / psoriasis exacerbation* | undulation / ascent*** |
| 109 | 0 | Decline | |
| 110 | 1° (skin) | undulation / ascent*** | |
| 111 | 1° (skin) | undulation / ascent*** | |
| 112 | 1° (skin) | pulmonary embolism (after week 4**) | undulation / ascent*** |
| 113 | 0 | undulation / ascent*** | |
| 115 | 2° (skin) | Ascent | |
| 116 | 1° (skin) | Ascent | |
| 117 | 1° (skin) | decline | |
| 118 | 1° (skin) | undulation / ascent*** | |
| 119 | 2° (skin) | ascent | |
| 120 | 2° (skin) | ascent |
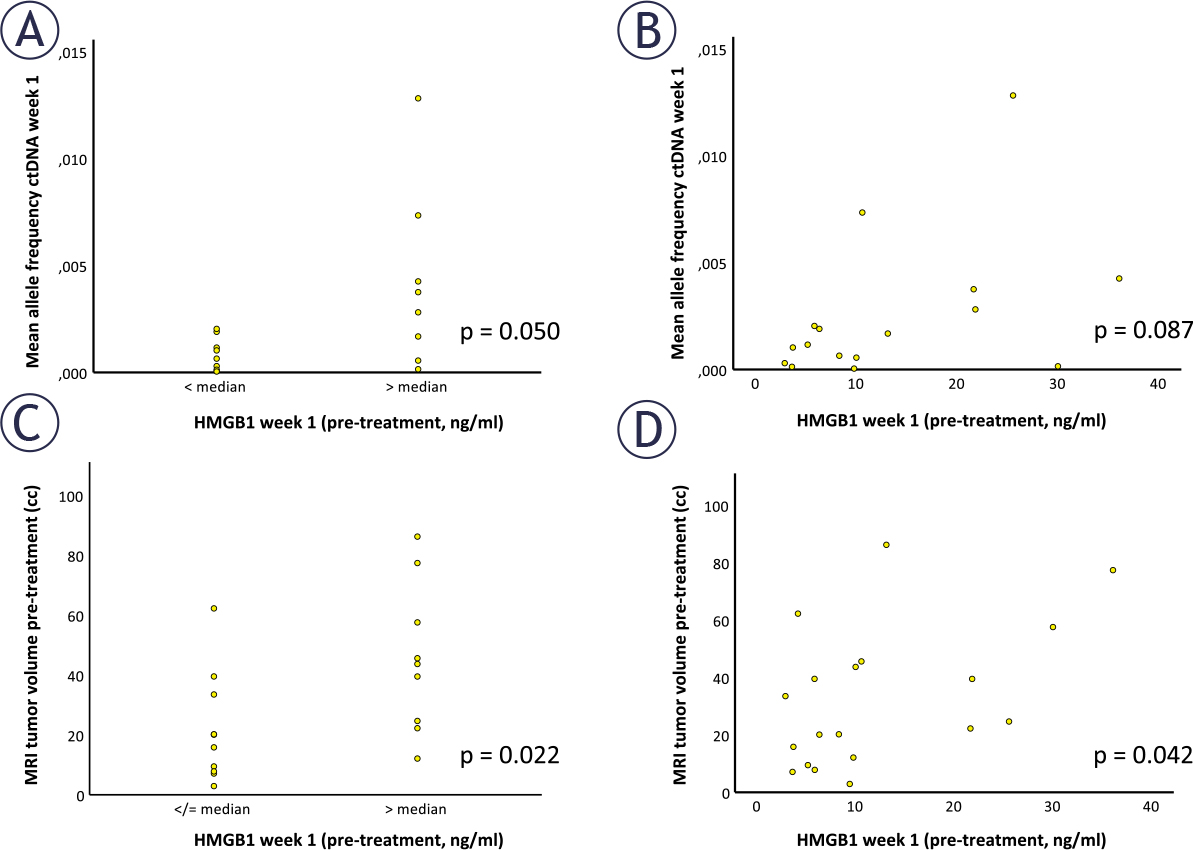
FIGURE 1.
Initial High Mobility Group Box 1 protein (HMGB1) levels of the pre-therapeutic sample on day 1 of treatment were correlated with the corresponding mean allele frequency (AF) of cell-free tumor DNA (ctDNA) grouped according to the median of HMGB1 (A) and absolute values (B). In Figure 1C and 1D HMGB1 levels were correlated with the initial tumor volumes in magnetic resonance imaging (MRI), respectively.
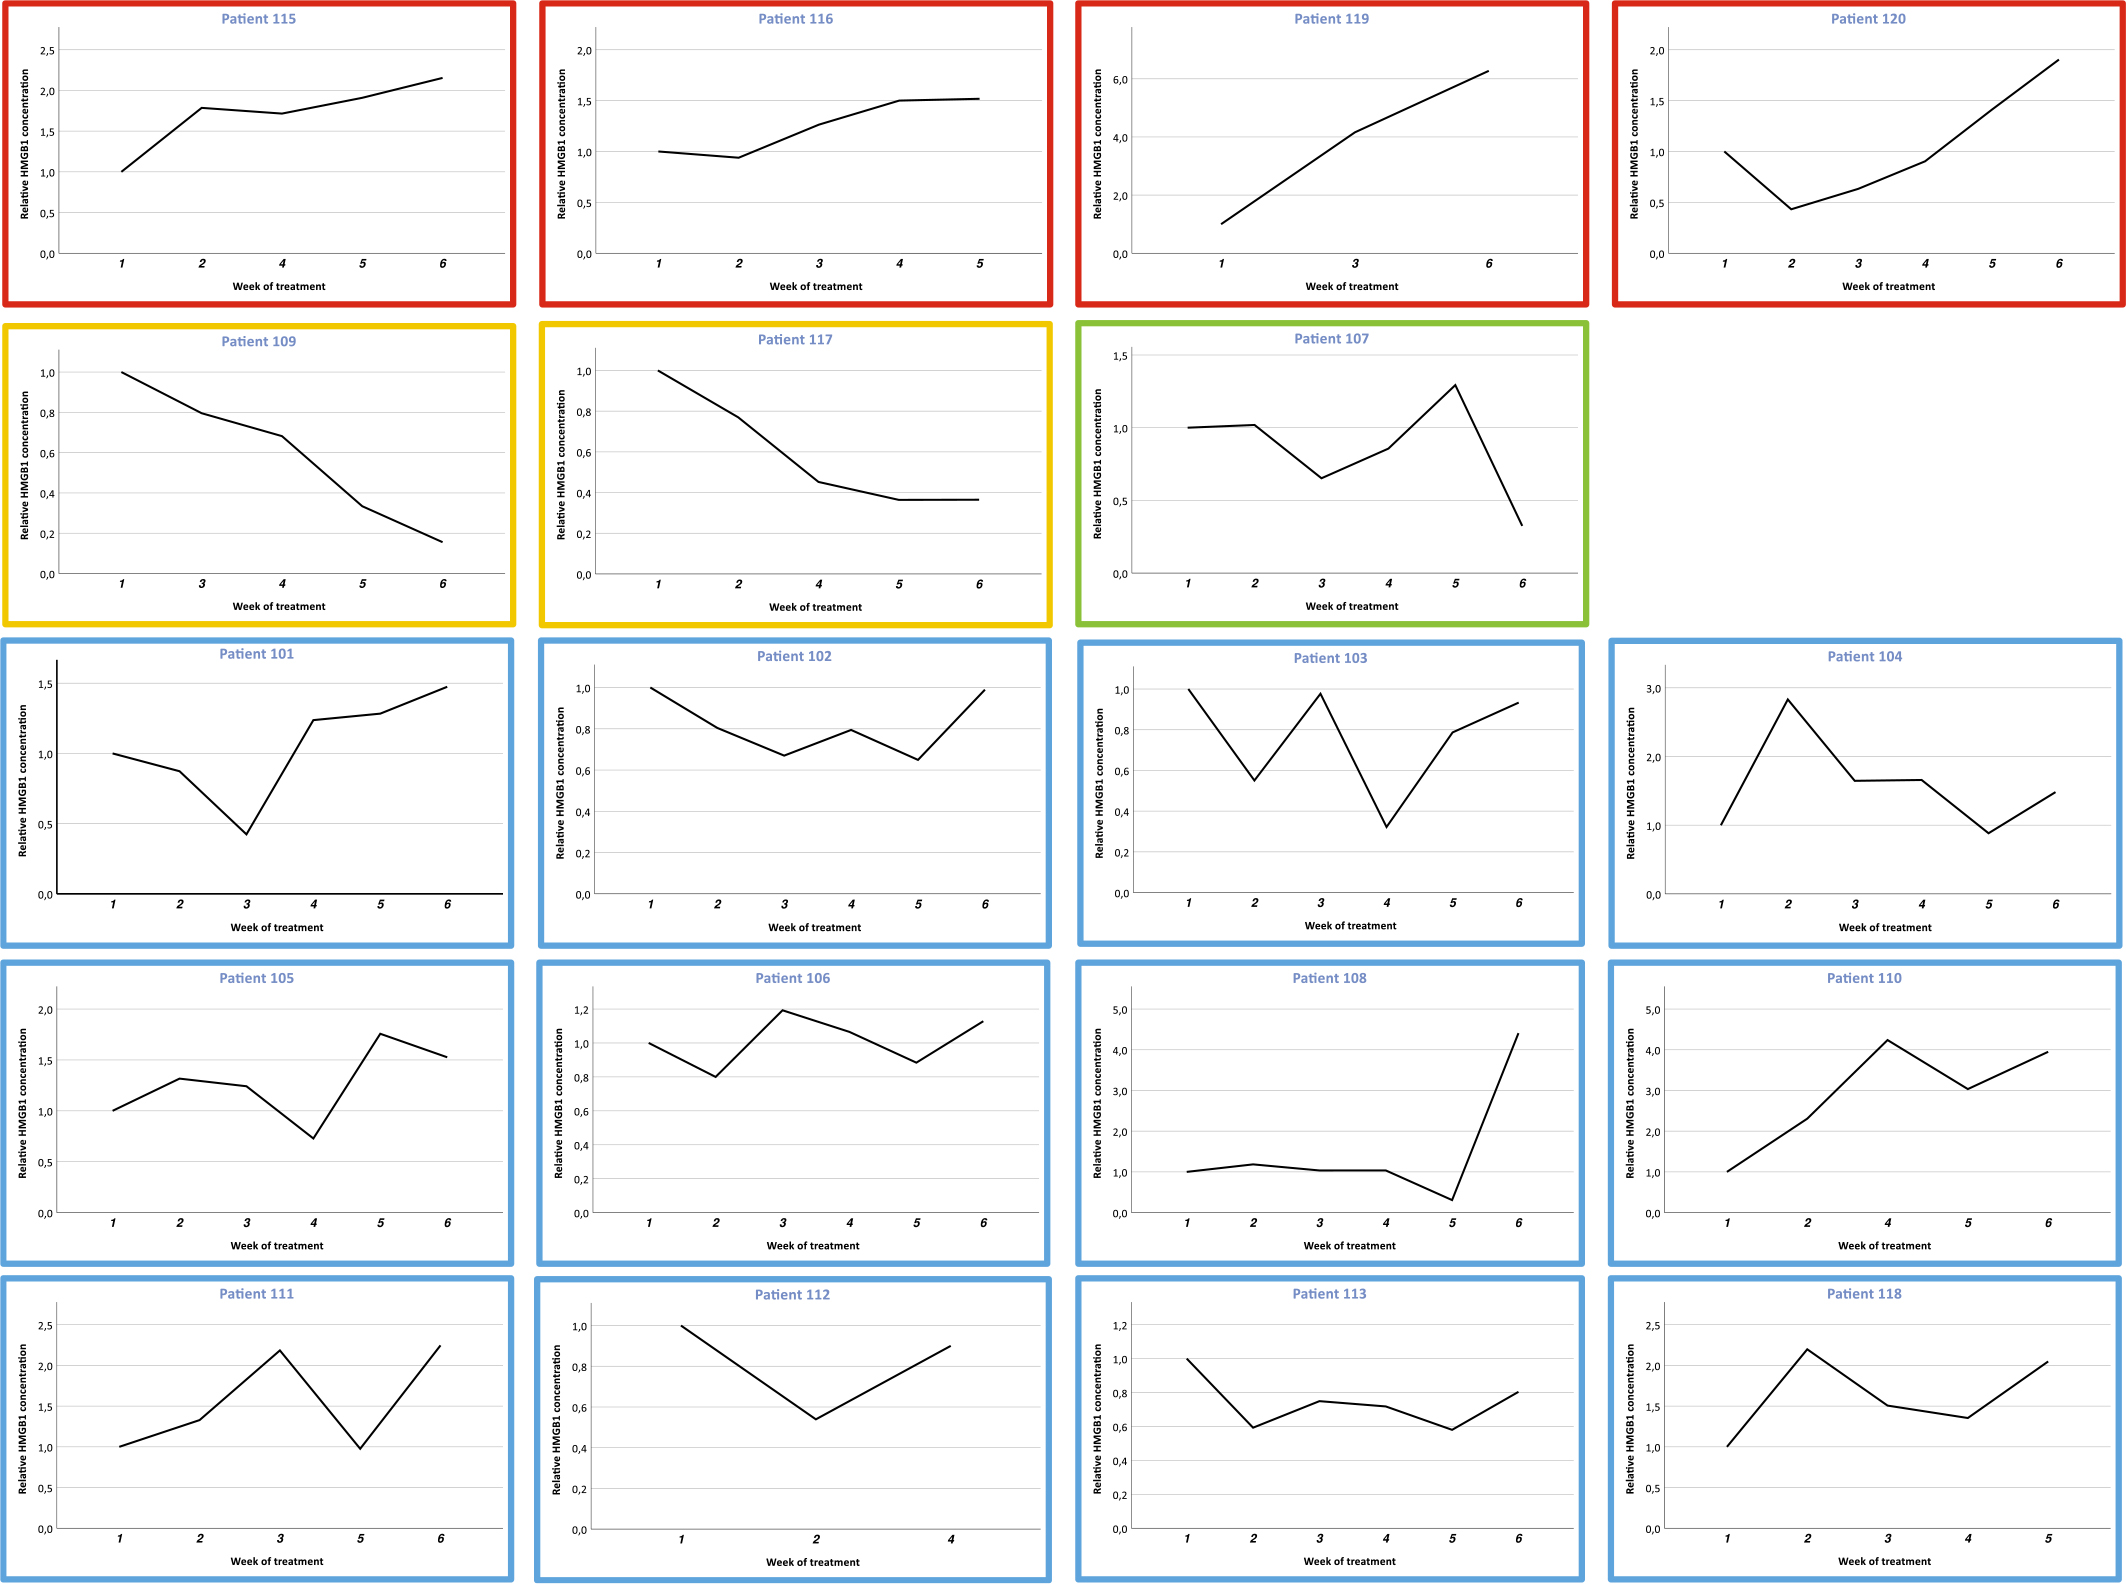
FIGURE 2.
Individual relative dynamics of High Mobility Group Box 1 (HMGB1; normalized to the initial concentration) during the course of neoadjuvant chemoradiotherapy. Four patients showed mainly ascending values of HMGB1 (indicated in red boxes), two patients had HMGB1 decline (yellow frame), one patient showed undulating levels but decline at the end of therapy (green) and several patients had undulating HMGB1 concentrations in the plasma with ascent towards the end of treatment (blue).
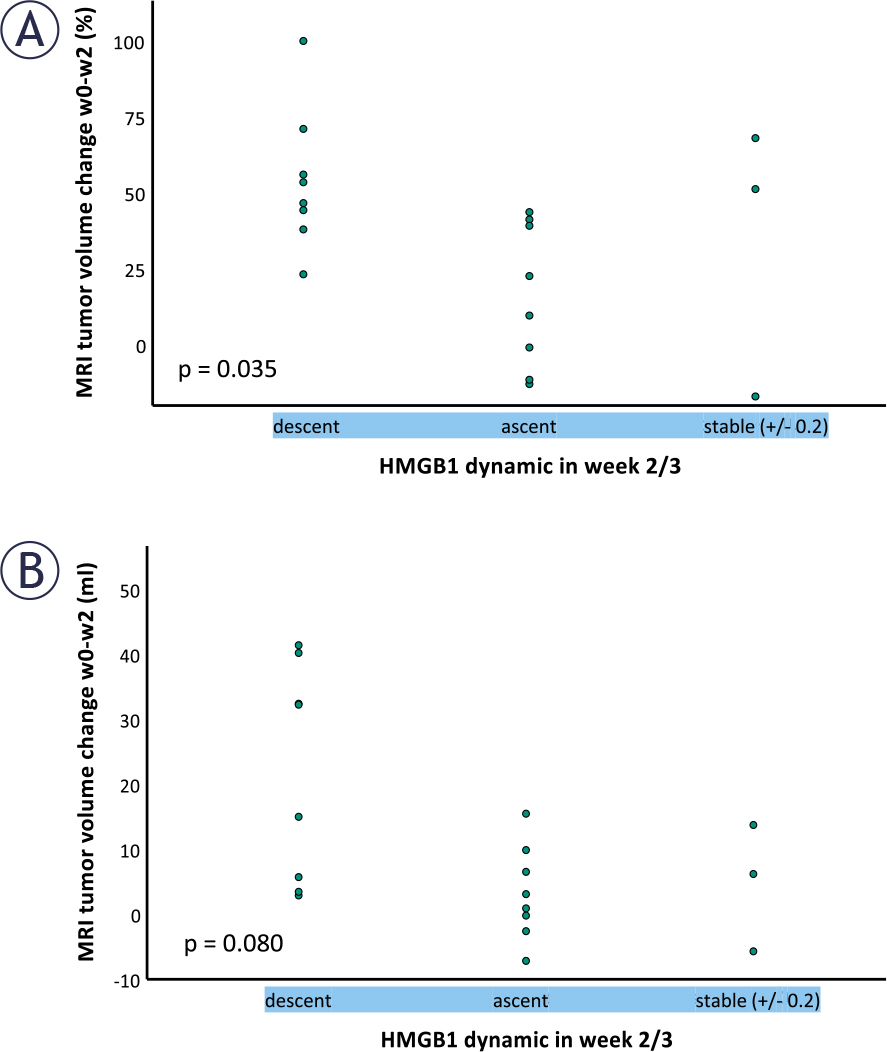
FIGURE 3.
The dynamics of High Mobility Group Box 1 (HMGB1) measures were compared to the corresponding magnetic resonance imaging (MRI) at the end of week 2 of neoadjuvant treatment. We evaluated dynamics at the beginning of week 3 or - if not available, considered week 2. Levels normalized to the pre-treatment concentrations were considered as “stable” if they were in the range of + / - 0.2. Patients with decline of HMGB1 values showed enhanced relative MRI tumor regression (%) (A) and a trend regarding absolute tumour volume decrease (B).