
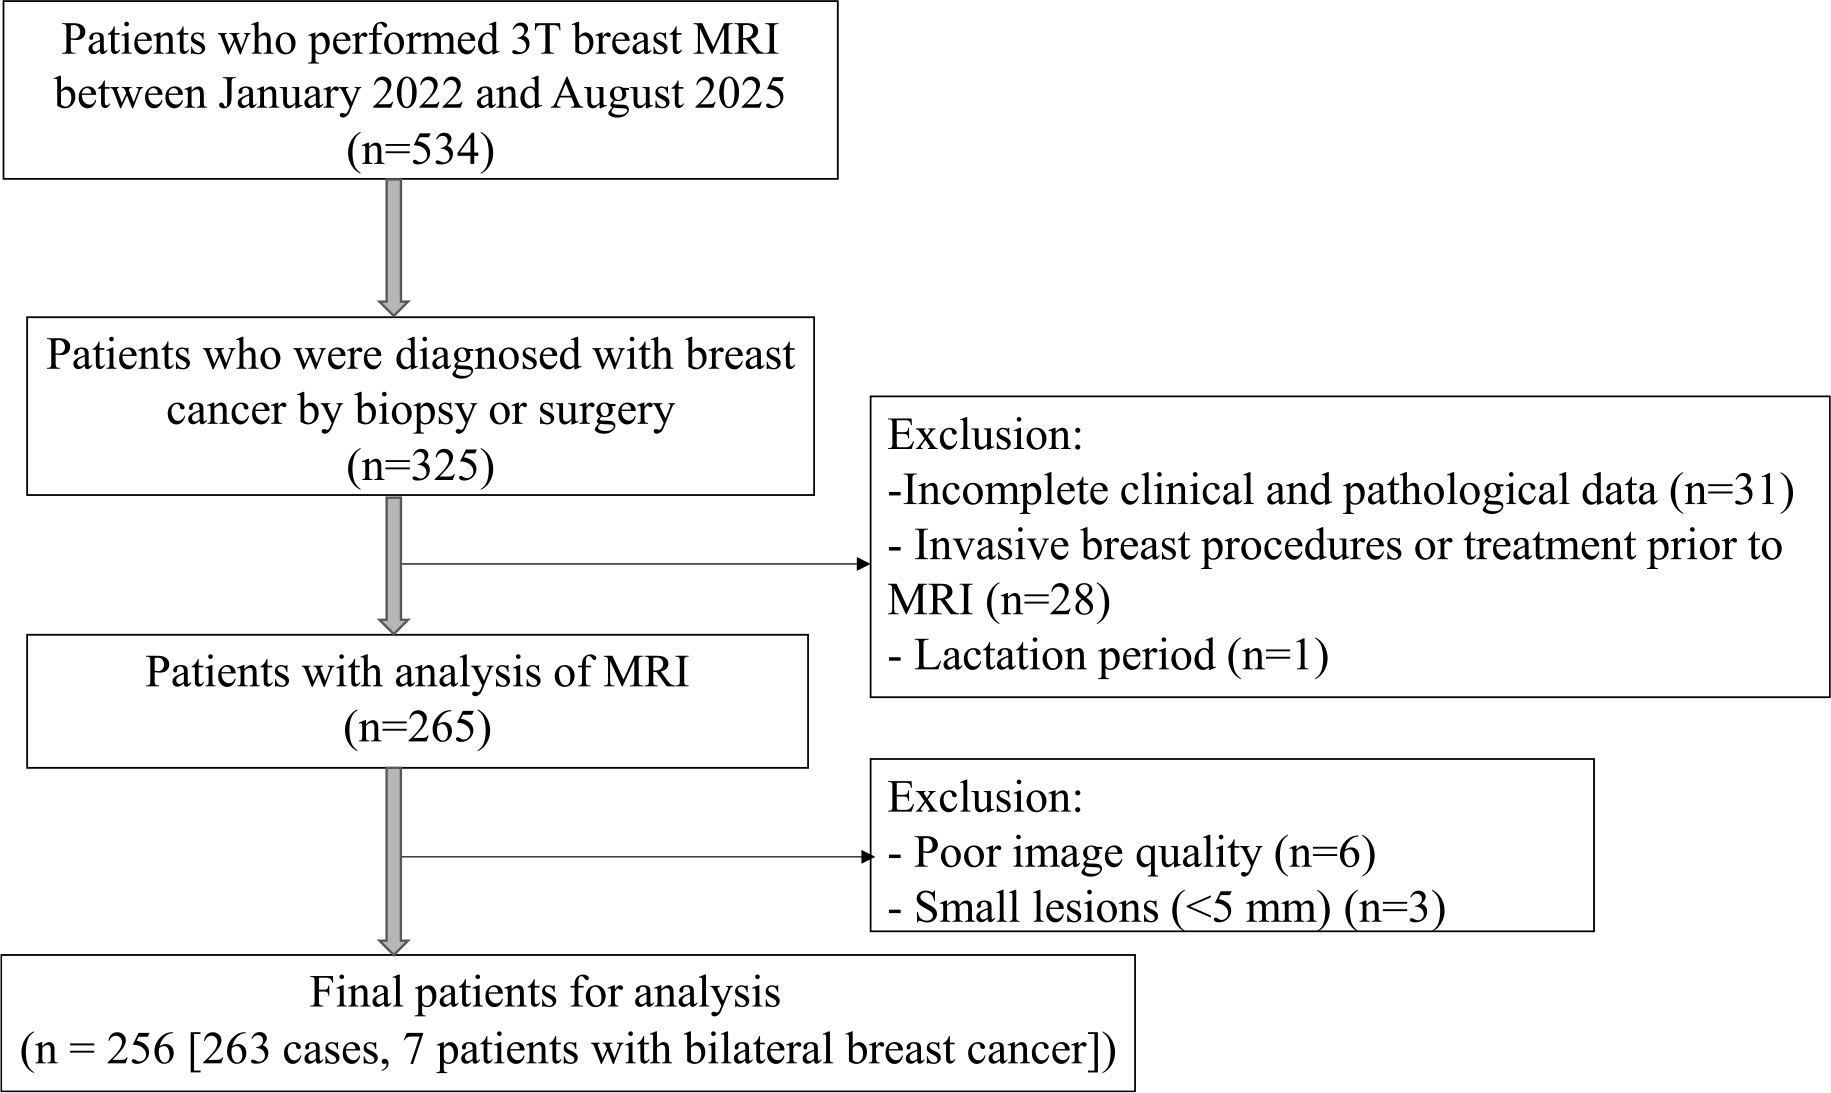
FIGURE 1.
Inclusion and exclusion criteria and the data collection flowchart showing the study population.
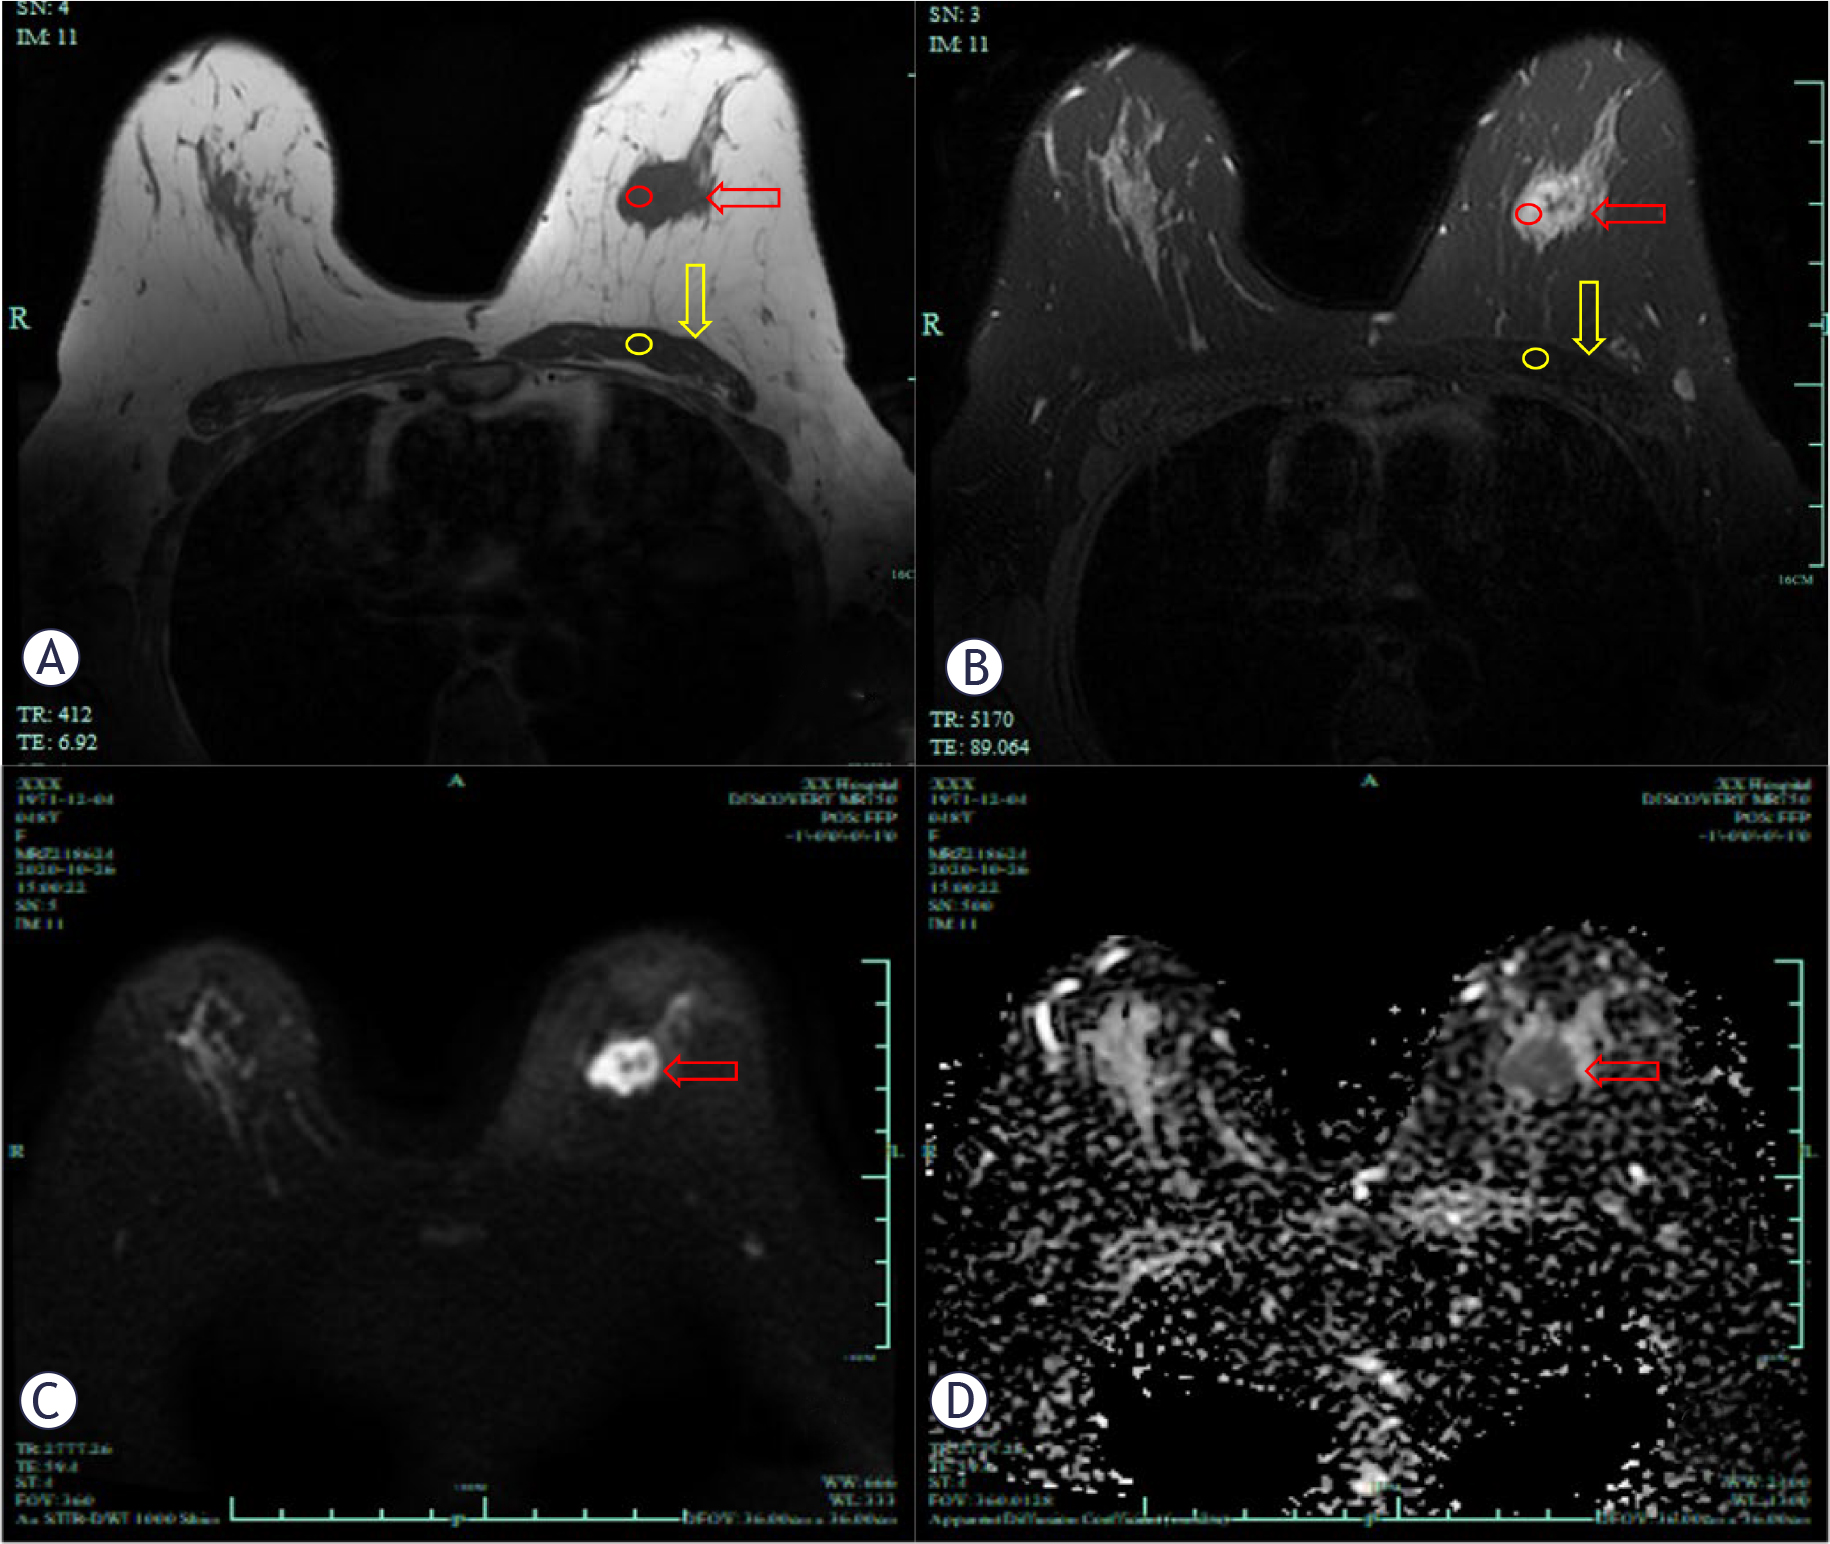
FIGURE 2.
MR images of a 48 years-old patient diagnosed with luminal B subtype breast cancer. T1 weight image (A), T2 fatsuppression sequence image (B), DWI image (C) and ADC map (D) was shown. T1 and T2 signal intensity ratio (A and B) were calculated by proportioning the average signal intensity of the lesion (red circle) to the average signal intensity of the pectoral muscle (yellow circle). Red arrows show the lesions and yellow arrows show the pectoral muscles.
ADC = apparent diffusion coefficient; DWI = diffusion-weighted imaging
TABLE 1.
Clinical characteristics of patients and MRI morphological features for different molecular subtypes
| Parameters | Luminal A (n = 52) | Luminal B (n = 135) | HER2-enriched (n = 31) | TN (n = 45) | p |
|---|---|---|---|---|---|
| ALNM | 0.010 | ||||
| Yes | 9 (17.3) | 58 (43.0) | 12 (38.7) | 14 (31.1) | |
| No | 43 (82.7) | 77 (57.0) | 19 (61.3) | 31 (68.9) | |
| History of hormone use | 0.038 | ||||
| Yes | 3 (5.8) | 2 (1.5) | 3 (9.7) | 0 (0.0) | |
| No | 49 (94.2) | 133 (98.5) | 28 (90.3) | 45 (100.0) | |
| Tumor morphology | 0.053 | ||||
| Mass | 43 (82.7) | 114 (84.4) | 20 (64.5) | 39 (86.7) | |
| Non-mass | 9 (17.3) | 21 (15.6) | 11 (35.5) | 6 (13.3) | |
| Margin | 0.206 | ||||
| Circumscribed | 21 (40.4) | 39 (28.9) | 13 (41.9) | 19 (42.2) | |
| Not-circumscribed | 31 (59.6) | 96 (71.1) | 18 (58.1) | 26 (57.8) | |
| Dynamic curve curve | 0.248 | ||||
| type I | 8 (15.4) | 13 (9.6) | 4 (12.9) | 7 (15.6) | |
| type II | 9 (17.3) | 30 (22.2) | 12 (38.7) | 8 (17.8) | |
| type III | 35 (67.3) | 92 (68.1) | 15 (48.4) | 30 (66.7) |
TABLE 2.
Intraclass correlation coefficient (ICC) analysis between the two readers
| Parameters | ICC (95%CI) |
|---|---|
| T1 SIR | 0.970 (0.961–0.976) |
| T2 SIR | 0.967 (0.957–0.974) |
| Mean ADC (×10−3 mm2/s) | 0.898 (0.871–0.919) |
| Tumor diameter (cm) | 0.923 (0.900–0.940) |
TABLE 3.
MRI quantitative parameters for molecular subtypes of breast cancer
| Parameters | Luminal A (n = 52) | Luminal B (n = 135) | HER2-enriched (n = 31) | TNBC (n = 45) | p |
|---|---|---|---|---|---|
| T1 SIR | 1.318 (1.179–1.630) | 1.366 (1.209–1.620) | 1.515 (1.268–1.788) | 1.254 (1.141–1.401) | 0.026 |
| T2 SIR | 3.137±1.156 | 3.163±1.186 | 3.280±1.289 | 3.689±1.093 | 0.009 |
| Mean ADC (×10−3 mm2/s) | 1.037±0.291 | 0.912±0.211 | 1.102±0.297 | 0.900±0.164 | 0.000 |
| Tumor diameter (cm) | 1.200 (0.887–1.762) | 1.900 (1.325–2.725) | 1.150 (0.600–2.750) | 2.550 (1.700–3.750) | 0.000 |
TABLE 4.
ROC analysis of MRI quantitative parameters for separating one subtype from all other subtypes
| Parameters | AUC | Cutoff value | Sensitivity (%) | Specificity (%) | p* |
|---|---|---|---|---|---|
| Luminal A vs. all others | |||||
| T1 SIR | 0.506 | ≤ 1.270 | 46.15 (40.1, 52.2) | 61.61 (55.7, 67.5) | 0.640 |
| T2 SIR | 0.550 | ≤ 3.000 | 59.62 (53.7, 65.6) | 54.50 (48.5, 60.5) | 0.397 |
| Mean ADC (×10−3 mm2/s) | 0.612 | > 0.980 | 46.15 (40.3, 52.0) | 70.62 (65.3, 76.0) | 0.022 |
| Tumor diameter(cm) | 0.768 | ≤l.900 | 80.00 (73.1, 86.9) | 64.2 (57.0, 71.4) | 0.016 |
| Luminal B vs. all others | |||||
| T1 SIR | 0.510 | >1.291 | 62.96 (56.2, 69.7) | 48.44 (41.7, 55.2) | 0.181 |
| T2 SIR | 0.563 | ≤ 3.298 | 65.93 (59.6, 72.3) | 45.31 (38.6, 52.0) | 0.169 |
| Mean ADC (×10−3 mm2/s) | 0.624 | ≤ 0.978 | 77.78 (71.6, 84.0) | 44.53 (37.8, 51.3) | 0.012 |
| Tumor diameter(cm) | 0.540 | >1.550 | 78.63 (71.7, 85.6) | 35.58 (28.2, 42.9) | 0.829 |
| HER2-enriched vs. all others | |||||
| T1 SIR | 0.631 | > 1.503 | 58.06 (50.3, 65.8) | 69.40 (61.9, 76.9) | 0.000 |
| T2 SIR | 0.517 | > 2.815 | 67.74 (60.0, 75.5) | 44.40 (36.6, 52.2) | 0.927 |
| Mean ADC (×10−3 mm2/s) | 0.713 | > 0.903 | 87.10 (81.5, 92.7) | 53.02 (45.1, 60.9) | 0.002 |
| Tumor diameter(cm) | 0.543 | > 2.190 | 60.00 (52.4, 67.6) | 60.20 (52.6, 67.8) | 0.697 |
| TN vs. all others | |||||
| T1 SIR | 0.608 | ≤ 1.286 | 64.44 (58.6, 70.2) | 62.84 (57.0, 68.7) | 0.176 |
| T2 SIR | 0.655 | >3.157 | 68.89 (61.8, 76.0) | 59.63 (51.9, 67.4) | 0.020 |
| Mean ADC (×10−3 mm2/s) | 0.562 | ≤ 0.869 | 51.11 (44.1, 58.1) | 62.39 (54.9, 69.9) | 0.087 |
| Tumor diameter(cm) | 0.706 | >2.050 | 74.36(65.3, 83.4) | 57.69 (49.3, 66.1) | 0.040 |
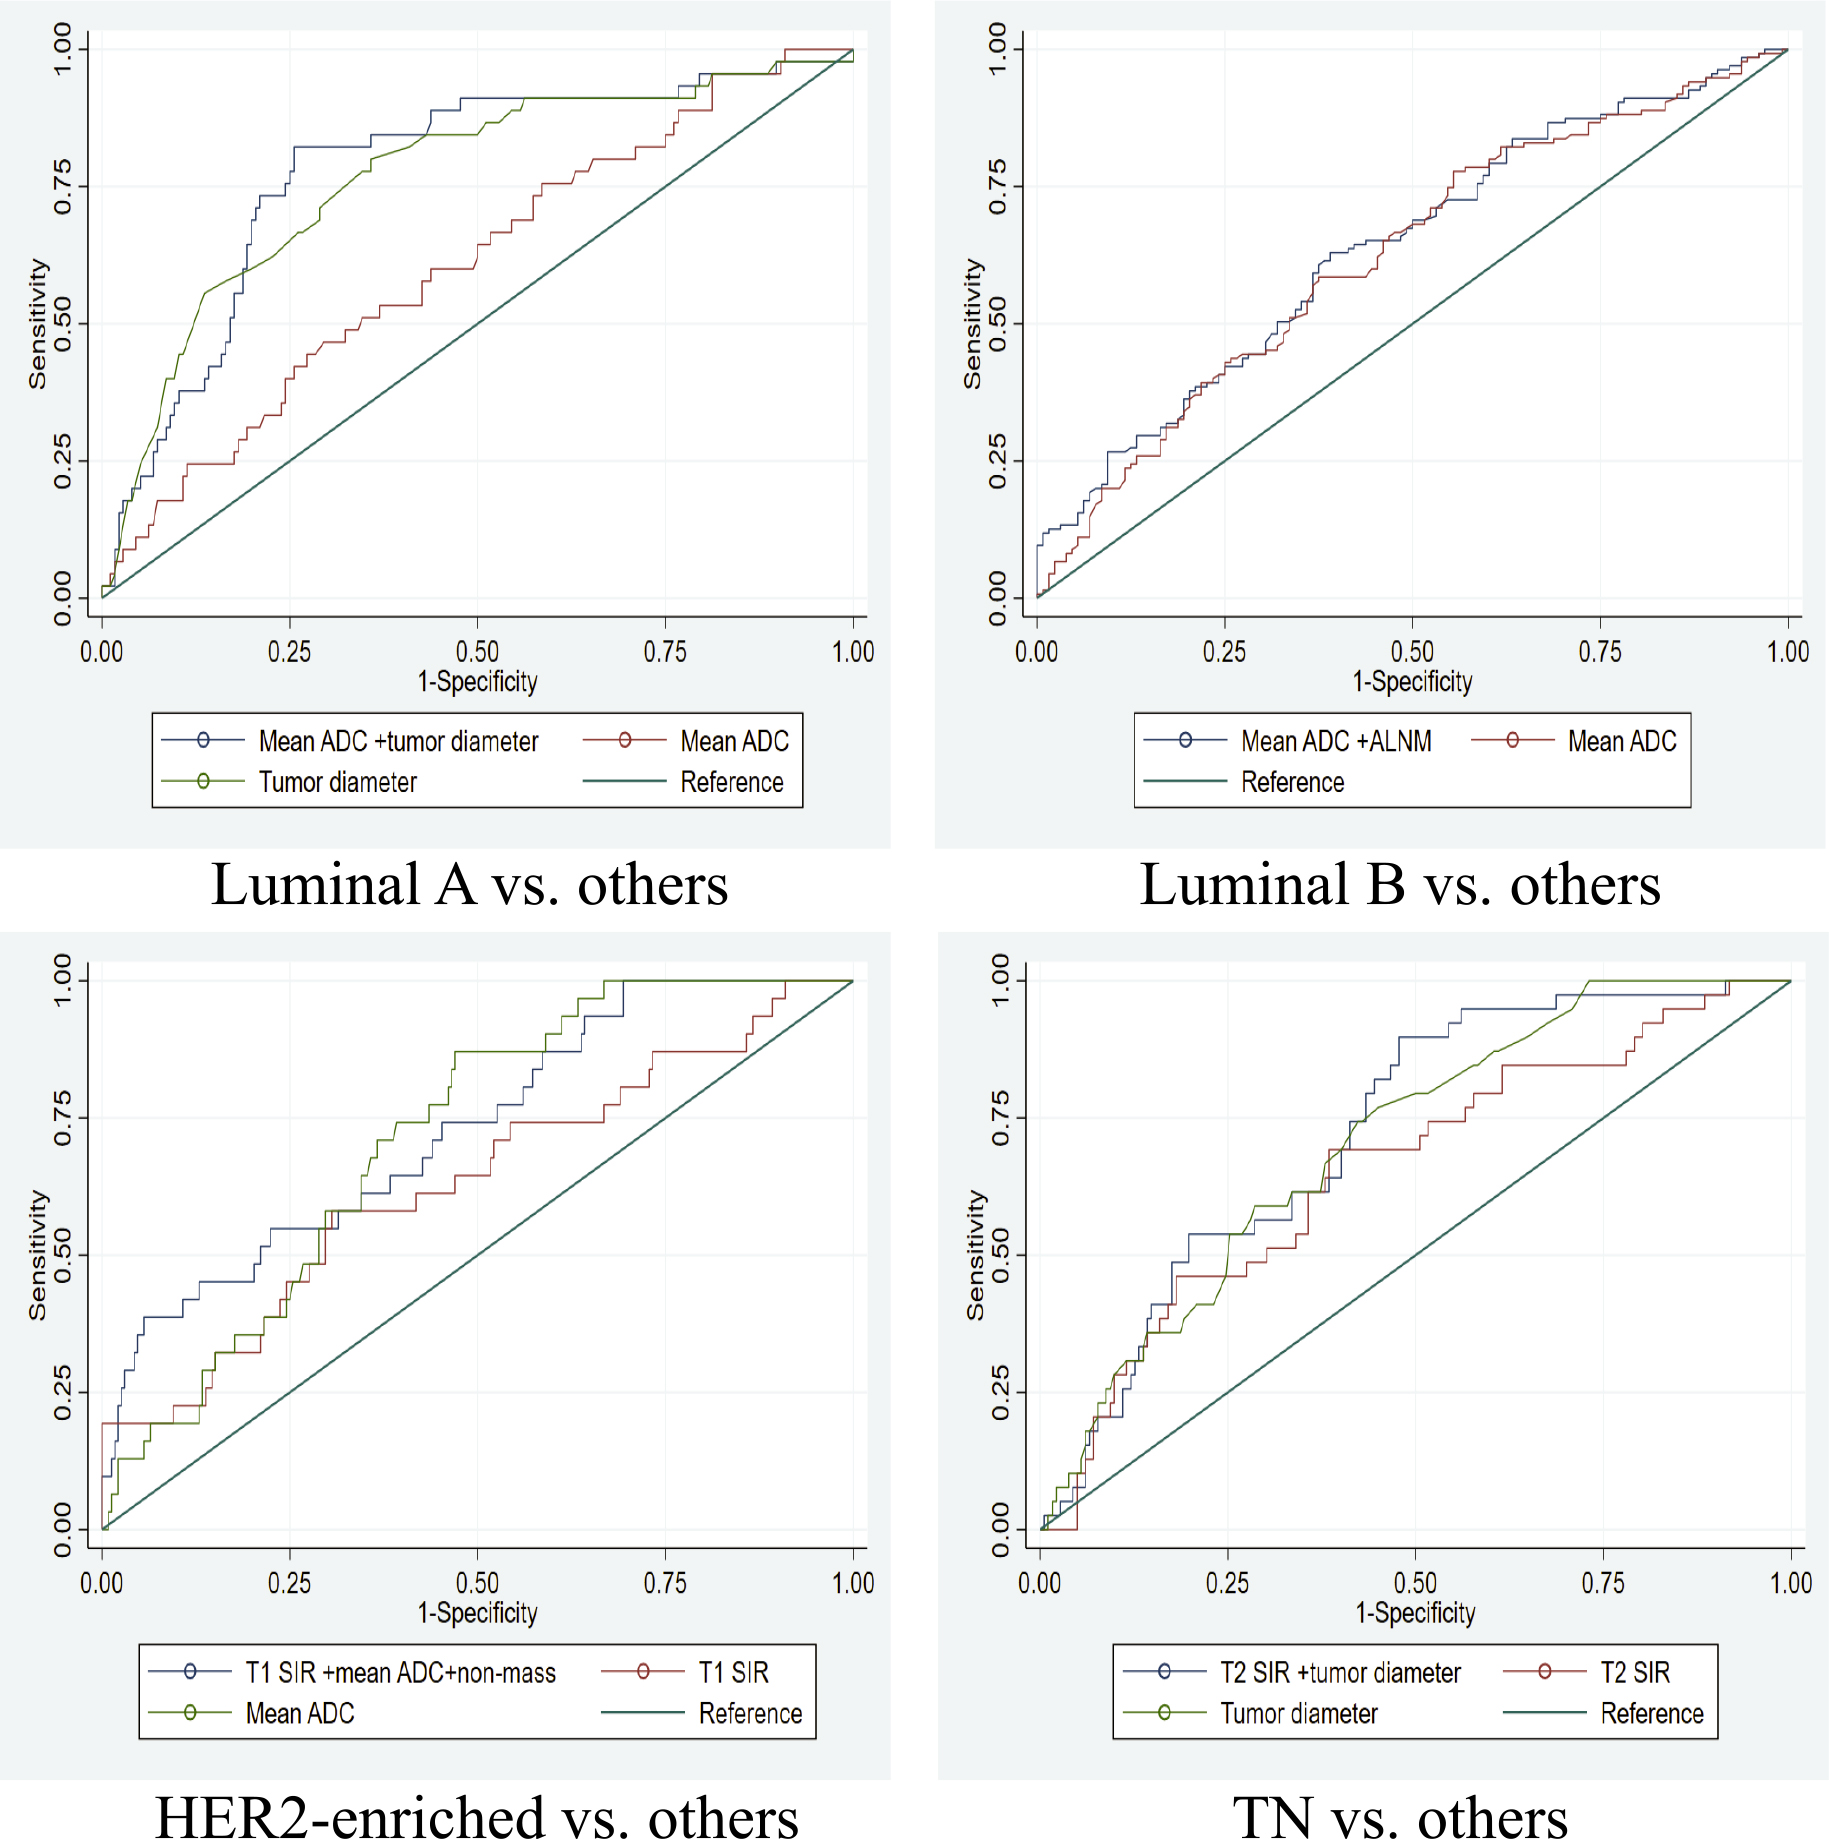
FIGURE 3.
The comparison of receiver operating characteristic (ROC) curve of single and combined parameters for distinguishing one subtype from all other subtypes.
ADC = apparent diffusion coefficient; ALNM = axillary lymph node metastasis; TN: triple-negative; T1 SIR = T1 signal intensity ratio; T2 SIR = T2 signal intensity ratio
TABLE 5.
ROC analysis of combined parameters for separating one subtype from all other subtypes
| AUC | Sensitivity (%) | Specificity (%) | p | |
|---|---|---|---|---|
| Luminal A vs. all others | ||||
| Mean ADC+ tumor diameter | 0.781 | 82.22 (76.57, 87.87) | 74.43 (68.99, 79.87) | < 0.001 |
| Luminal B vs. all others | ||||
| Mean ADC+ALNM | 0.639 | 62.96 (57.12, 68.80) | 60.94 (55.04, 66.84) | < 0.001 |
| HER2-enriched vs. all others | ||||
| T1 SIR + mean ADC+ non-mass | 0.728 | 38.71(21.56, 55.86) | 94.4(91.44, 97.36) | < 0.001 |
| TN vs. all others | ||||
| T2SIR+ tumor diameter | 0.724 | 89.74 (85.64, 93.84) | 52.20 (45.68, 58.72) | 0.002 |