
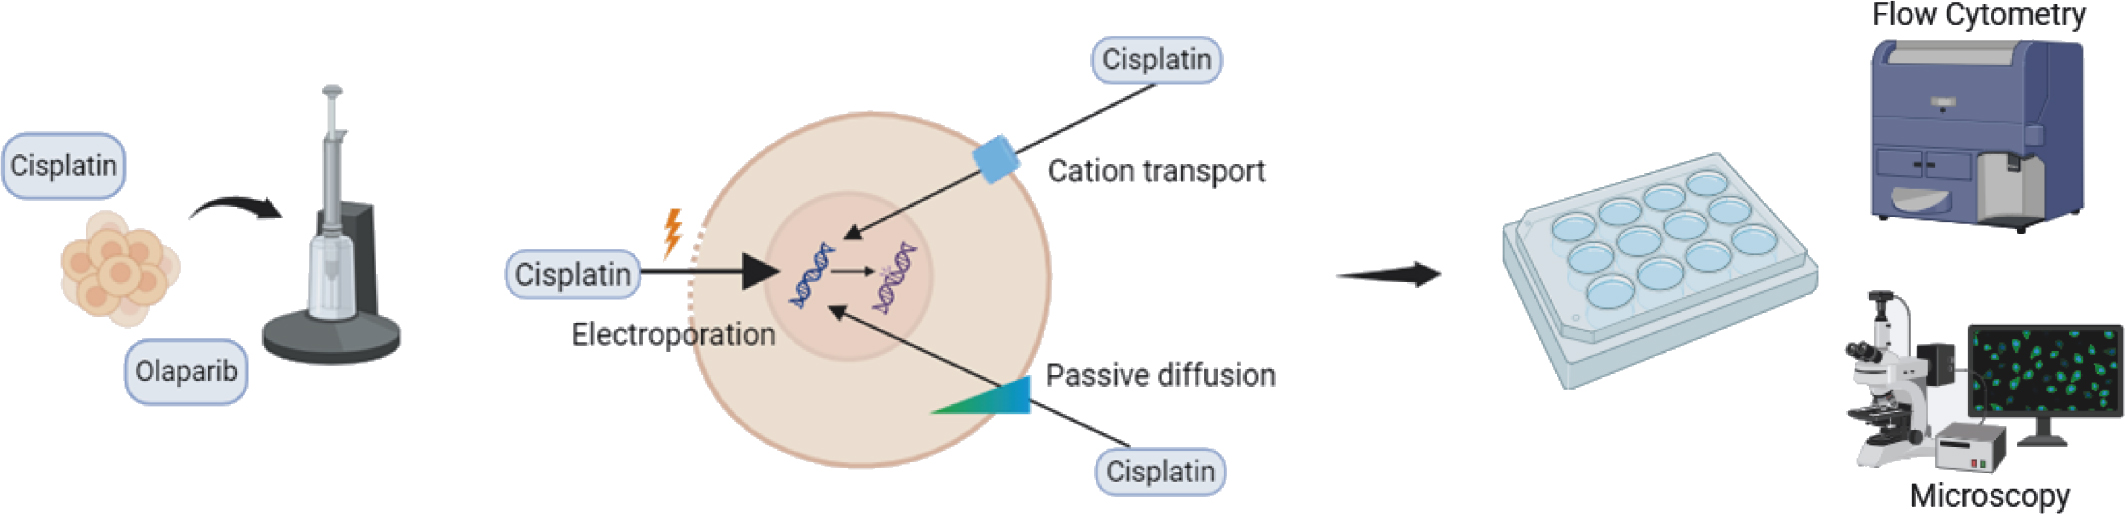
FIGURE 1.
Overview of the study design. Electroporation was modelled using the Neon Transfection system (left). Cell suspensions were electroporated in the presence of cisplatin and olaparib treatment. The mechanism of electrochemotherapy (centre): electroporation increases intracellular cisplatin levels by reversibly permeabilising the cell plasma membrane. Following treatment, cells were assayed using flow cytometry and immunofluorescence microscopy (right). Figure was created in BioRender (www.biorender.com).
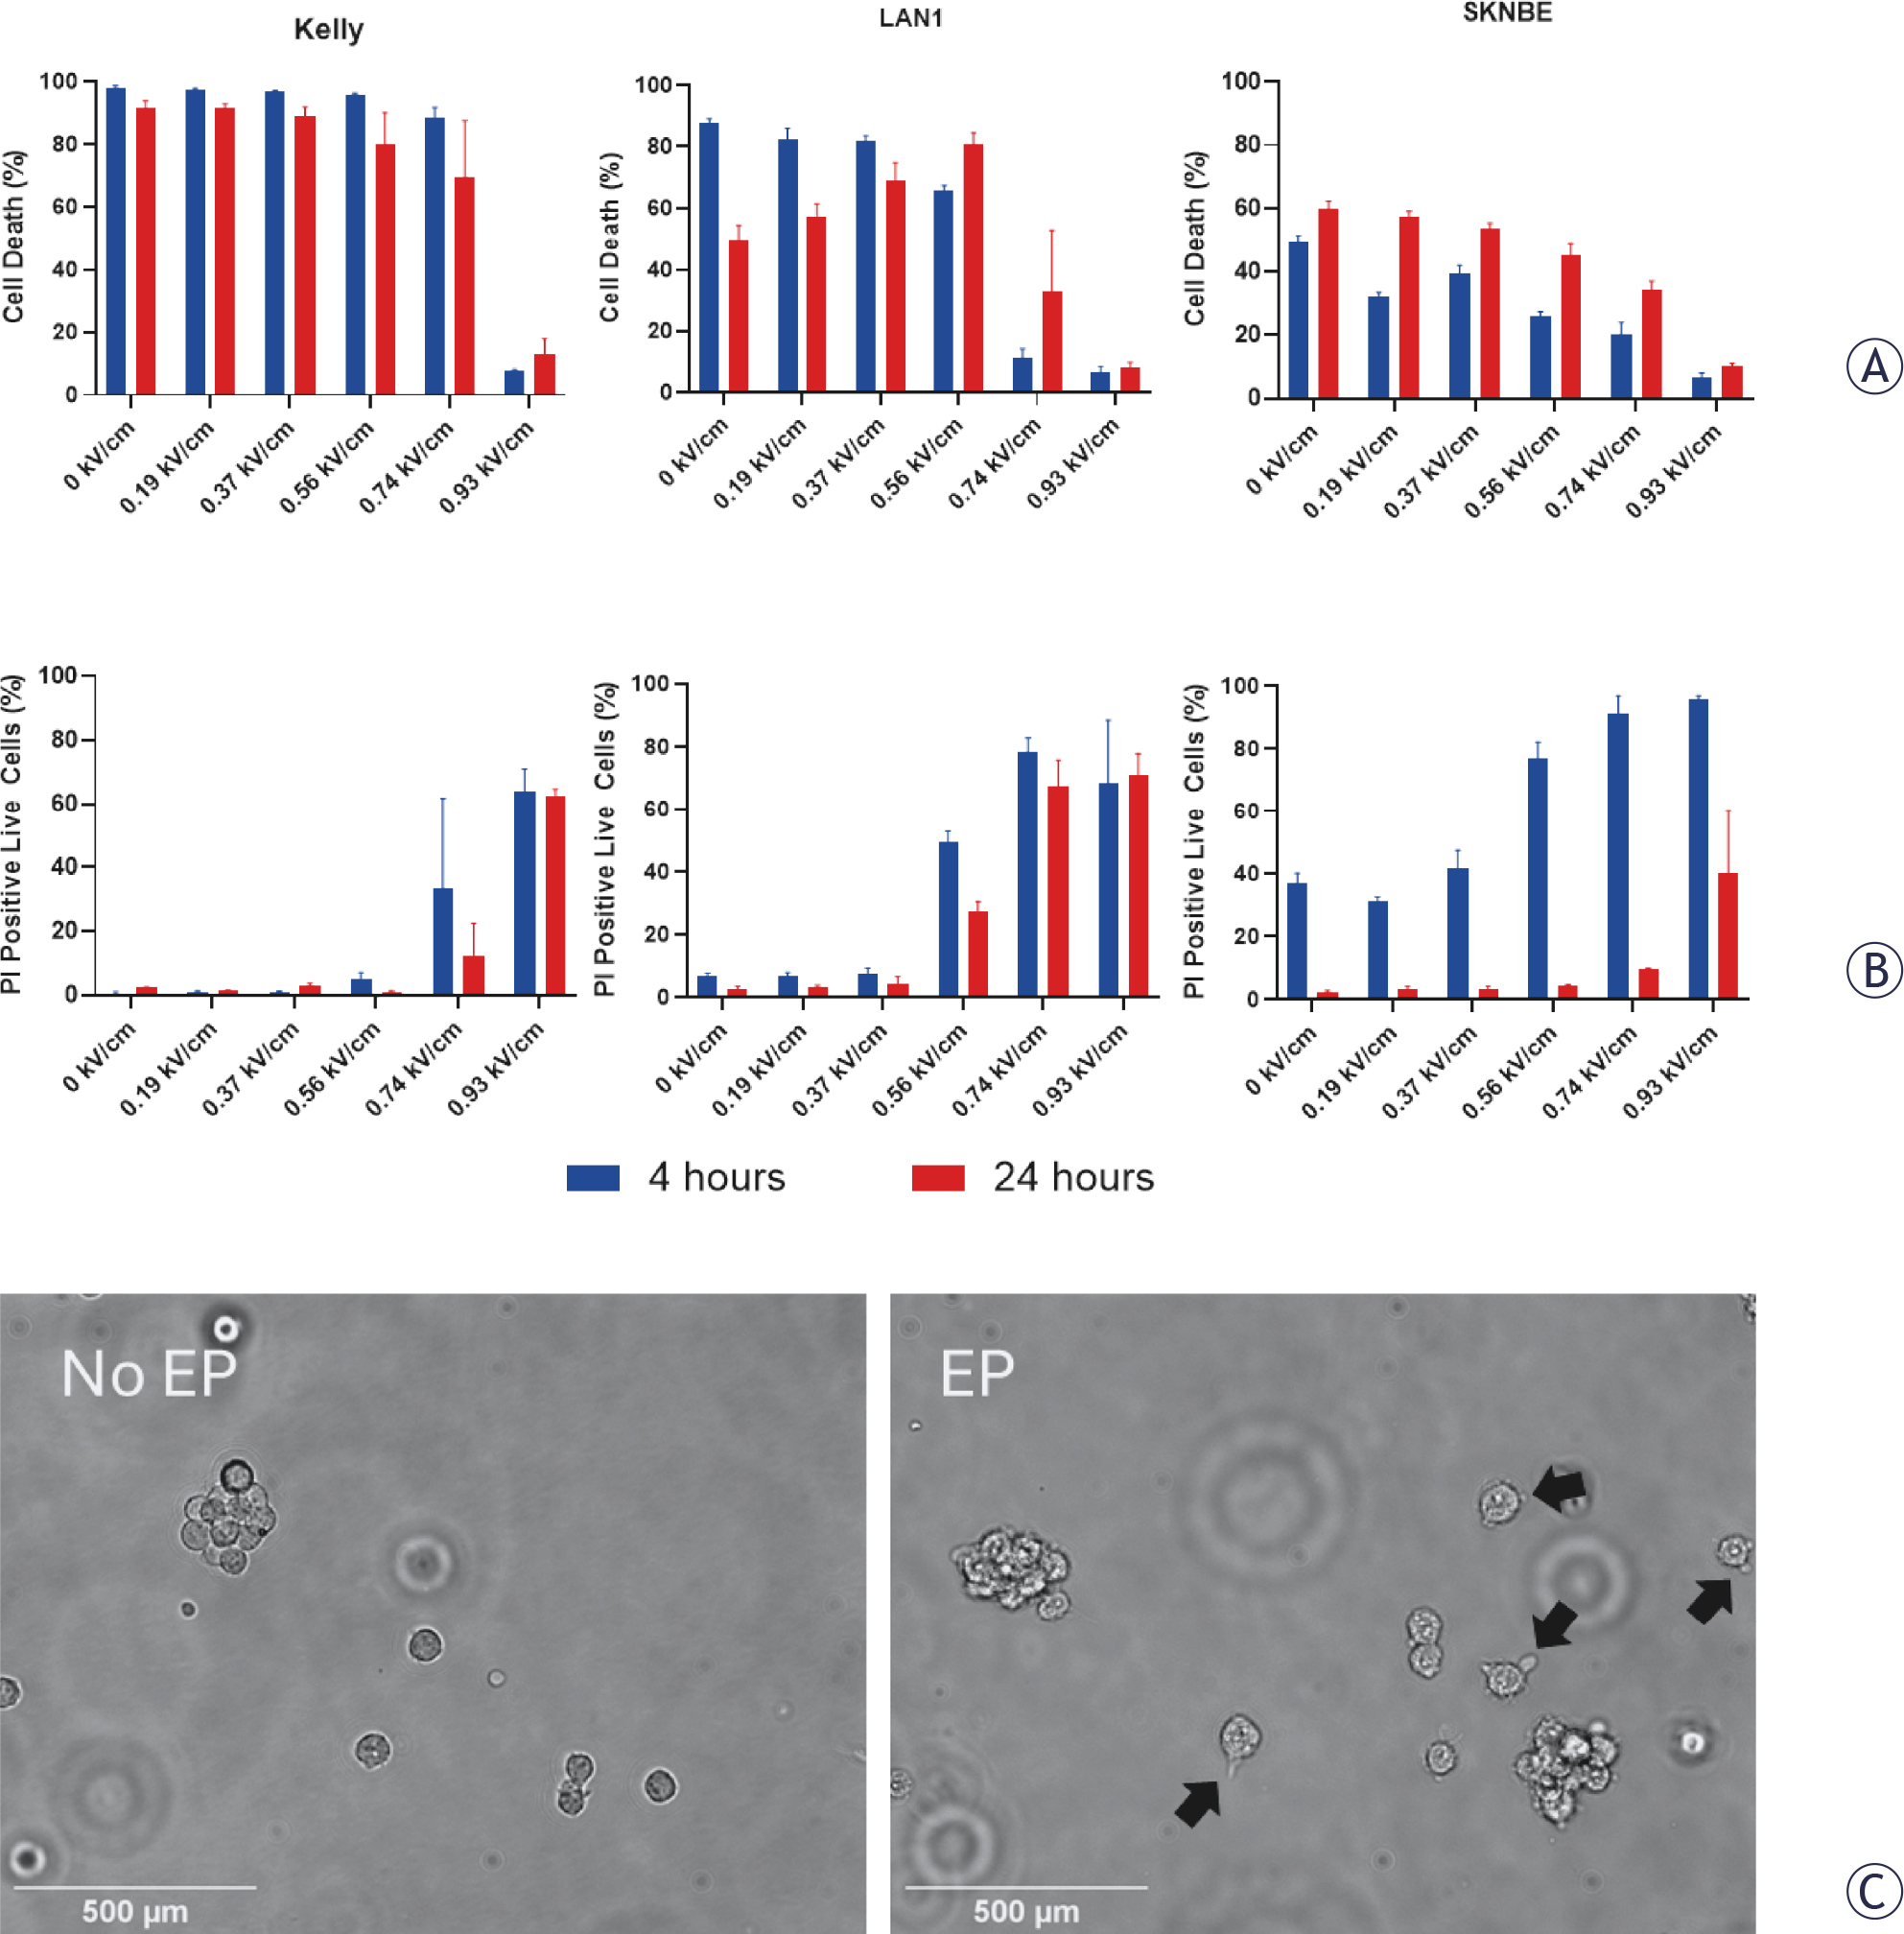
FIGURE 2.
Electroporation (EP) increases neuroblastoma cell permeability. (A) Across three neuroblastoma cell lines (KELLY, LAN-1 and SK-N-BE) electroporation at increasing electric field strengths (0 - 0.93 kV/cm) increased cell death at immediate (4 hour, blue) and 24-hour (red) timepoints. (B) Increasing electric field strengths (0 - 0.93 kV/cm) increased cell permeability to propidium iodide (PI). (C) Representative images of LAN-1 cells in suspension before and after electroporation (0.93 kV/cm) showing blebs forming on the cell membrane (black arrows). Data are presented as mean ± standard deviation. Scale bars 500 μm.
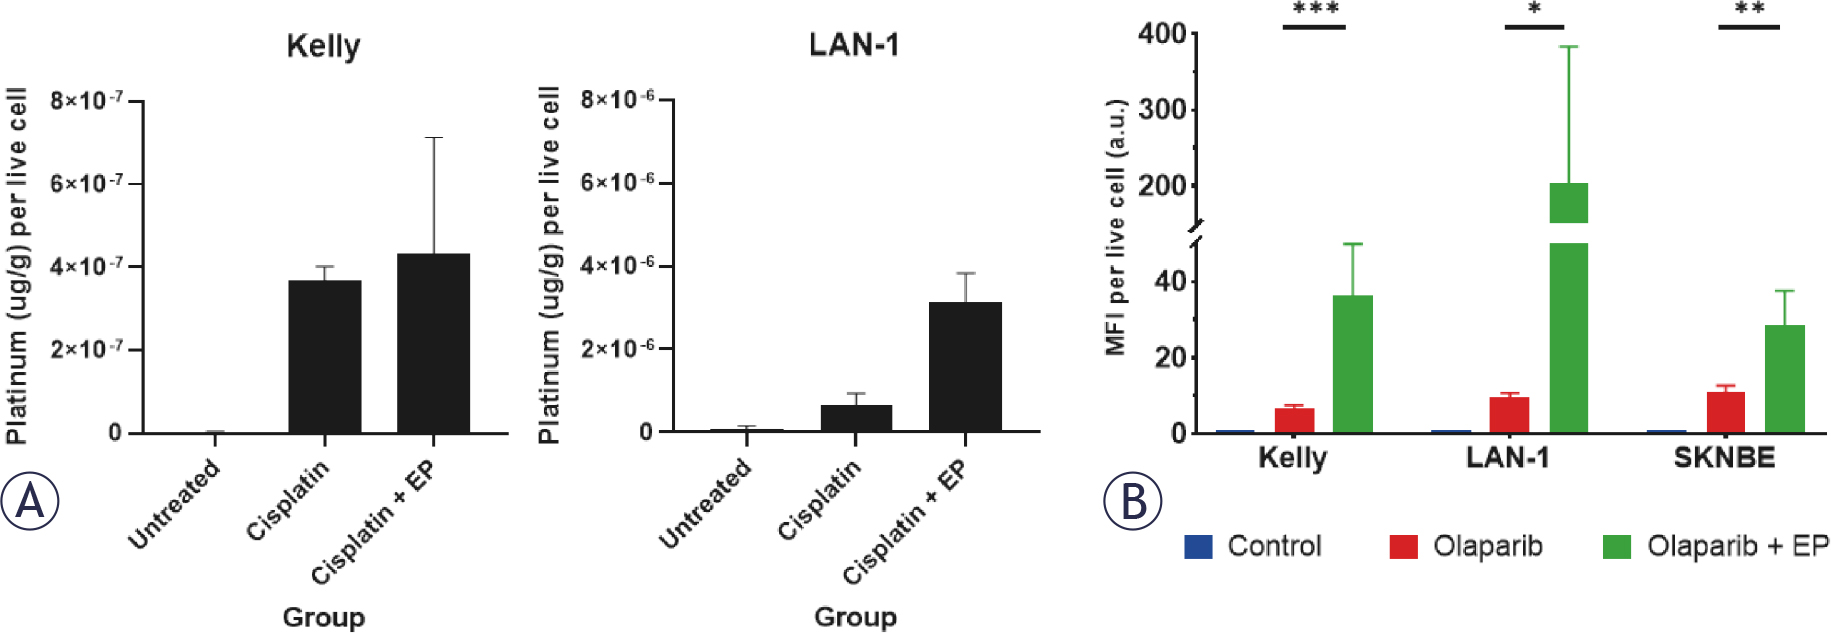
FIGURE 3.
(A) Electroporation (EP, 0.74 kV/cm) with cisplatin (10 μM) increases intracellular platinum content (μg/g) versus treatment with cisplatin alone in KELLY and LAN-1 cells. Untreated cells received no cisplatin. (B) Electroporation (0.74 kV/cm) with a fluorescent-labelled olaparib (5 μM) compared to treatment with the fluorescent-labelled olaparib alone significantly increases fluorescence intensity per live cell in KELLY, LAN-1 and SK-N-BE cells. Data are presented as mean ± standard deviation. Statistical comparison by one-way ANOVA with Tukey’s post-hoc test. * p <0.05; ** p <0.01; *** p <0.001.
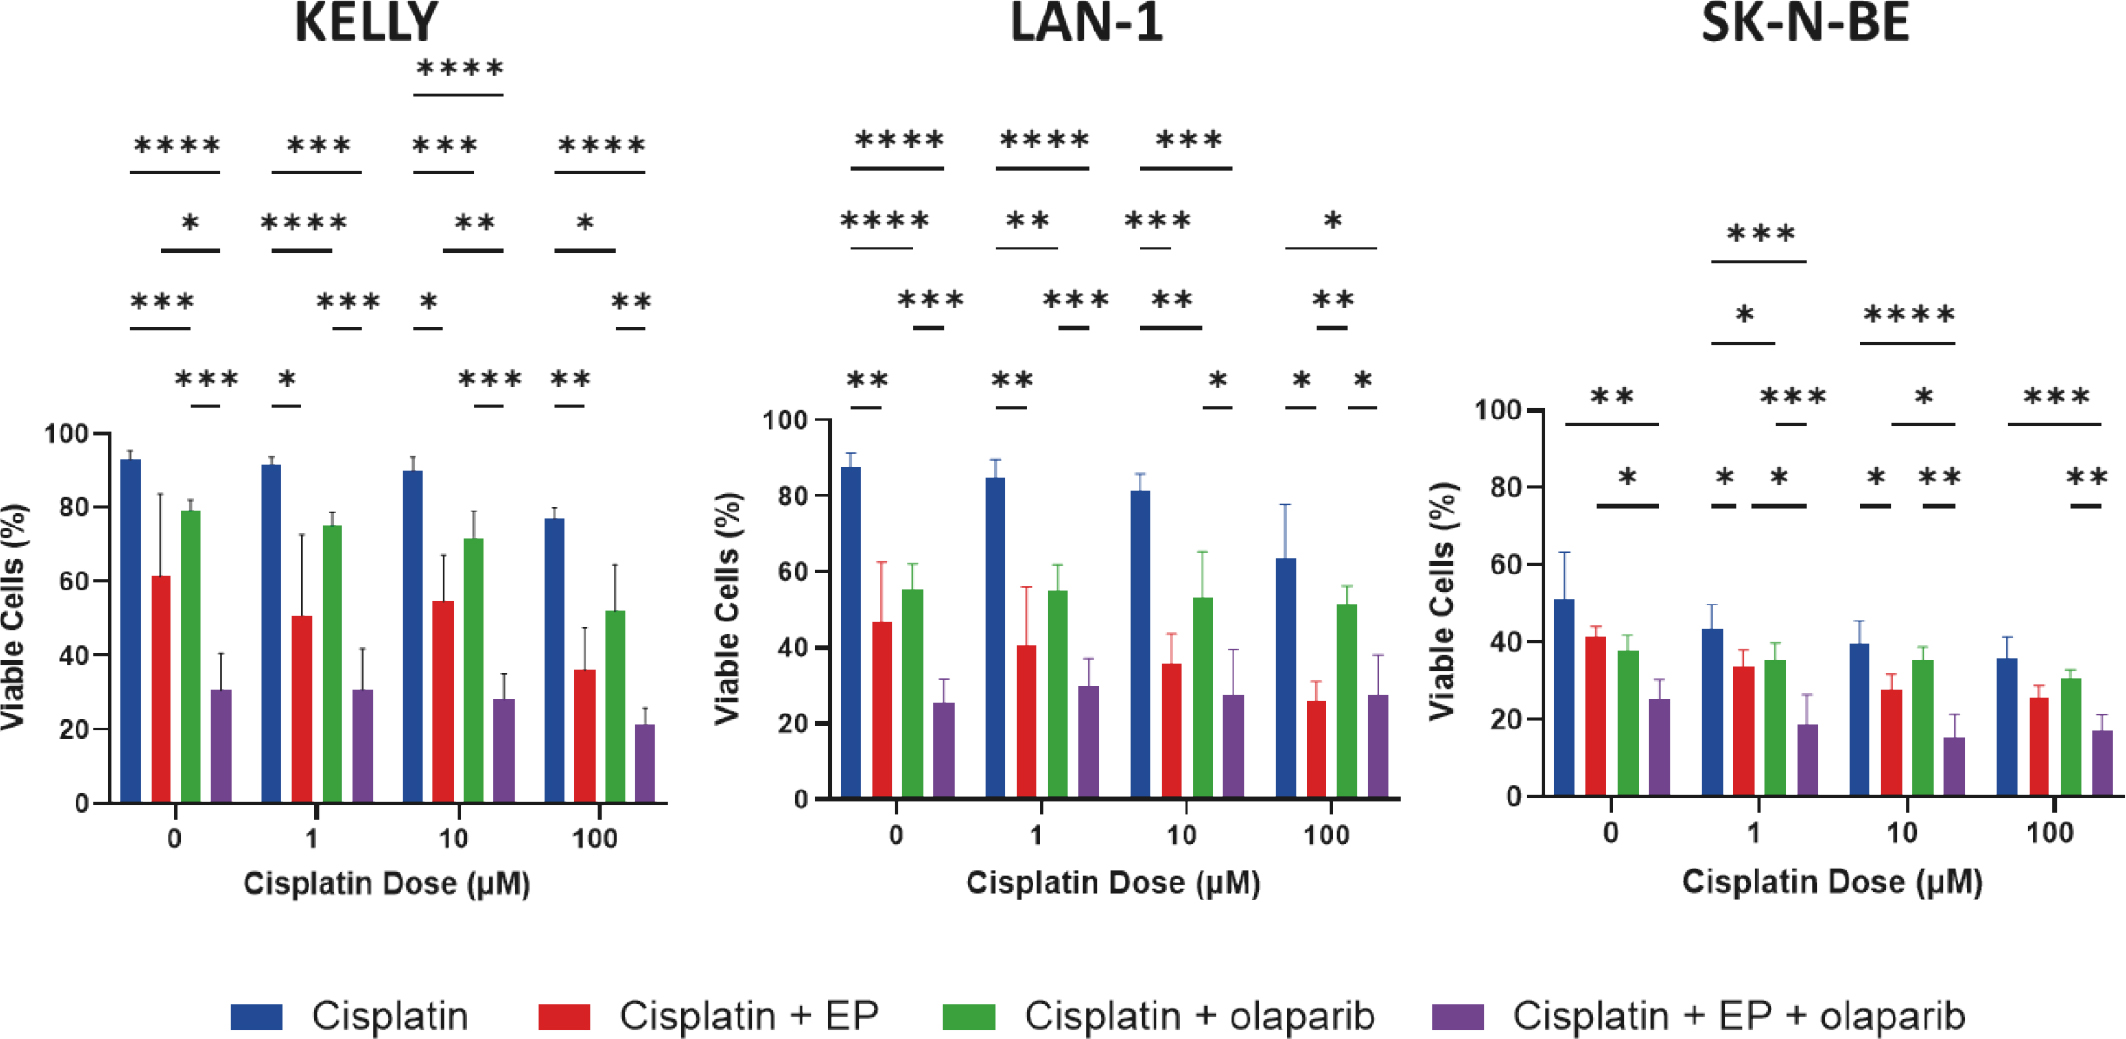
FIGURE 4.
Electroporation (EP, 0.74 kV/cm) with cisplatin is significantly more effective than cisplatin alone at killing neuroblastoma cell lines (KELLY, LAN-1 and SK-N-BE). The addition of olaparib increases toxicity. Data are presented as mean ± standard deviation. Statistical comparison by one-way ANOVA with Tukey’s post-hoc test. *p <0.05; **p <0.01; *** p <0.001; **** p <0.0001.
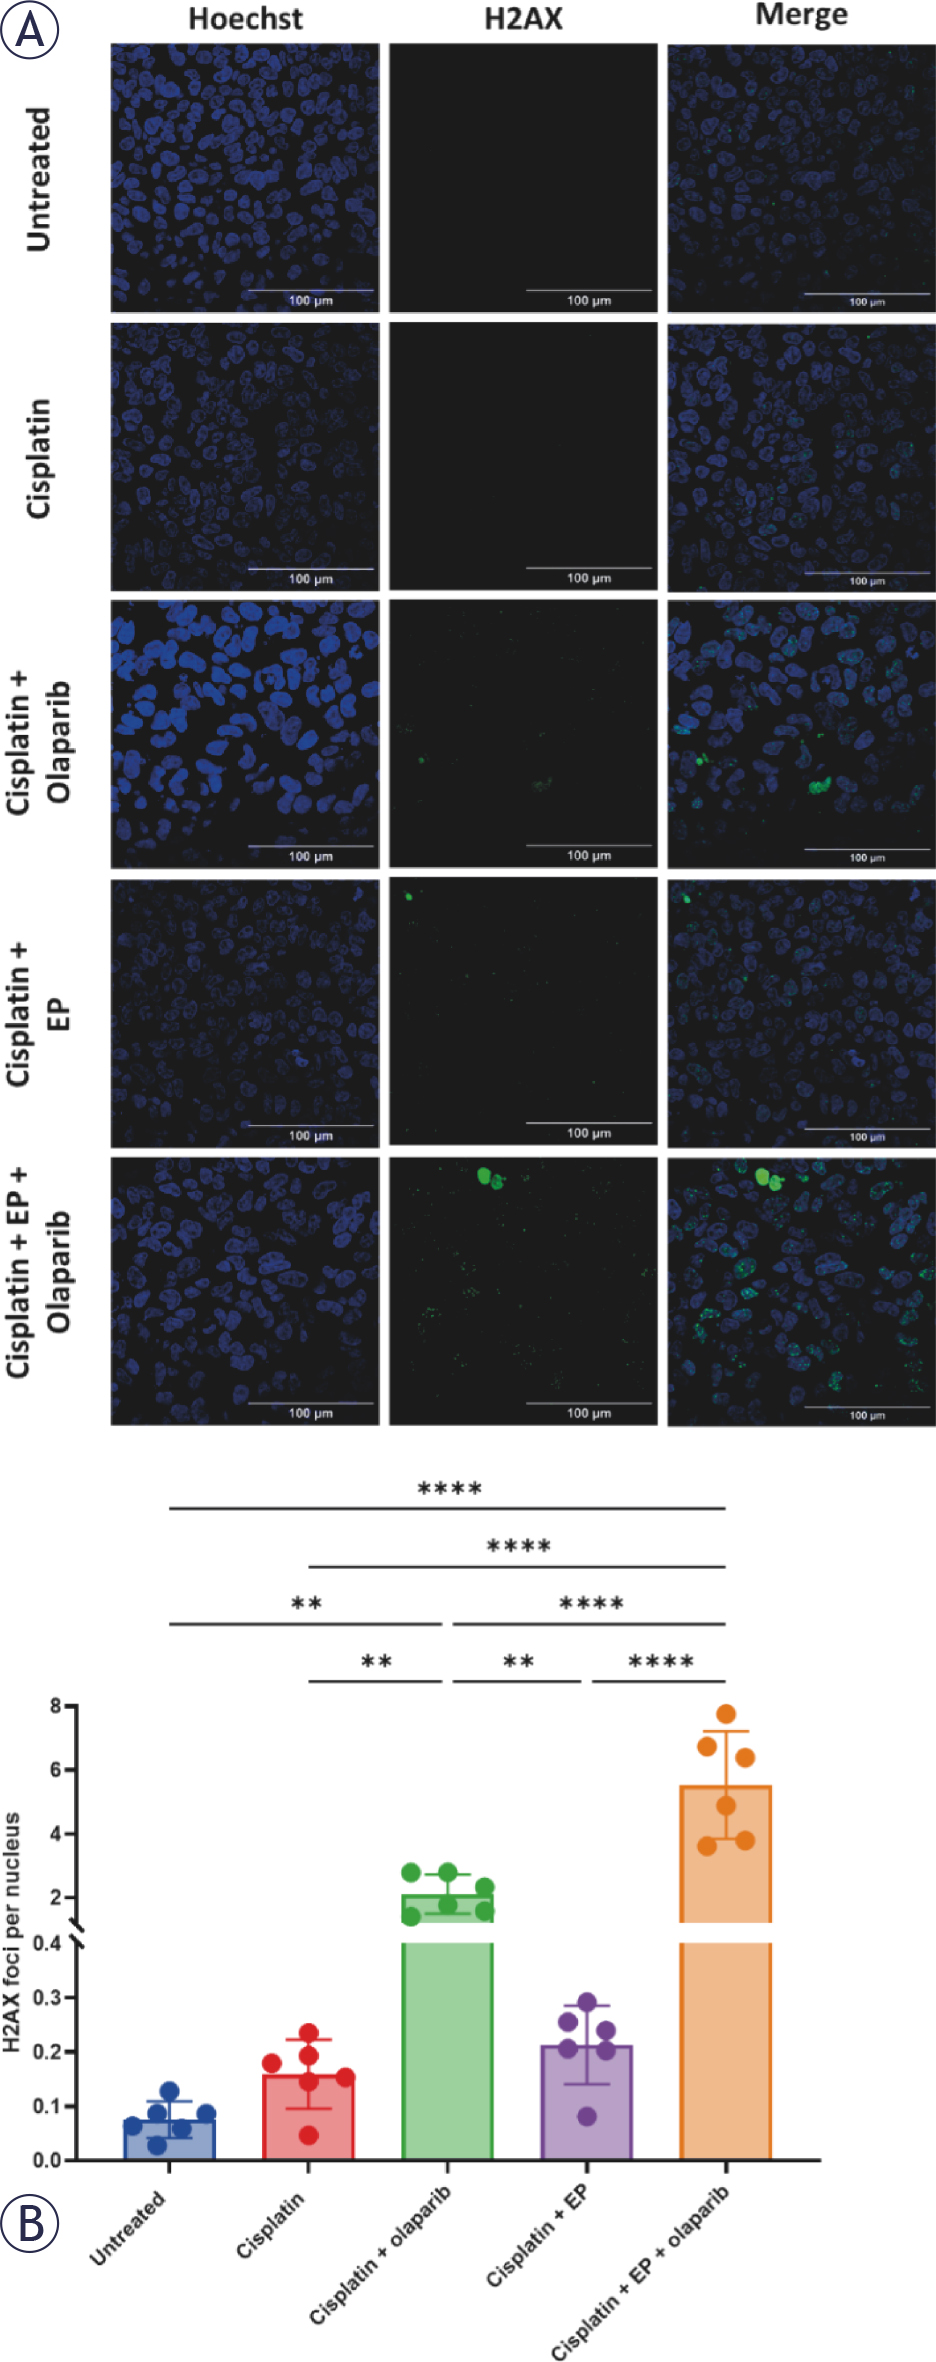
FIGURE 5.
(A) Representative γ-H2AX foci staining 48 hours following treatment with electroporation (EP, 0.74 kV/cm) and cisplatin (10 μM) with and without olaparib (5 μM) in KELLY cells. (B) Olaparib significantly increases the number of γ-H2AX foci per nucleus. Data are presented as mean ± standard deviation. Statistical comparison by one-way ANOVA with Tukey’s post-hoc test. *p <0.05; **p <0.01; *** p <0.001; **** p <0.0001