
TABLE 1.
Publicly available dataset with chronic kidney disease (CKD) or colorectal cancer (CRC) structured data
| Dataset Name | Description | Use | Access | Link [reference] |
|---|---|---|---|---|
| Real colorectal cancer datasets from Kaggle | 62 colorectal cancer patients and their respective gene expression levels. | Integration between clinical and transcriptomic data | Open access | [7] |
| UCI CKD dataset | 400 patients, 24 clinical features | CKD stage classification | Open access | [10] |
| Kaggle CKD dataset | 1,659 patients, clinical/lab data | Statistical analysis, ML | Open access | [11] |
| USRDS | National registry (CKD, ESRD) | Epidemiological studies | Request-based | [12] |
| UKRR CKD/AKI dataset | UK registry for CKD/AKI | Clinical audit, registry | Request via HDR UK | [13] |
| NHANES CKD | US survey with CKD diagnostics | Public health, epidemiology | Open access | [14] |
| dbGaP CKD genetics | Exome/genotype + phenotype | CKD genomics, GWAS | Request via dbGaP | [15] |
| PLCO CRC dataset | 155,000 subjects, screening + followup | Screening, epidemiology | Request via CDAS | [16] |
| GENIE BPC CRC | 1,485 patients, NGS + clinical | Precision medicine | Open access | [17] |
| TCIA CMB-CRC | Histopathology + radiology DICOM | Radiogenomics, AI | Open access | [18] |
| TCIA CRC_FFPE CODEX | 35 multiplexed tumor images | Spatial biology, tumor microenvironment | Open access | [19] |
| ICCR CRC pathology | Standardized pathology templates | Diagnostic standardization | Open access | [20] |
| Kaggle CRC lifestyle | Diet, lifestyle, BMI, habits | Risk factor analysis | Open access | [21] |
| LC25000 & EBHI | 25,000 histopath images in 5 classes | Image classification (CNN) | Open access | [22] |
| Kvasir-SEG | Polyp segmentation with masks | Endoscopic segmentation | Open access | [23] |
| TCGA-COAD | > 450 CRC patients, multi-omics | Oncogenomics, CMS | Open + dbGaP (raw) | [24] |
1 AI = artificial Intelligence; AKI = acute kidney injury; CCN = convolutional neural network; CDAS = Cancer Data Access System; dbGaP = database of Genotypes and Phenotypes; CMS = Consensus Molecular Subtypes; DICOM = Digital Imaging and Communications in Medicine; EBHI = Enteroscope biopsy histopathological H&E image dataset; ESRD = end-stage renal disease; FFPE = formalin-fixed paraffin-embedded; GENIE BPC = Genomics Evidence Neoplasia Information Exchange Biopharma Collaborative; GWAS = genome-wide association study; HDR UK = health data research United Kingdom; ICCR = international collaboration cancer reporting; Kvasir-SEG = Segmented Polyp Dataset; LC25000 = Lung and colon histopathological image dataset, contains colour 25,000 images; ML = machine learning; NHANES = National Health and Nutrition Examination Survey; PLCO = Prostate, lung, colorectal and ovarian cancer screening trial; TCGA-COAD = the cancer genome atlas colon adenocarcinoma; TCIA CMB =The Cancer Imaging Arhiv Cancer Moonshot Biobank; UCI CKD = UC Irvin Machine Learning Repository chronic kidney disease; USRDS = United States Renal Data System data
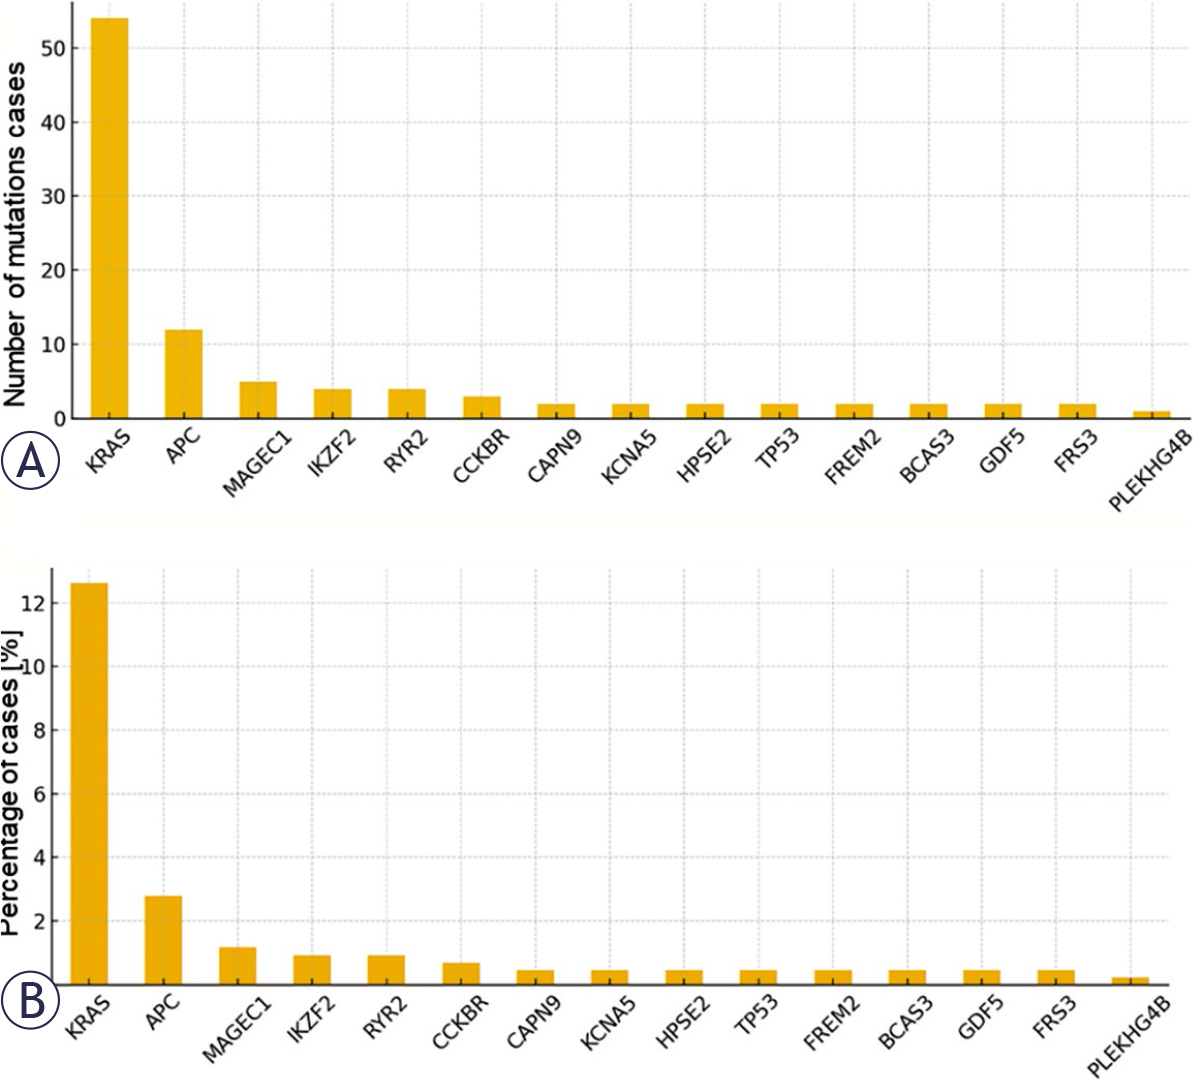
FIGURE 1.
(A)Total number of mutated cases per gene. Bar plot representing the absolute number of patients in the cancer genome atlas colon adenocarcinoma (TCGA-COAD) cohort harboring somatic mutations in the most frequently altered genes. The top mutated genes (e.g., Kirsten rat sarcoma viral oncogene homolog [KRAS], adenomatous polyposis coli [APC], tumor protein p53 [TP53]) are displayed in descending order, highlighting their prevalence in colorectal cancer. (B) Cumulative percentage of patients with mutations per gene. Bar plot showing the cumulative percentage of patients affected by somatic mutations in each gene.
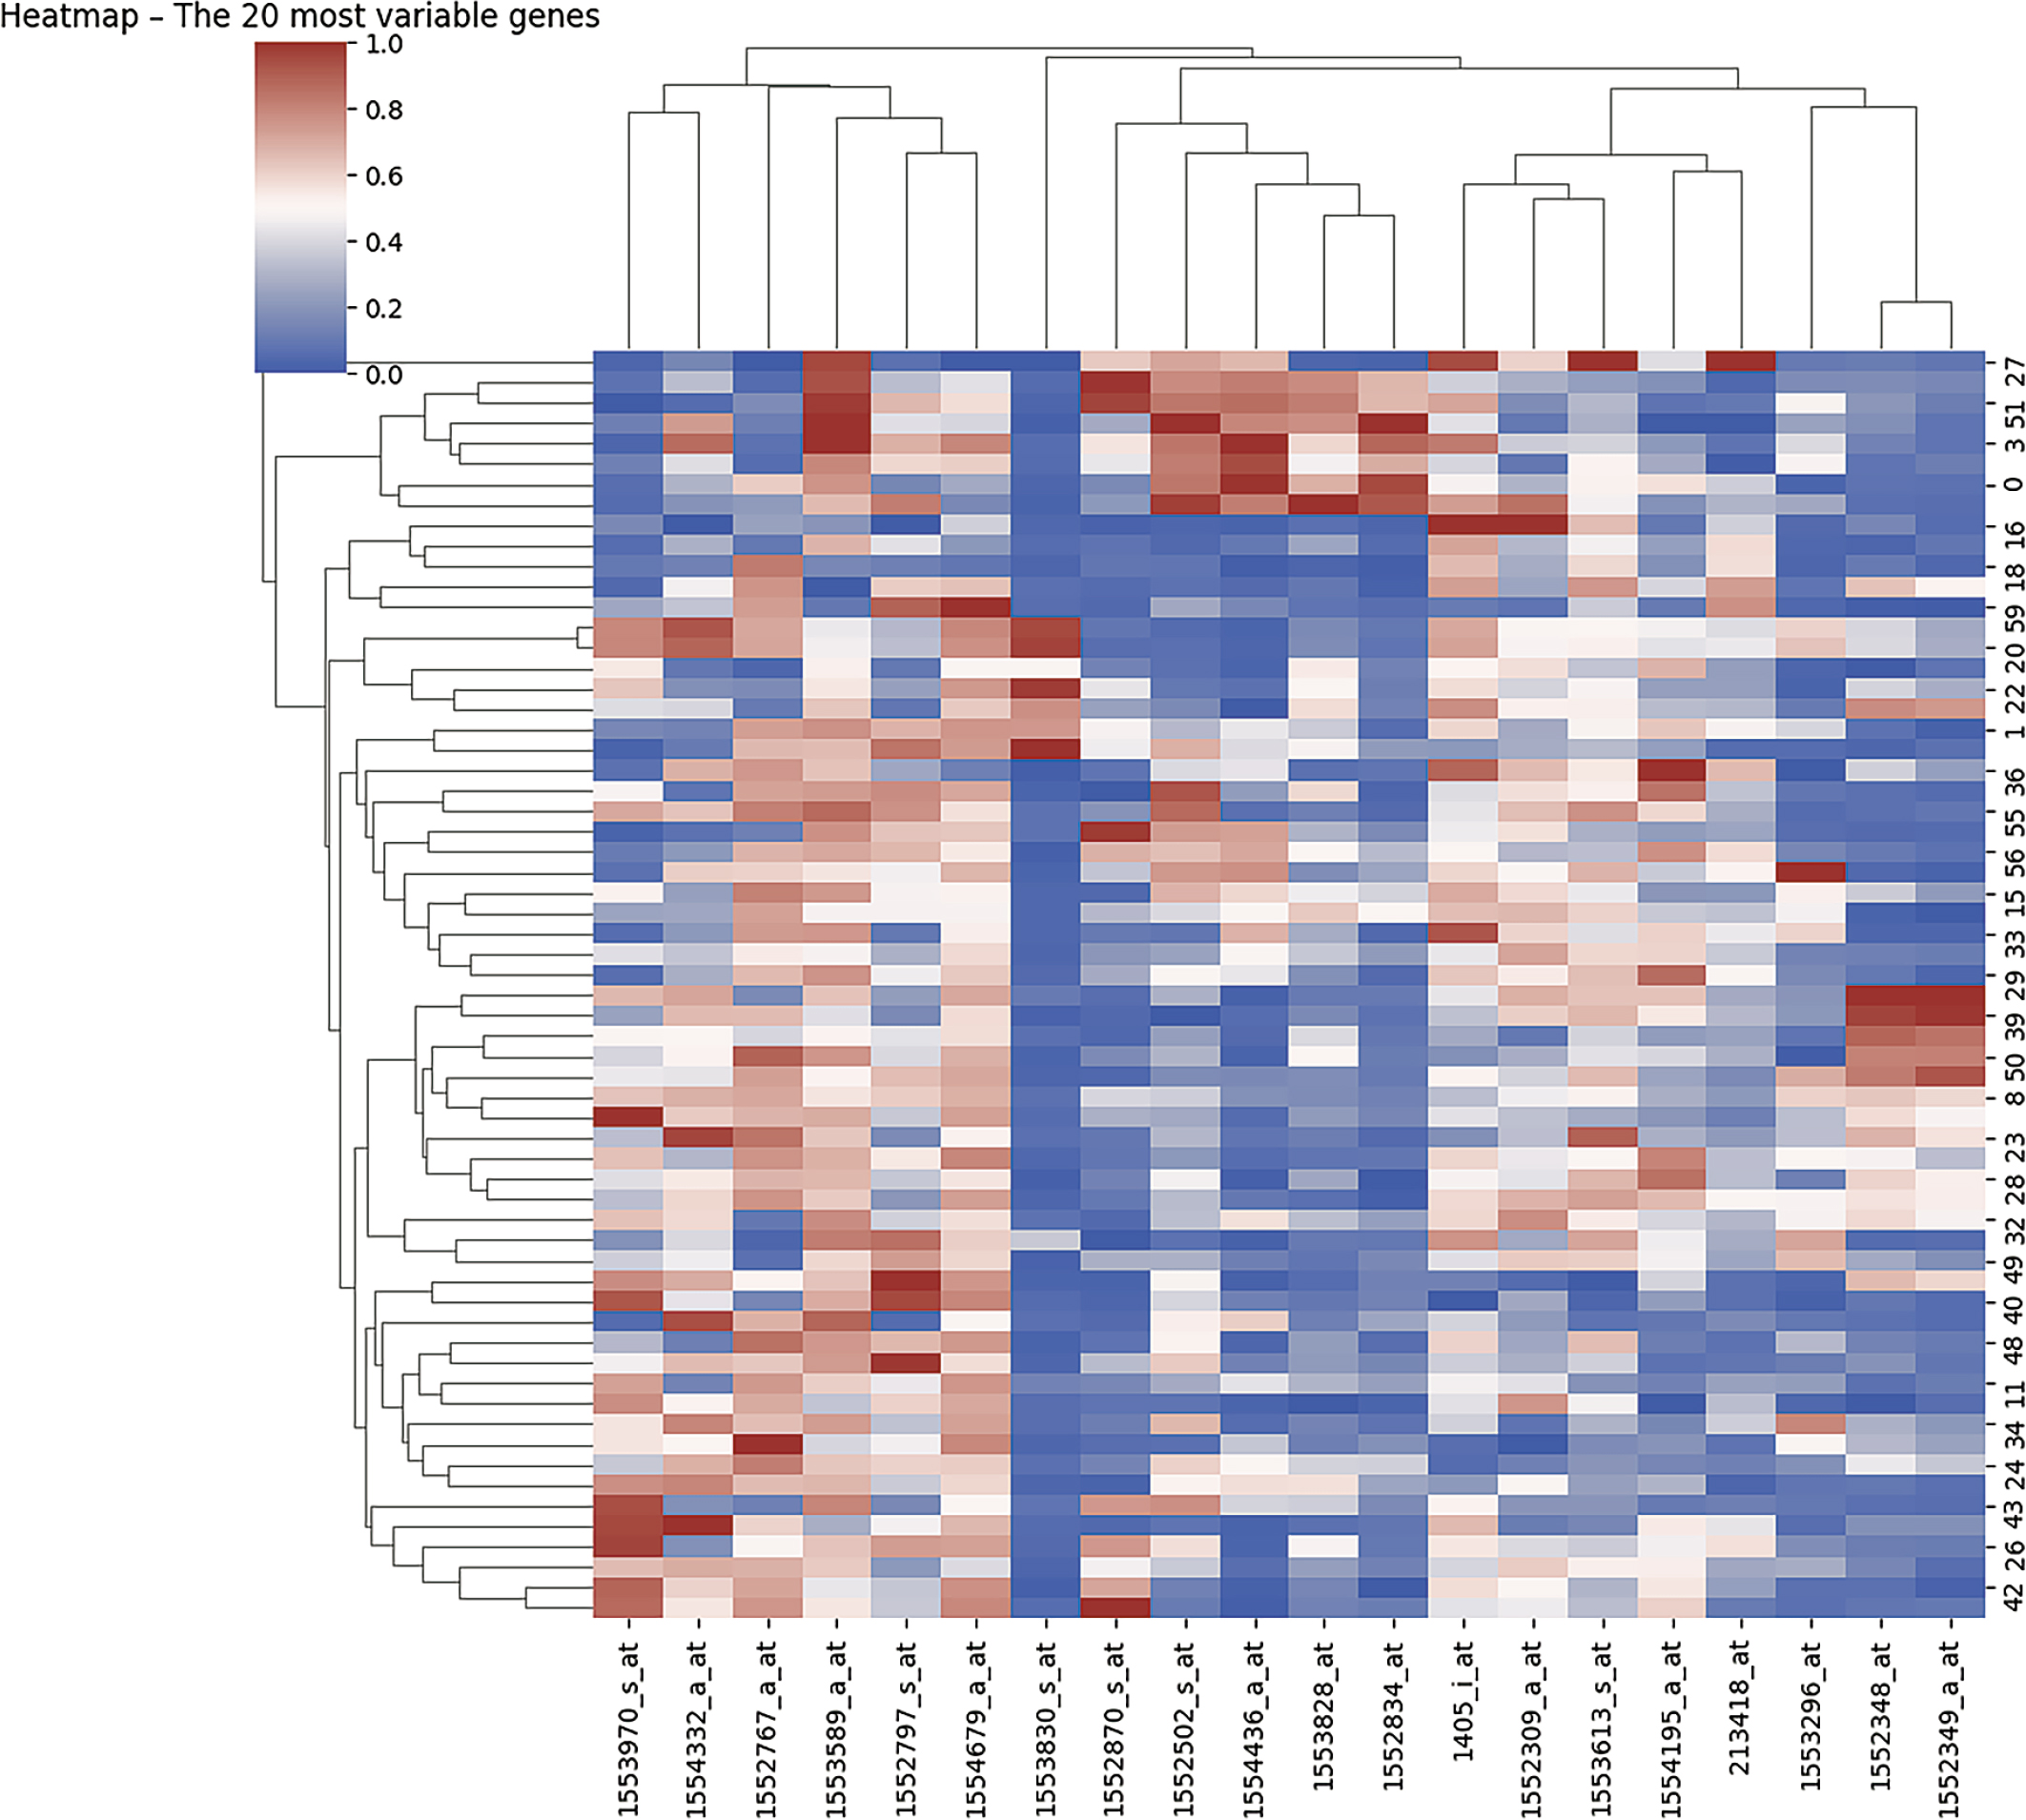
FIGURE 2.
Heatmap of the top 20 most variable genes.
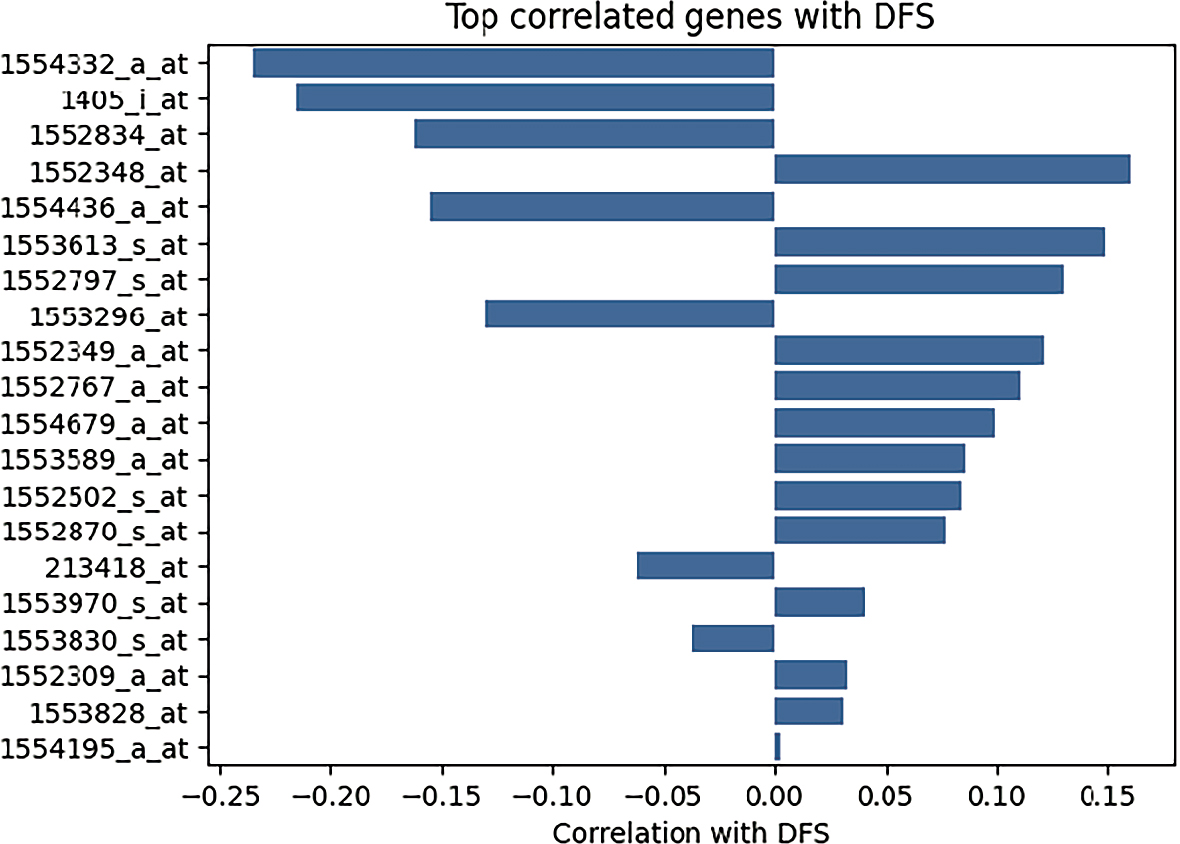
FIGURE 3.
Bar plot top 20 correlated genes with disease-free survival (DFS).
TABLE 2.
The description of the selected top 20 genes
| Probe-set ID | Gene symbol | Gene title |
|---|---|---|
| 1554332_a_at | ALDH1A1 | Aldehyde dehydrogenase 1 family, member A1 |
| 1405_i_at | CDK2 | Cyclin-dependent kinase 2 |
| 1552834_at | EGFR | Epidermal growth factor receptor |
| 1552348_at | VEGFA | Vascular endothelial growth factor A |
| 1554436_a_at | MMP9 | Matrix metallopeptidase 9 |
| 1553613_s_at | IL6 | Interleukin 6 |
| 1552797_s_at | CXCL8 | C-X-C motif chemokine ligand 8 |
| 1553296_at | STAT3 | Signal transducer and activator of transcription 3 |
| 1552349_a_at | TP53 | Tumor protein p53 |
| 1552767_a_at | CCND1 | Cyclin D1 |
| 1554679_a_at | BCL2 | B-cell CLL/lymphoma 2 |
| 1553589_a_at | AKT1 | AKT serine/threonine kinase 1 |
| 1552502_s_at | PTEN | Phosphatase and tensin homolog |
| 1552870_s_at | KRAS | Kirsten rat sarcoma viral oncogene homolog |
| 213418_at | HER2 | Human epidermal growth factor receptor 2 |
| 1553970_s_at | MYC | MYC proto-oncogene, bHLH transcription factor |
| 1553830_s_at | CCNE1 | Cyclin E1 |
| 1552309_a_at | CDKN1A | Cyclin-dependent kinase inhibitor 1 |
| 1553828_at | PTGS2 | Prostaglandin-endoperoxide synthase 2 (COX-2) |
| 1554195_a_at | IL10 | Interleukin 10 |
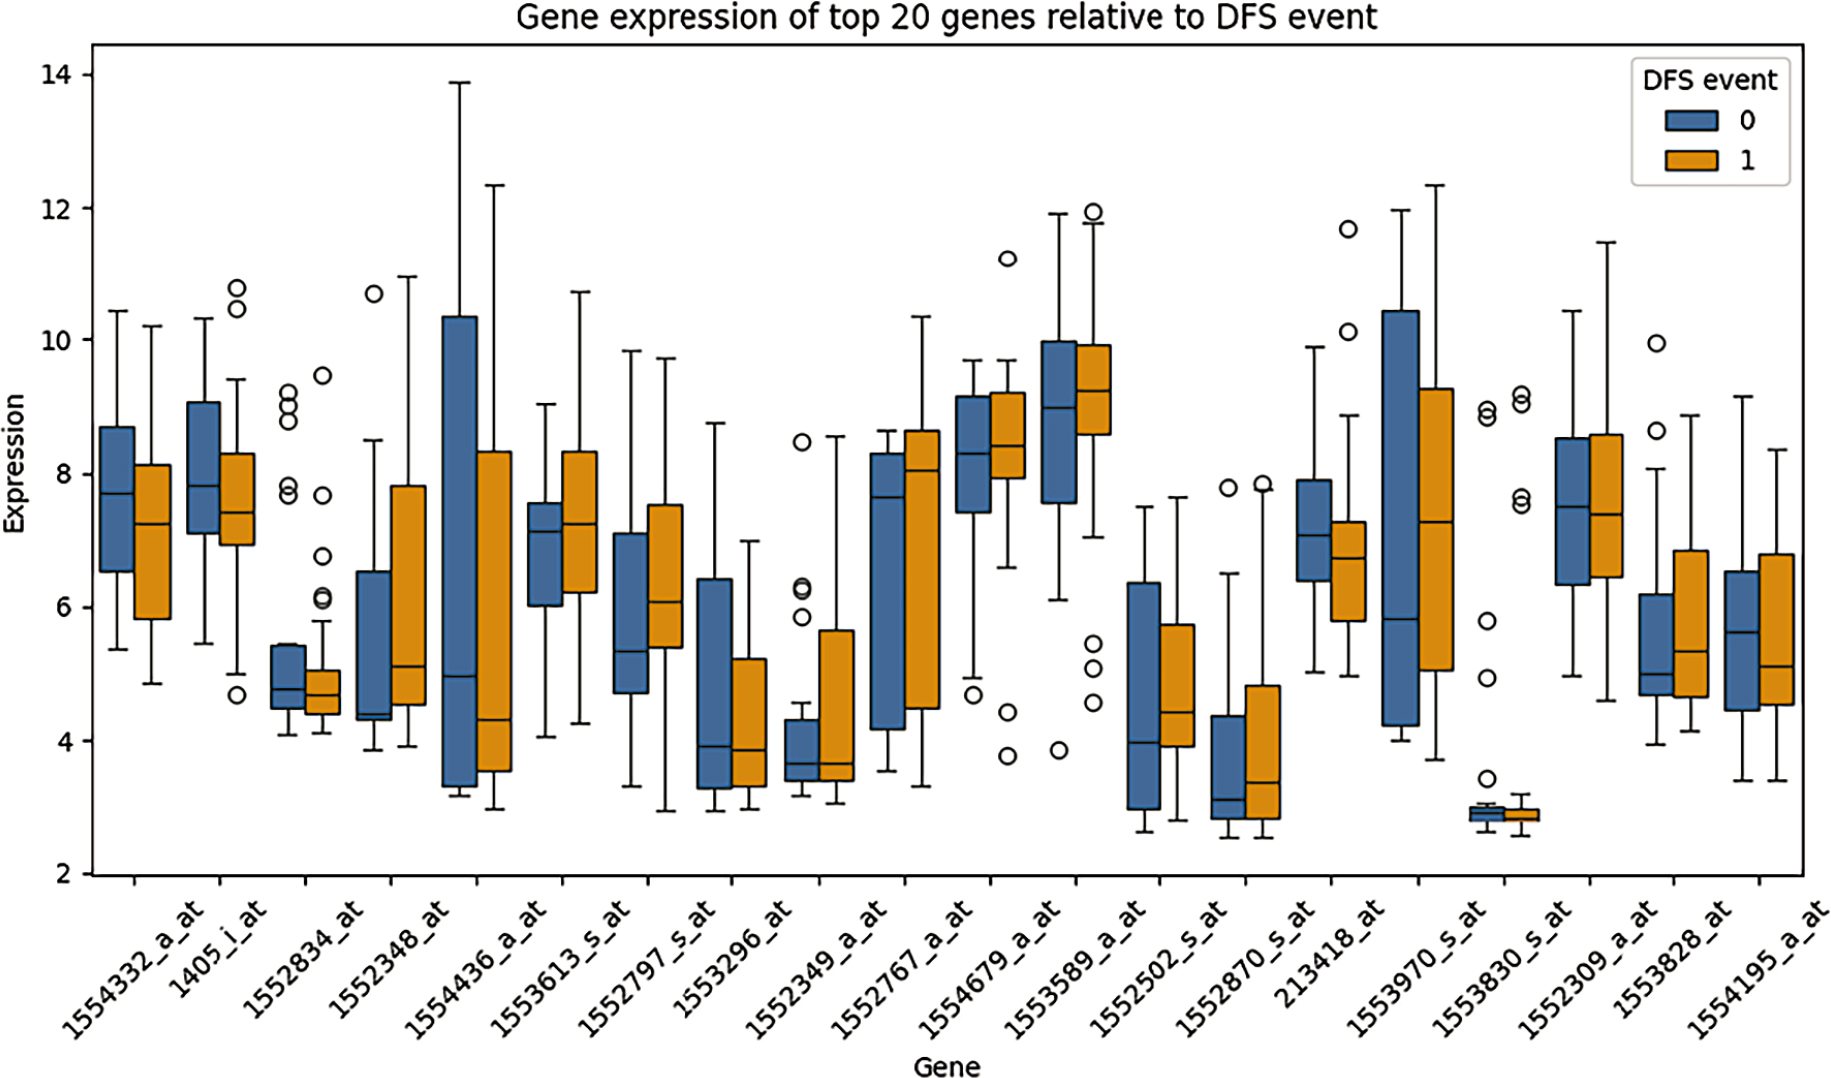
FIGURE 4.
Boxplot of the top 20 correlated genes revealed group-wise differences between patients with and without disease-free survival (DFS) events.
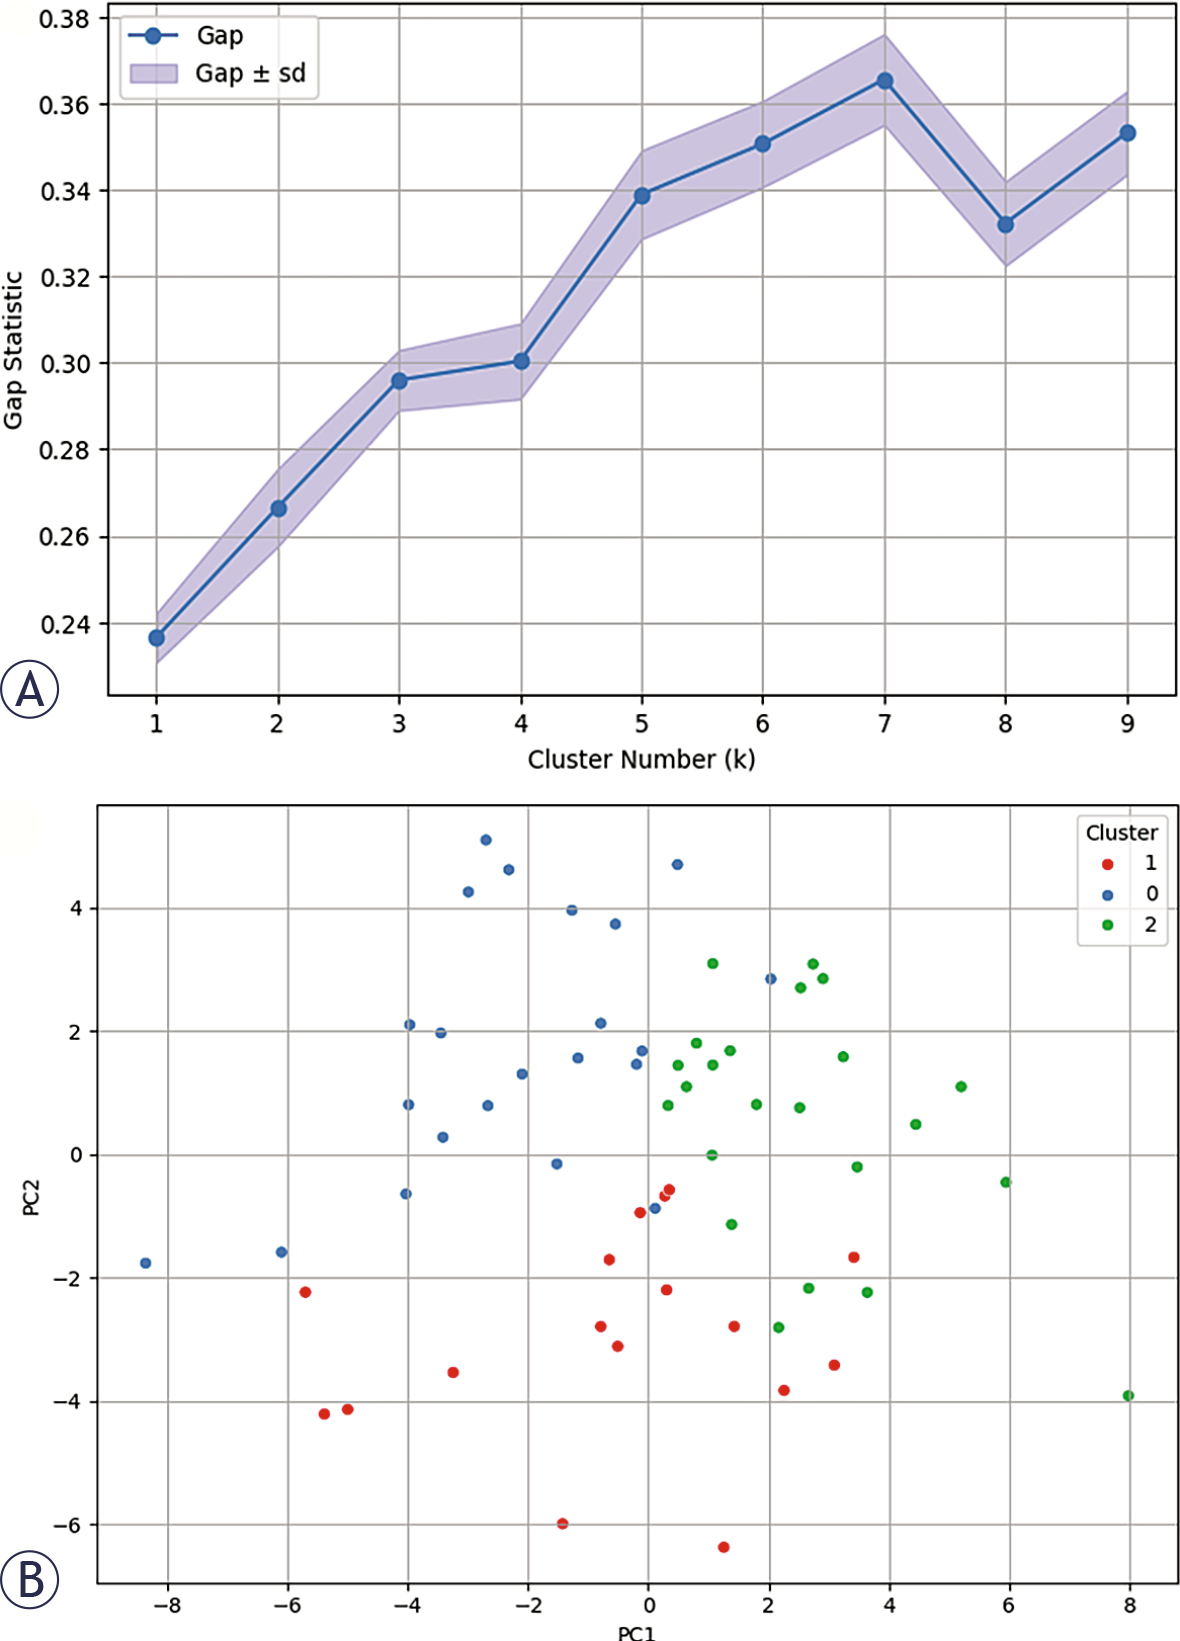
FIGURE 5.
(A) Clustering with k = 3 (optimal value identified from gap statistic); (B) revealed three distinct patient clusters, visualized via principal component analysis (PCA) projection (Figure 5B)).
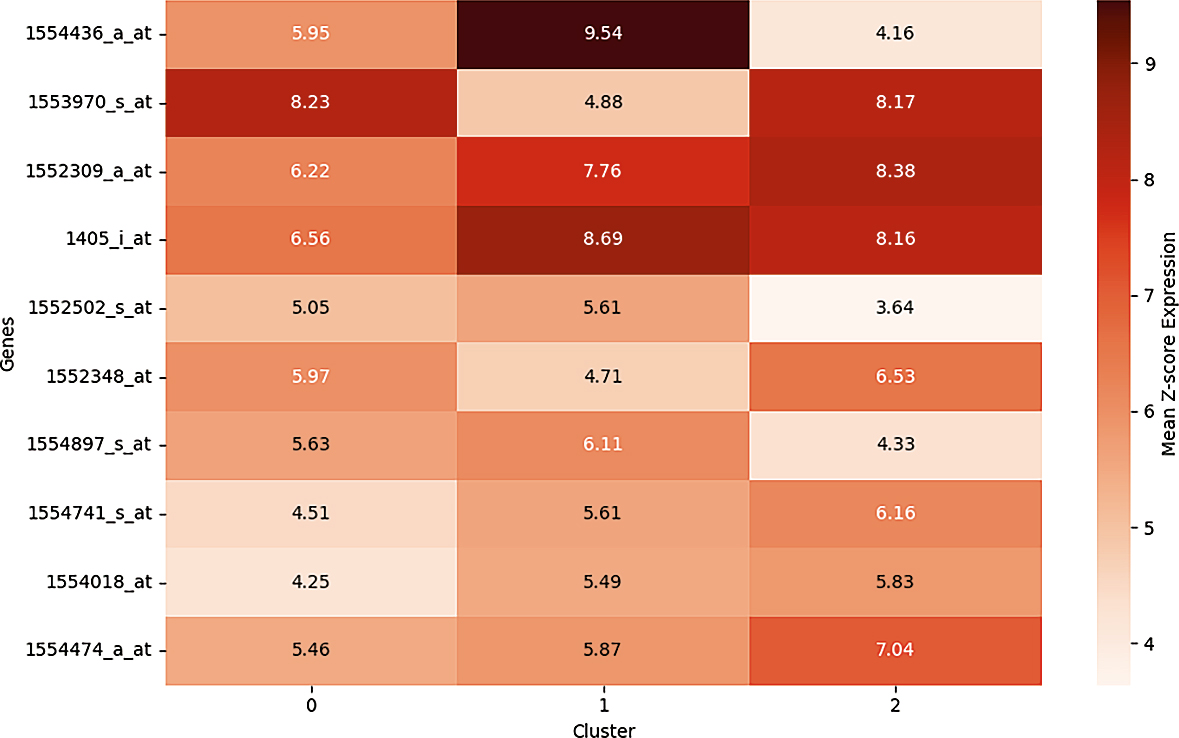
FIGURE 6.
Top 10 Most variable genes across 3 clusters.
TABLE 3.
Performance of tested classifier to predict disease-free survival (DFS)
| Model | Accuracy | Precision | Recall | F1-score | AUC Test | AUC CV |
|---|---|---|---|---|---|---|
| Random forest | 0.842 | 0.9 | 0.818 | 0.857 | 0.955 | 0.92 |
| Logistic regression | 0.842 | 0.833 | 0.909 | 0.87 | 0.909 | 0.939 |
| Gradient boosting | 0.789 | 0.818 | 0.818 | 0.818 | 0.818 | 0.703 |
| XGBoost | 0.684 | 0.778 | 0.636 | 0.7 | 0.818 | 0.878 |
| Decision tree | 0.632 | 0.7 | 0.636 | 0.667 | 0.631 | 0.616 |
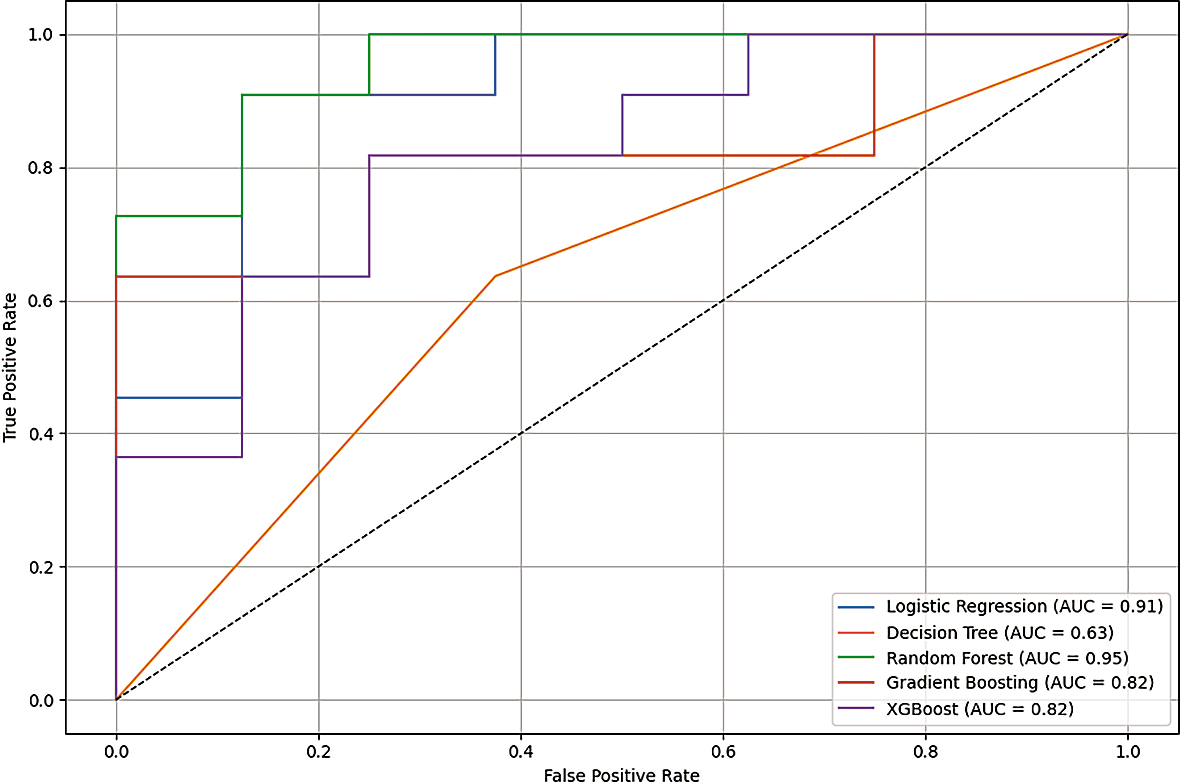
FIGURE 7.
Receiver operating characteristic (ROC) curves of tested classifier to predict disease-free survival (DFS).
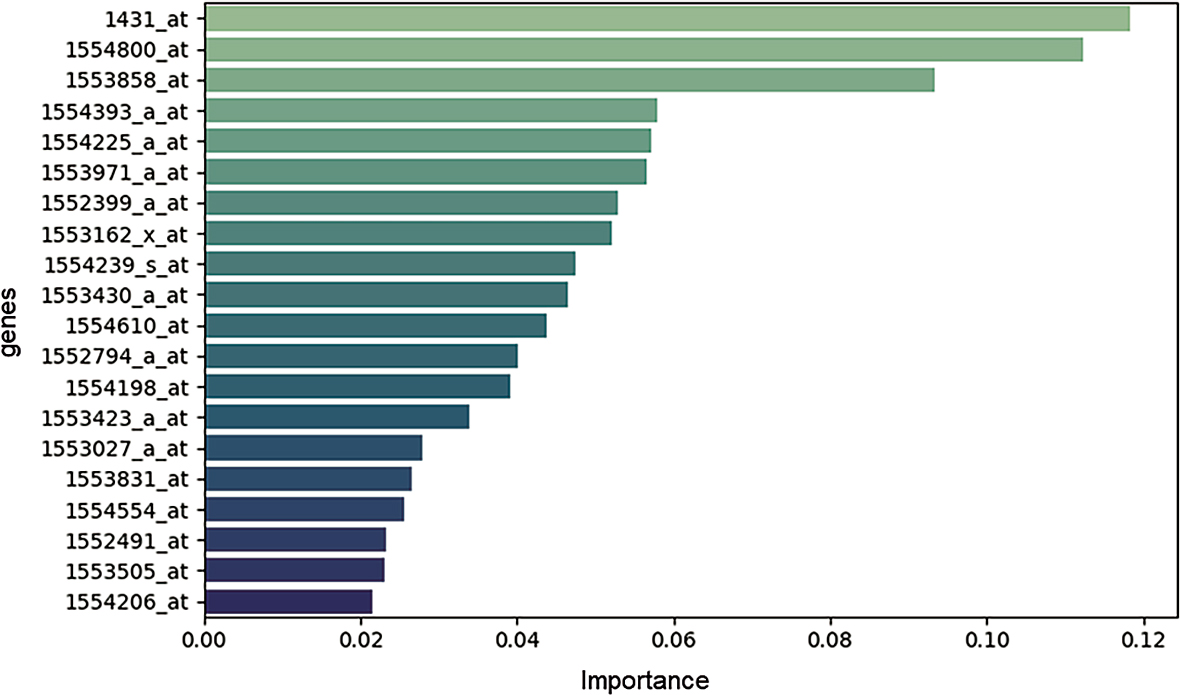
FIGURE 8.
Feature importance analysis.