
FIGURE 1.
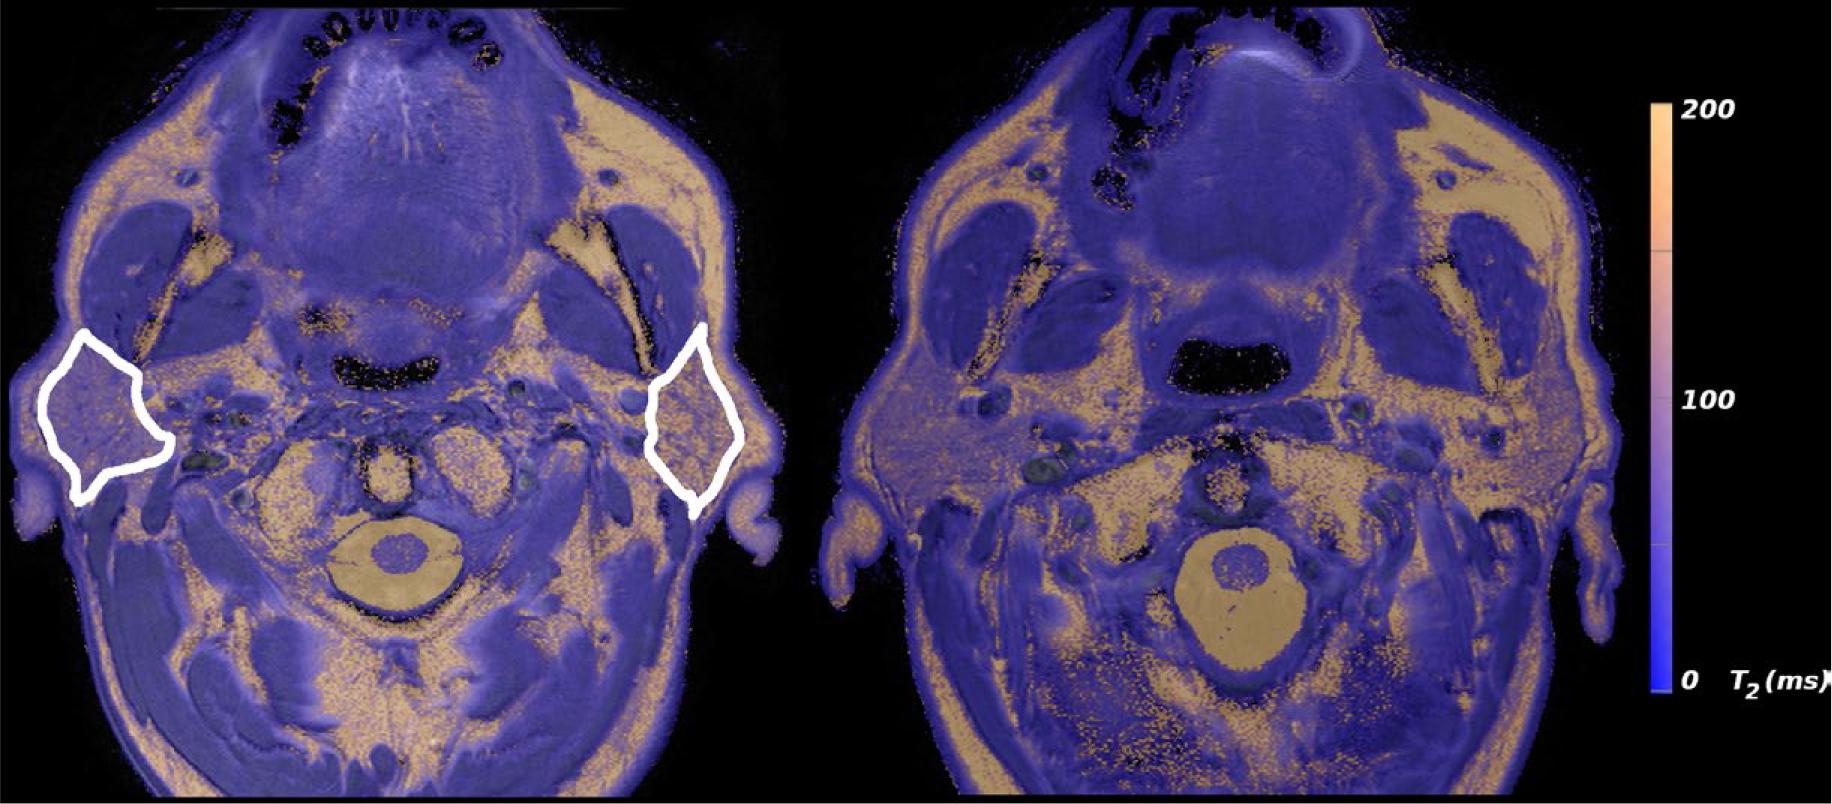
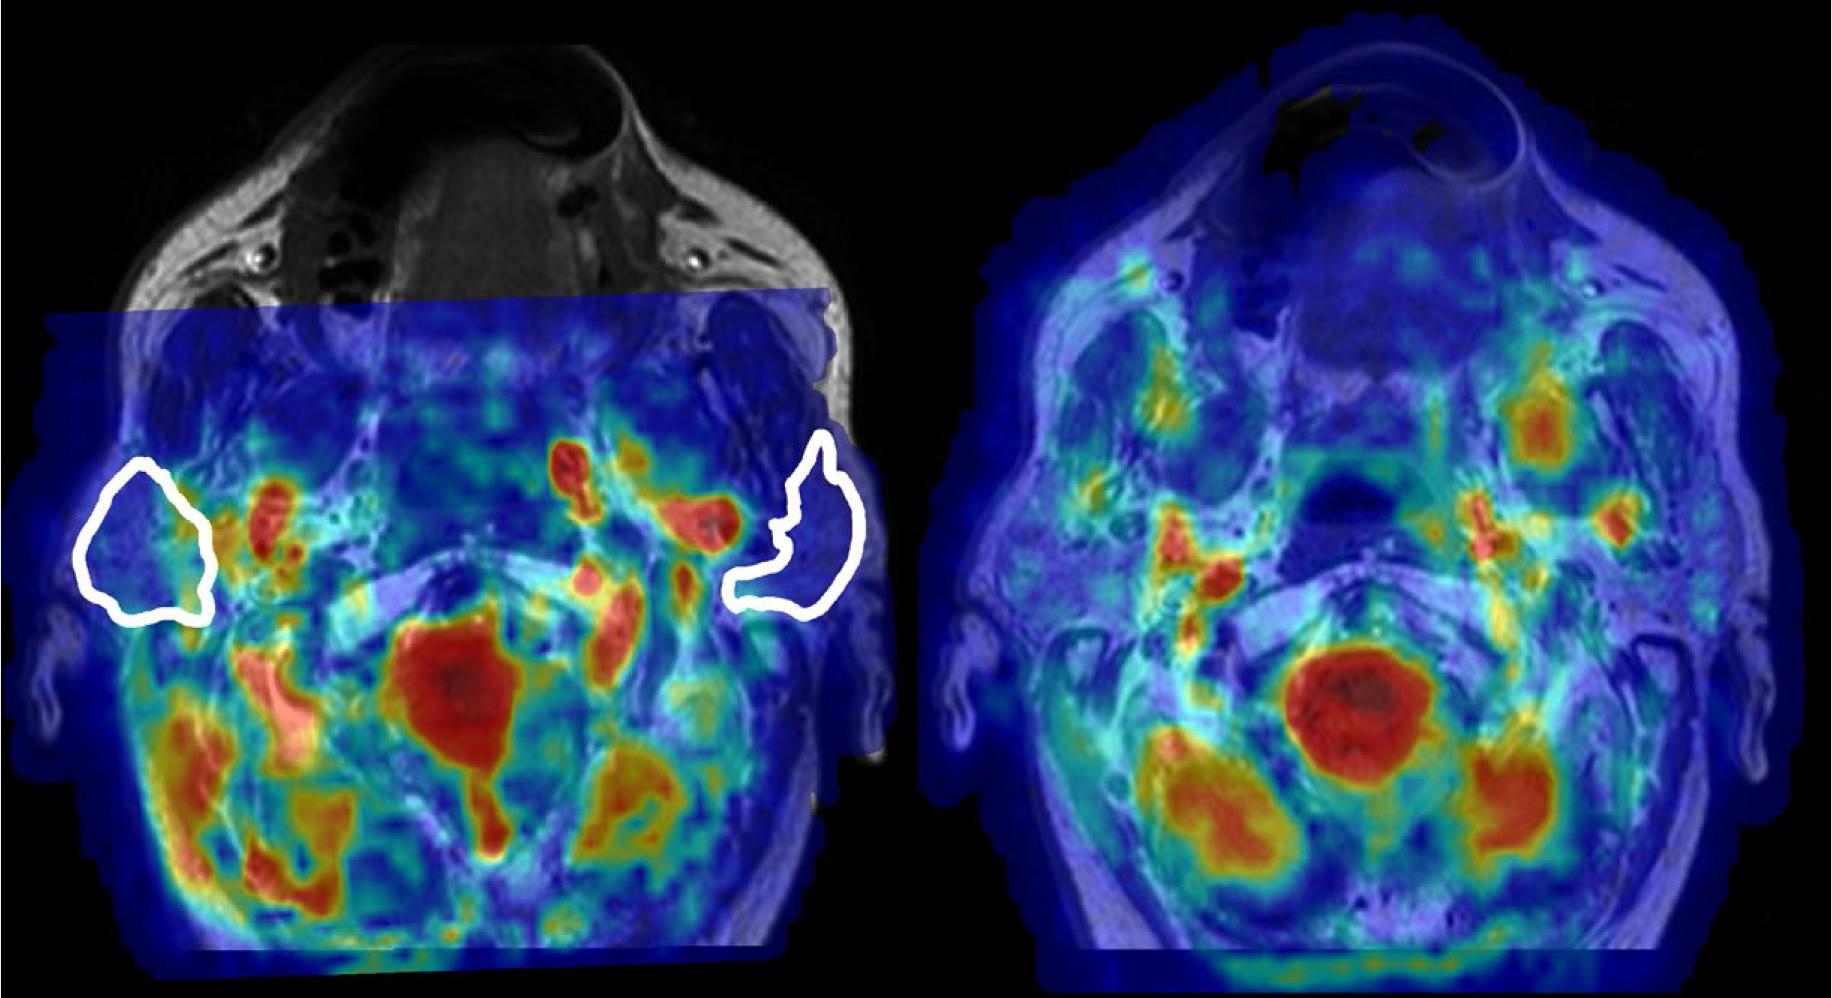
FIGURE 2.
Diagnostic benchmarks for parotid gland dysfunction using multi-dynamic multi-echo (MDME) / synthetic MRI3
| Parameter | Healthy controls (mean ± SD) | Hyposalivation group (mean ± SD) | Cut-off value | AUC |
|---|---|---|---|---|
| T1 relaxation (ms) | 628.08 | 606.92 | / | / |
| T2 relaxation (ms) | 80.69 ± 6.42 | 91.85 ± 8.24 | > 85.75 | 0.8131 |
| Proton density (pu) | 91.12 | 82.52 | < 81.55 | 0.7588 |
Resting and stimulated salivary blood flow (SBF) metrics via pseudo-continuous arterial spin labelling (pCASL)6
| SBF parameter | Healthy glands | Sjögren’s syndrome glands |
|---|---|---|
| Base flow (mL/min/100g) | 46.3 ± 9.0 | 59.2 ± 22.8 |
| Stimulation response | 47 ± 39% | 74 ± 49% |
| SBF type | Type 1 (rapid) | Type 2/3 (delayed) |
Summarization of quantitative characterization of major salivary gland neoplasms10,12,13,21
| Tumor type | ADC (×10-3mm2/s) | TIC curve pattern | Kep(min-1) | Ve (fractional vol) | Diagnostic features |
|---|---|---|---|---|---|
| Pleomorphic adenoma (PA) | High: 1.4–1.8 | Type A (Progressive) | Low: ~ 0.69 | High: ~ 0.65 | High ADC + Type A curve is 95% specific for PA. |
| Warthin’s tumor (WT) | Low: < 0.9 | Type B (Rapid washout) | High: ~ 6.2 | Low: ~ 0.11 | High Kep and Type B curve differentiate WT from malignancy. |
| Lymphoma | Very low: 0.4–0.7 | Type C (Plateau) or B | N/A (Typically low) | Variable | ADC < 0.7 is considered pathognomonic for lymphoma. |
| Malignant tumors (MT) | Moderate: 0.9–1.2 | Type C (Plateau) | Moderate: ~ 1.72 | Moderate: ~ 0.48 | Type C curve is the most common finding for epithelial malignancies. |
Evolution of parotid T2 values during restorative hyperbaric oxygen therapy (HBOT)7
| Gland group | Mean T2 before HBOT (ms) | Mean T2 after HBOT (ms) | Control group T2 (ms) |
|---|---|---|---|
| Ipsilateral (high dose) | 121 ± 20 | 113 ± 16 | 96 ± 12 |
| Contralateral (low dose) | 107 ± 21 | 103 ± 14 | 96 ± 12 |
Summary of information provided by different salivary imaging modalities
| Modality | Spatial resolution | Functional parameters | Advantages | Limitations |
|---|---|---|---|---|
| Scintigraphy | Low | Global excretion rate | Well-established; measures total function | Ionizing radiation; poor anatomical detail |
| MR sialography | High | Ductal anatomy | Non-physiological; excellent for stricture detection | Does not measure perfusion |
| T2 mapping | High | Water content; oedema | Quantitative; non-contrast | Requires advanced software |
| ASL MRI | Medium/high | Salivary blood flow (SBF) | Completely non-invasive; measures microcirculation | Sensitive to patient motion |
| DWI / ADC | Low/medium | Cellularity; microstructure | Quantitative; differentiates between tumors | Overlapping values; low resolution |
| DCE-MRI | High | Vascularity; permeability | Excellent characterization of tumor kinetics | Requires gadolinium; invasive (IV) |
| MR elastography (MRE) | High | Tissue stiffness; fibrosis | Non-invasive assessment of biomechanical properties | Requires additional hardware |