
FIGURE 1.
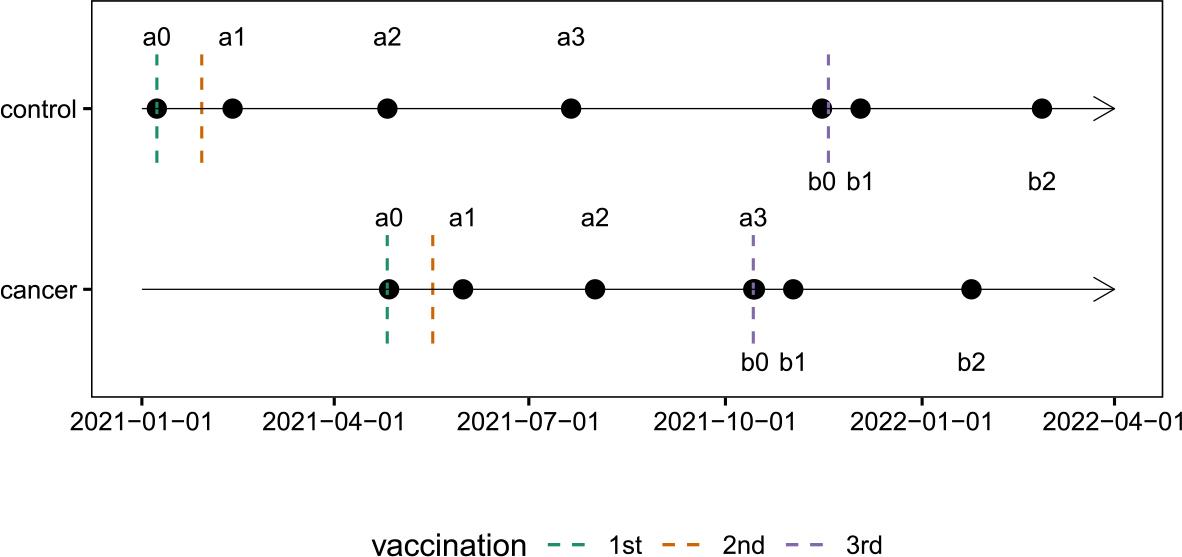
FIGURE 2.
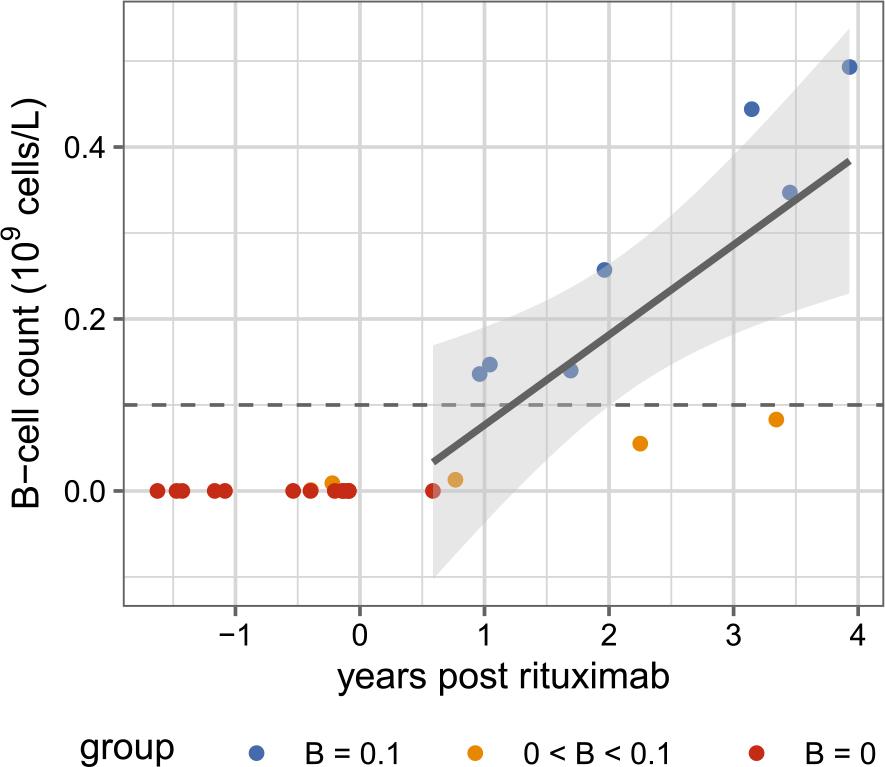
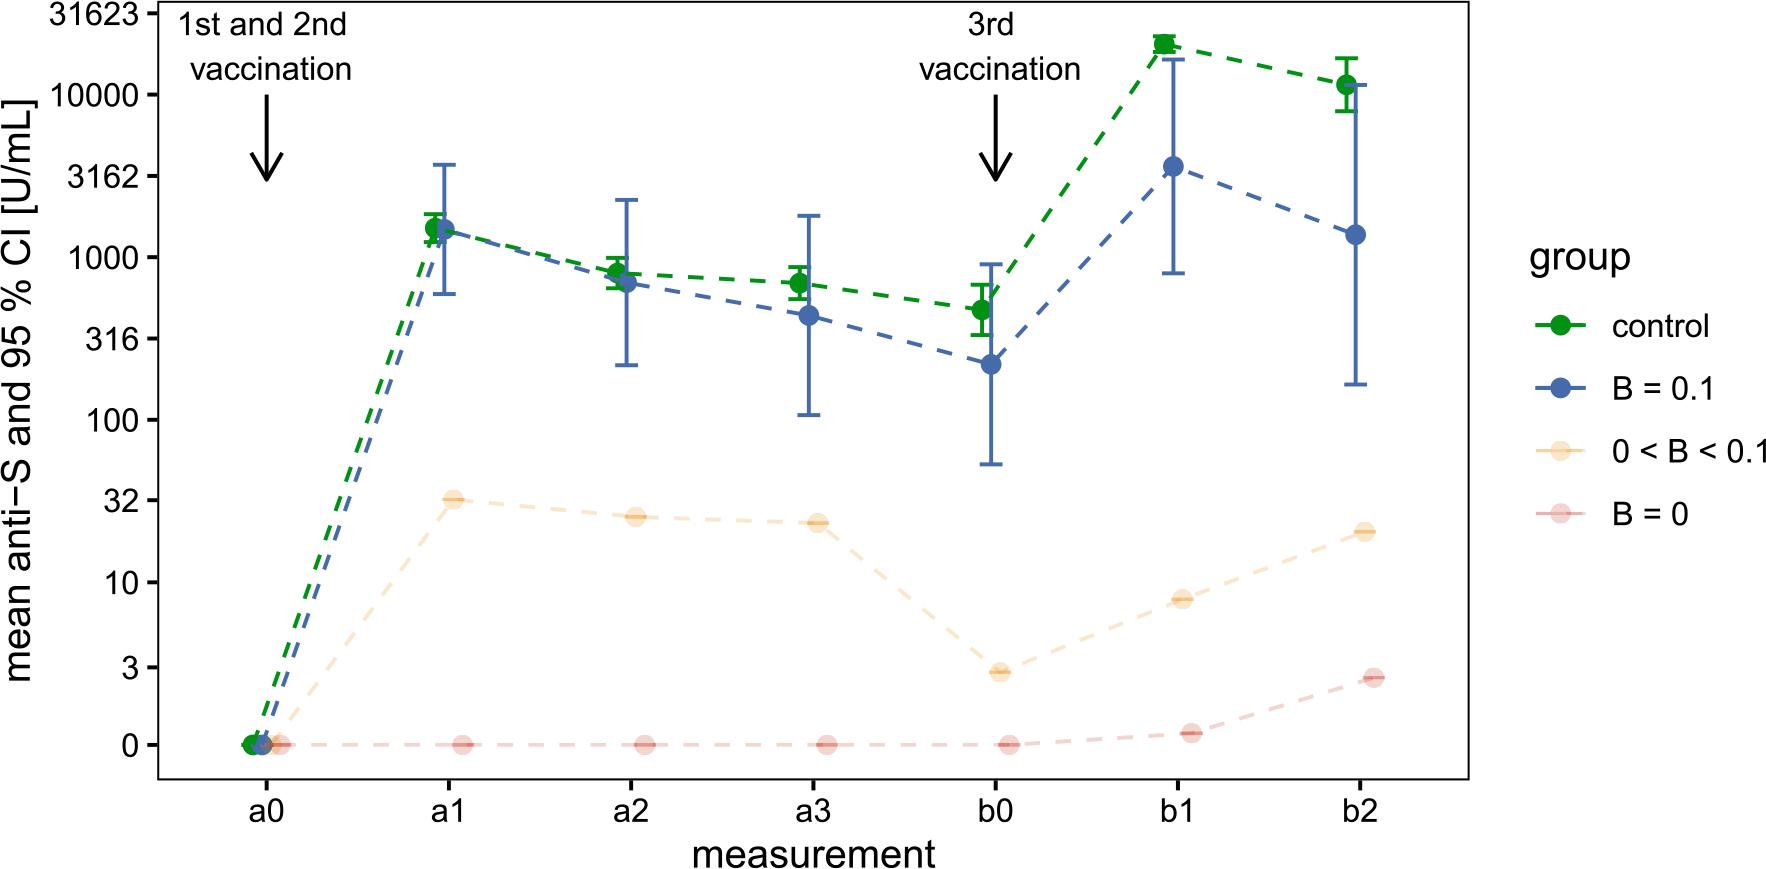
FIGURE 3.
Demographic characteristics of the patient and volunteer groups
| Characteristic | Overall N = 66 | Patients N = 25 | Volunteers N = 41 | p-value1 |
|---|---|---|---|---|
| Sex: n (%) | 0.039 | |||
| male | 17 (26%) | 10 (40%) | 7 (17%) | |
| female | 49 (74%) | 15 (60%) | 34 (83%) | |
| Age: mean (Q1, Q3) | 51 (39, 62) | 65 (56, 68) | 42 (36, 53) | < 0.001 |
Welch’s t-test results for log-transformed anti-S antibody concentrations (U/mL), comparing the B > 0_1 × 109 cells/L group with the volunteer group at 14 days post-primary and post-booster vaccination
| Measurement | Group | Geometric mean (SD) | Welch’s t-test |
|---|---|---|---|
| a1 | control | 1 510 (650) | t (df = 6.8) = 0.05 |
| B ≥ 0.1 | 1 482 (1 079) | p = 0.963 | |
| b1 | control | 20 442 (3 572) | t (df = 3.1) = 3.62 |
| B ≥ 0.1 | 3 617 (2 510) | p = 0.035 |
Linear regression model results of the relationship between B-cell count and time post last rituximab
| Term | Estimate | SE | t | df | p | CI lower | CI upper |
|---|---|---|---|---|---|---|---|
| (Intercept) | -0.03 | 0.08 | -0.37 | 9 | 0.718 | -0.20 | 0.14 |
| Years post rituximab | 0.10 | 0.03 | 3.32 | 9 | 0.009 | 0.03 | 0.18 |