
TABLE 1.
Parameters for pelvic area kV cone-beam CT (CBCT) simulations. All protocols employ half fan filtering unless otherwise stated. The last protocol shows the parameters used in validation measurements
| Hospital | Machine manufacturer/model | U (kV) | Q (mAs) | CTDIw (mGy) | Projections | X-ray source start-stop angle (degrees) | Imaged region length (cm) | FOV (cm) | Notes |
|---|---|---|---|---|---|---|---|---|---|
| C | Elekta Agility | 120 | 1056 | 22.0 | 660 | -180 to 180 | 41 | 27 | Vendor provided |
| G1 | Elekta Agility | 120 | 528 | 11.0 | 330 | 90 to -89 | 28 | 42 | Vendor provided |
| A3 | Varian ClinaciX | 125 | 659 | 17.8 | 650 | 182 to - 178 | 11 | 30 | Vendor provided |
| D1 | Varian TrueBeam | 125 | 1080 | 16.0 | 900 | 90 to 270 | 15 | 45 | Vendor provided |
| F1 | Varian Trilogy | 125 | 697 | 17.8 | 670 | 180 to -180 | 16 | 45 | Vendor provided |
| F6 | Varian Halcyon | 125 | 592 | 11.8 | 529 | -180 to 180 | 22 | 21 | Vendor provided |
| H1 60mA | Varian TrueBeam | 125 | 900 | 13.3 | 900 | 180 to -180 | 21 | 45 | Full fan filter. Optimized on site |
| H1 80mA | Varian Halcyon | 125 | 1074 | 21.5 | 895 | 181 to -181 | 25 | 45 | Vendor provided |
| O2 | Varian TrueBeam | 125 | 684 | 11.5 | 900 | Full rotation | 16 | 45 | Start-stop angles assumed |
| - | Varian TrueBeam | 125 | 1080 | - | 900 | 180 to 180 | 17 | - | Protocol used in MOSFET and LD V1 measurements |
TABLE 2.
Parameters for prostate imaging kV cone-beam (CBCT) protocols. All protocols employ half fan filtering
| Machine manufacturer and model | U (kV) | Q (mAs) | CTDIw (mGy) | Projections | X-ray source startstop angle (degrees) | Imaged region length (cm) | FOV (cm) | |
|---|---|---|---|---|---|---|---|---|
| G1 | Elekta Agility | 120 | 528 | 11.0 | 330 | 90 to -89 | 28 | 42 |
| M1 | Elekta VersaHD | 120 | 845 | 12.2 | 660 | -180 to 180 | 21 | 28 |
| M4 narrow | Elekta Synergy | 120 | 422 | 5.7 | 330 | -180 to 180 | 14 | 28 |
| M4 wide | Elekta Synergy | 120 | 422 | 7.8 | 330 | -180 to 180 | 28 | 28 |
| F2 | Varian TrueBeam | 125 | 1080 | 16.0 | 900 | 180 to -179 | 18 | 49 |
| J | Varian TrueBeam | 125 | 252 | 3.70 | 900 | -179 to 181 | 16 | 45 |
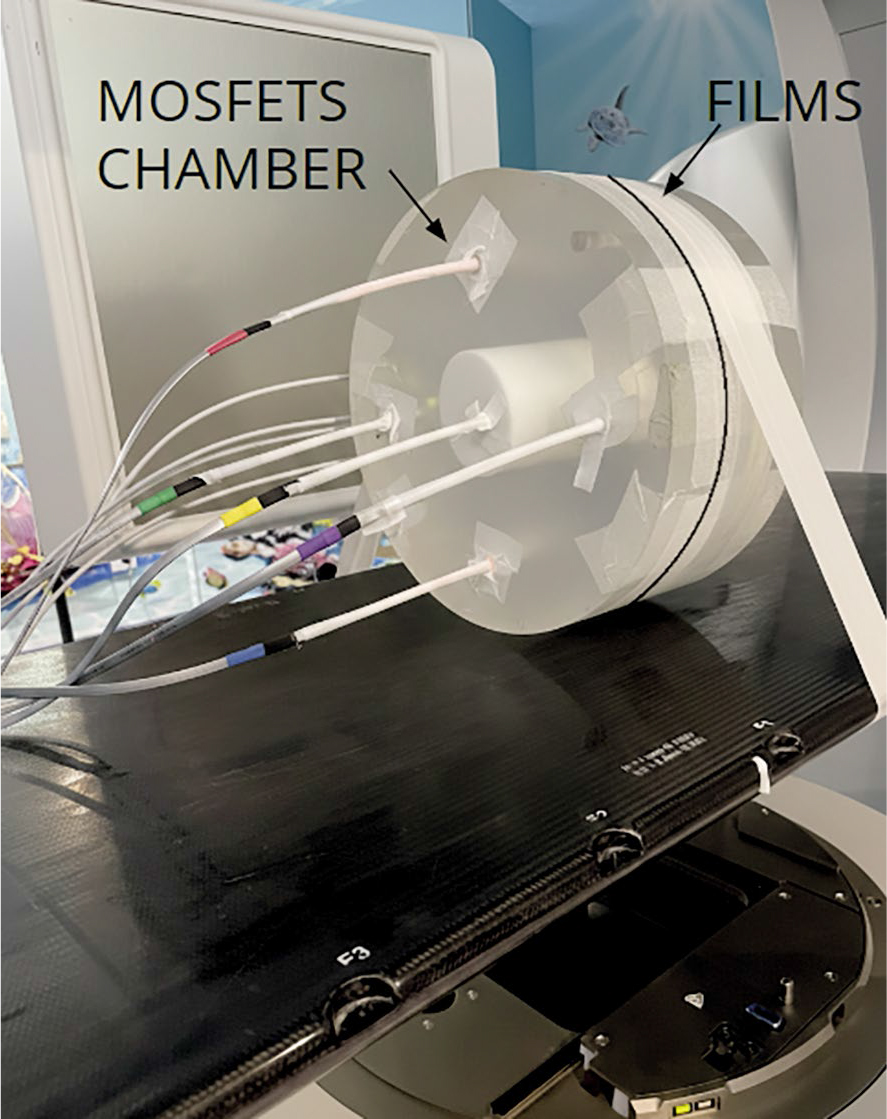
FIGURE 1.
Positions of LD-V1 films and MOSFETs in the CT dose index (CTDI) phantom.
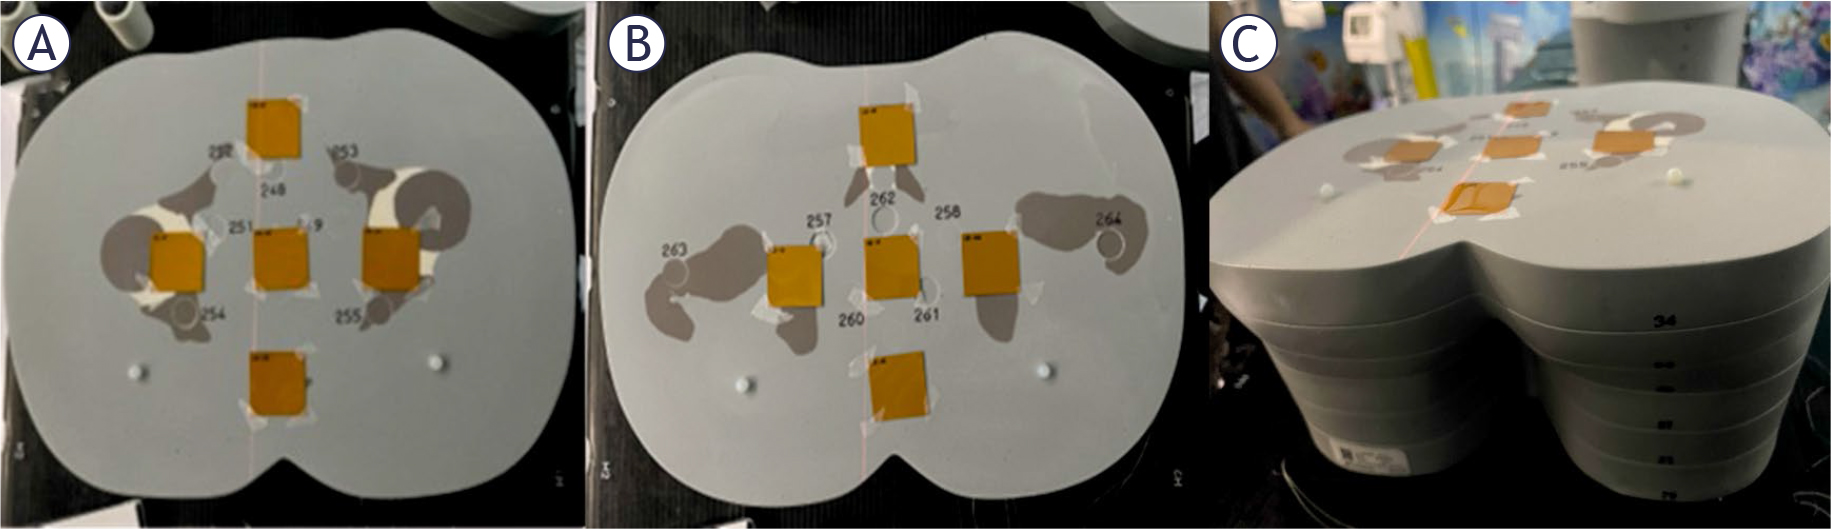
FIGURE 2.
Positions of LD-V1 films in the anthropomorphic phantom. Panel (A) shows film positions between slabs 33 and 34, and panel (B) between slabs 34 and 35. Panel (C) shows a side view of the phantom with films on top of slab 34 (corresponding to panel (A)).
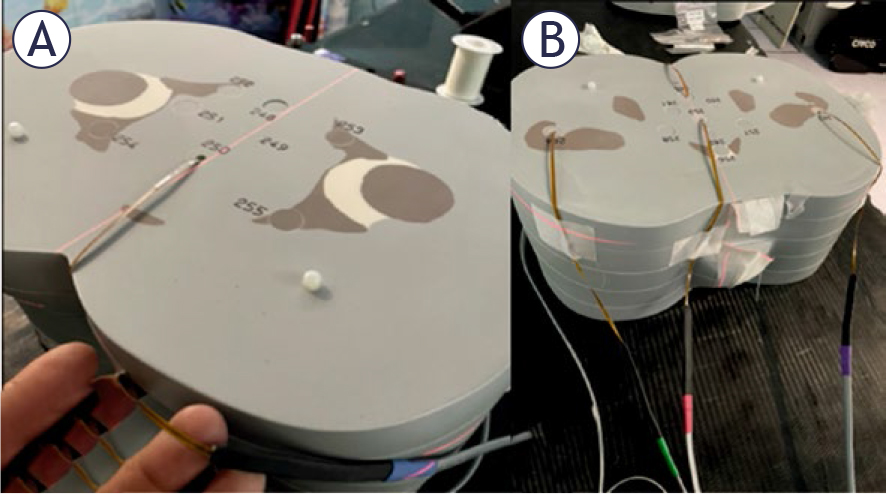
FIGURE 3.
Positions of MOSFET detectors in the anthropomorphic phantom. Left panel shows the detectors in slab number 34 (A) and the right panel in slab number 35 (B).
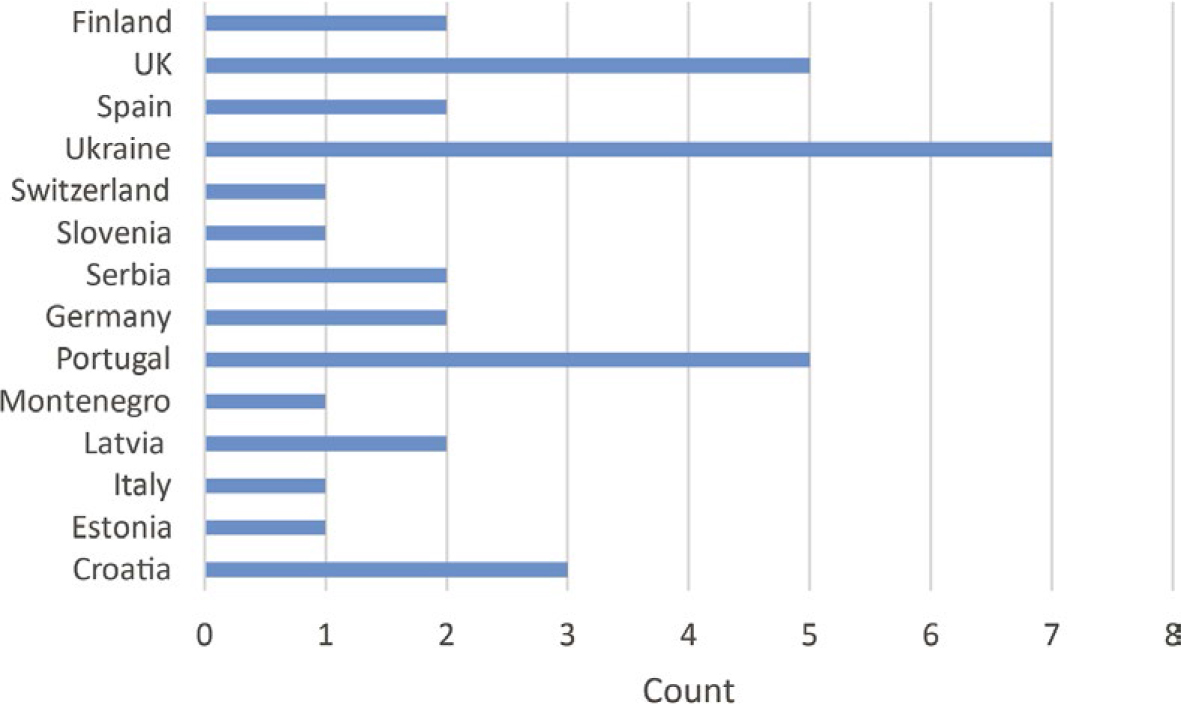
FIGURE 4.
Number of answers to the questionnaire among countries.
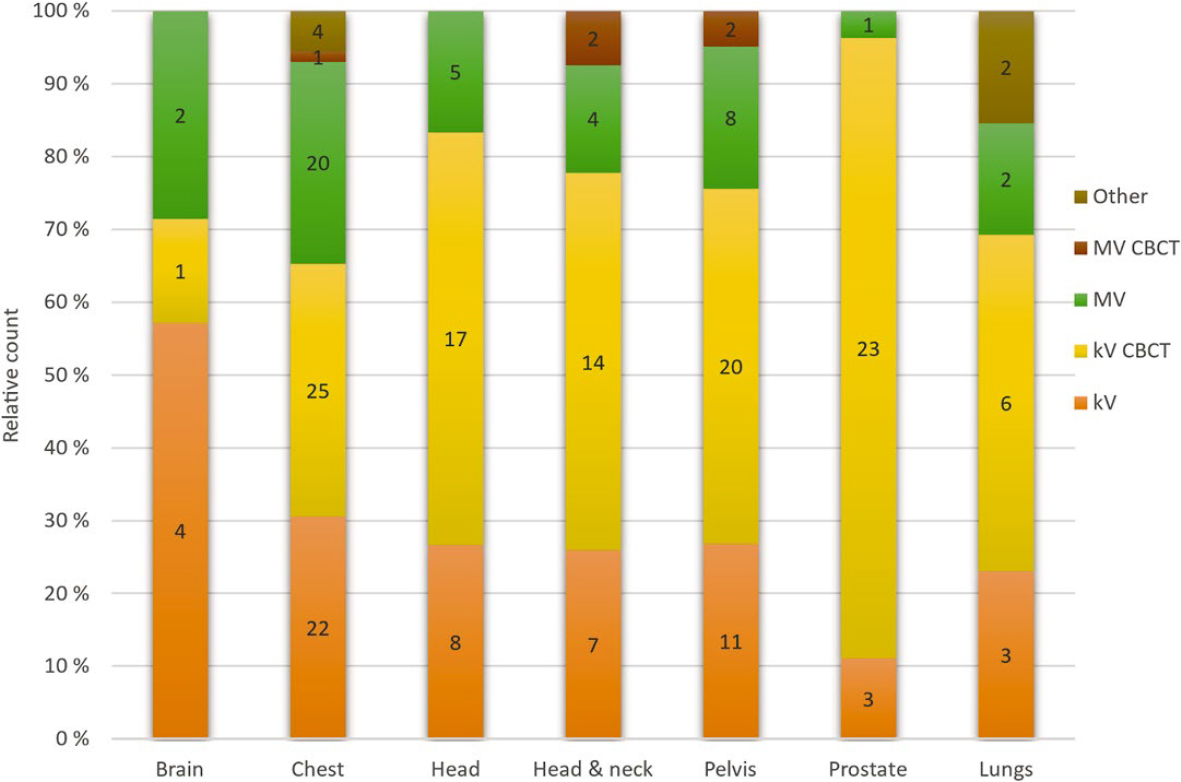
FIGURE 5.
Number and relative amount (%) of different imaging modalities site by site.
CBCT = cone-beam CT
TABLE 3.
Third quartiles of median reported weighted CT dose index (CTDIw values by country for pelvic imaging protocols
| Country | A | B | C | D | E | F | G | H | K | M | Median* |
|---|---|---|---|---|---|---|---|---|---|---|---|
| Third quartile CTDIw (mGy) | 17.8 | 16.9 | 22.0 | 16.0 | 37.6 | 15.6 | 11.0 | 17.7 | 21.7 | 22.0 | 17.7 |
TABLE 4.
Third quartiles of median reported CT dose index (CTDIw values by country for prostate imaging protocols
| Country | C | D | F | G | H | J | L | M | O | Median* |
|---|---|---|---|---|---|---|---|---|---|---|
| Third quartile CTDIw (mGy) | 32.2 | 16.0 | 19.7 | 11.0 | 13.5 | 3.7 | 16.0 | 9.6 | 11.3 | 13.5 |
TABLE 5.
Mean absorbed doses (mGy) for the pelvic protocols, per hospital and imaged fraction. Relative standard uncertainty is 16% for red bone marrow (RBM), 13% for other organs
| Pelvic protocols | Organ mean absorbed dose per imaged fraction (mGy) | |||||||
|---|---|---|---|---|---|---|---|---|
| Hospital | Sigmoid colon | Rectum | Prostate | Stomach | Bladder | Femora RBM | Pelvis RBM | Sacrum RBM |
| C | 39.8 | 38.1 | 34.1 | 1.3 | 39.2 | 31.9 | 35.9 | 36.2 |
| G1 | 14.4 | 16.5 | 14.5 | 0.1 | 16.3 | 10.5 | 12.9 | 14.6 |
| A3 | 13.5 | 20.8 | 15.1 | 0.0 | 20.1 | 7.7 | 10.0 | 5.7 |
| D1 | 22.6 | 32.8 | 27.4 | 0.0 | 30.9 | 13.2 | 17.5 | 14.6 |
| F1 | 10.1 | 14.4 | 12.3 | 0.0 | 13.7 | 5.9 | 7.9 | 7.2 |
| F6 | 11.8 | 13.3 | 11.6 | 0.1 | 13.1 | 7.1 | 9.6 | 10.4 |
| H1 (60 mA) | 24.6 | 29.8 | 25.9 | 0.1 | 28.2 | 13.7 | 19.0 | 23.0 |
| H1 (80 mA) | 15.7 | 19.4 | 18.5 | 0.0 | 18.7 | 10.0 | 13.3 | 16.0 |
| O2 | 16.9 | 23.9 | 20.2 | 0.0 | 22.5 | 9.9 | 13.2 | 12.0 |
TABLE 6.
Mean absorbed doses (mGy) for the prostate protocols, per hospital and imaged fraction. Relative standard uncertainty is 16% for red bone marrow (RBM), 13% for other organs
| Pelvic protocols | Organ mean absorbed dose per imaged fraction (mGy) | |||||||
|---|---|---|---|---|---|---|---|---|
| Hospital | Sigmoid colon | Rectum | Prostate | Stomach | Bladder | Femora RBM | Pelvis RBM | Sacrum RBM |
| G1 | 13.2 | 15.4 | 15.1 | 0.0 | 16.9 | 11.9 | 11.6 | 10.1 |
| M1 | 14.2 | 18.8 | 17.3 | 0.0 | 19.0 | 15.2 | 12.6 | 6.0 |
| M4 Narrow | 1.5 | 3.9 | 3.9 | 0.0 | 3.7 | 3.0 | 1.7 | 0.6 |
| M4 Wide | 5.9 | 6.5 | 5.8 | 0.0 | 6.6 | 5.4 | 4.4 | 4.3 |
| F2 | 13.1 | 22.6 | 26.1 | 0.0 | 25.9 | 14.7 | 12.5 | 4.8 |
| J | 2.3 | 4.4 | 4.8 | 0.0 | 4.7 | 2.6 | 2.2 | 0.8 |
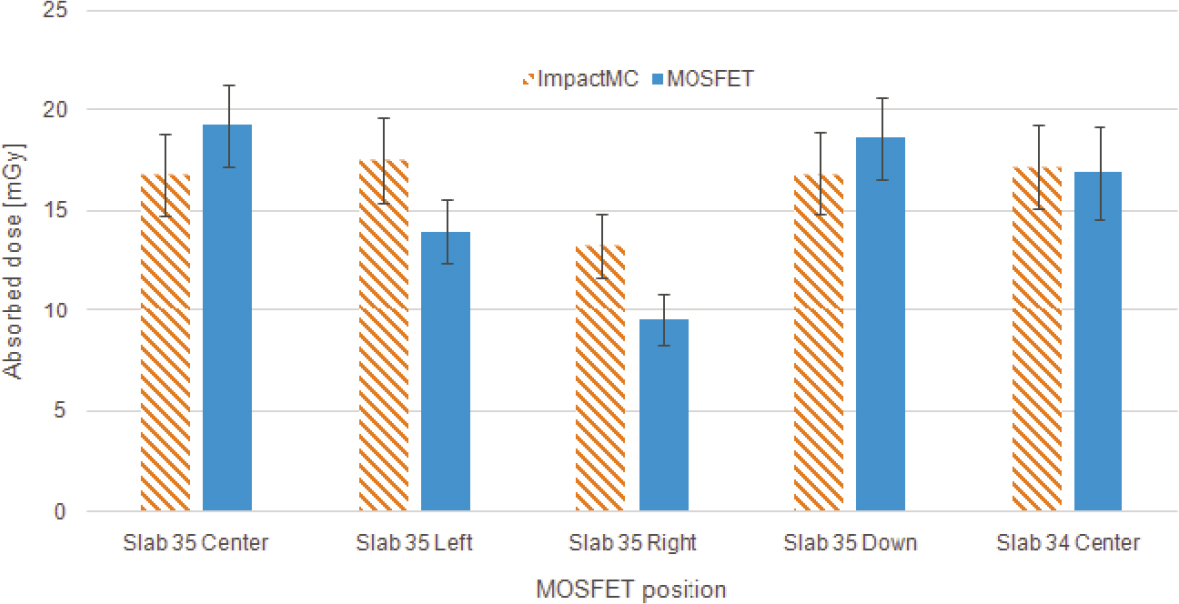
FIGURE 6.
Comparison of MOSFET measurements in anthropomorphic phantom with simulated doses.
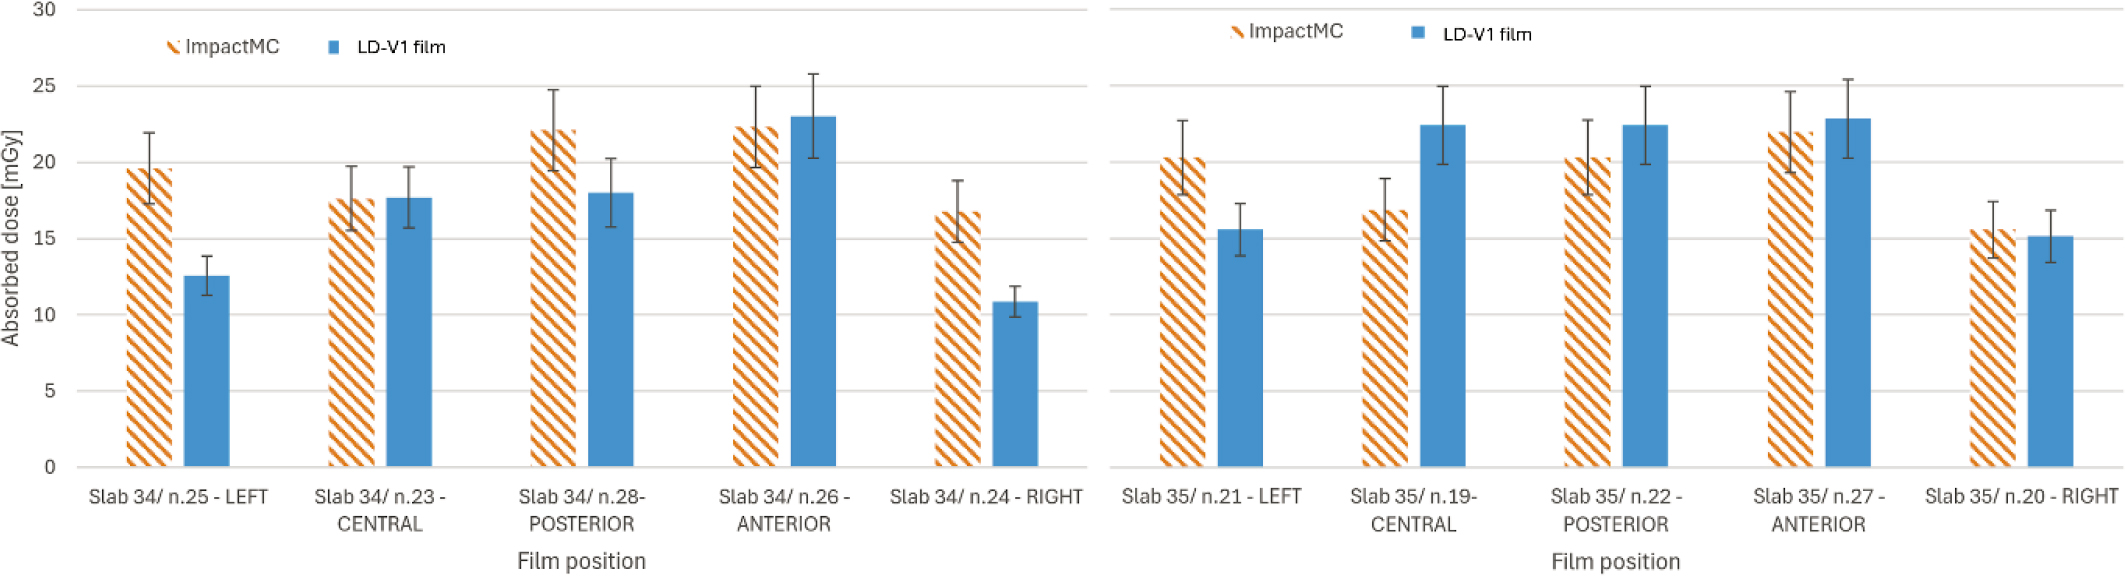
FIGURE 7.
Comparison of LD-V1 film measurements in anthropomorphic phantom with simulated doses. Data for slab number 34 is shown in the left panel, for slab number 35 in the right panel.