
FIGURE 1.
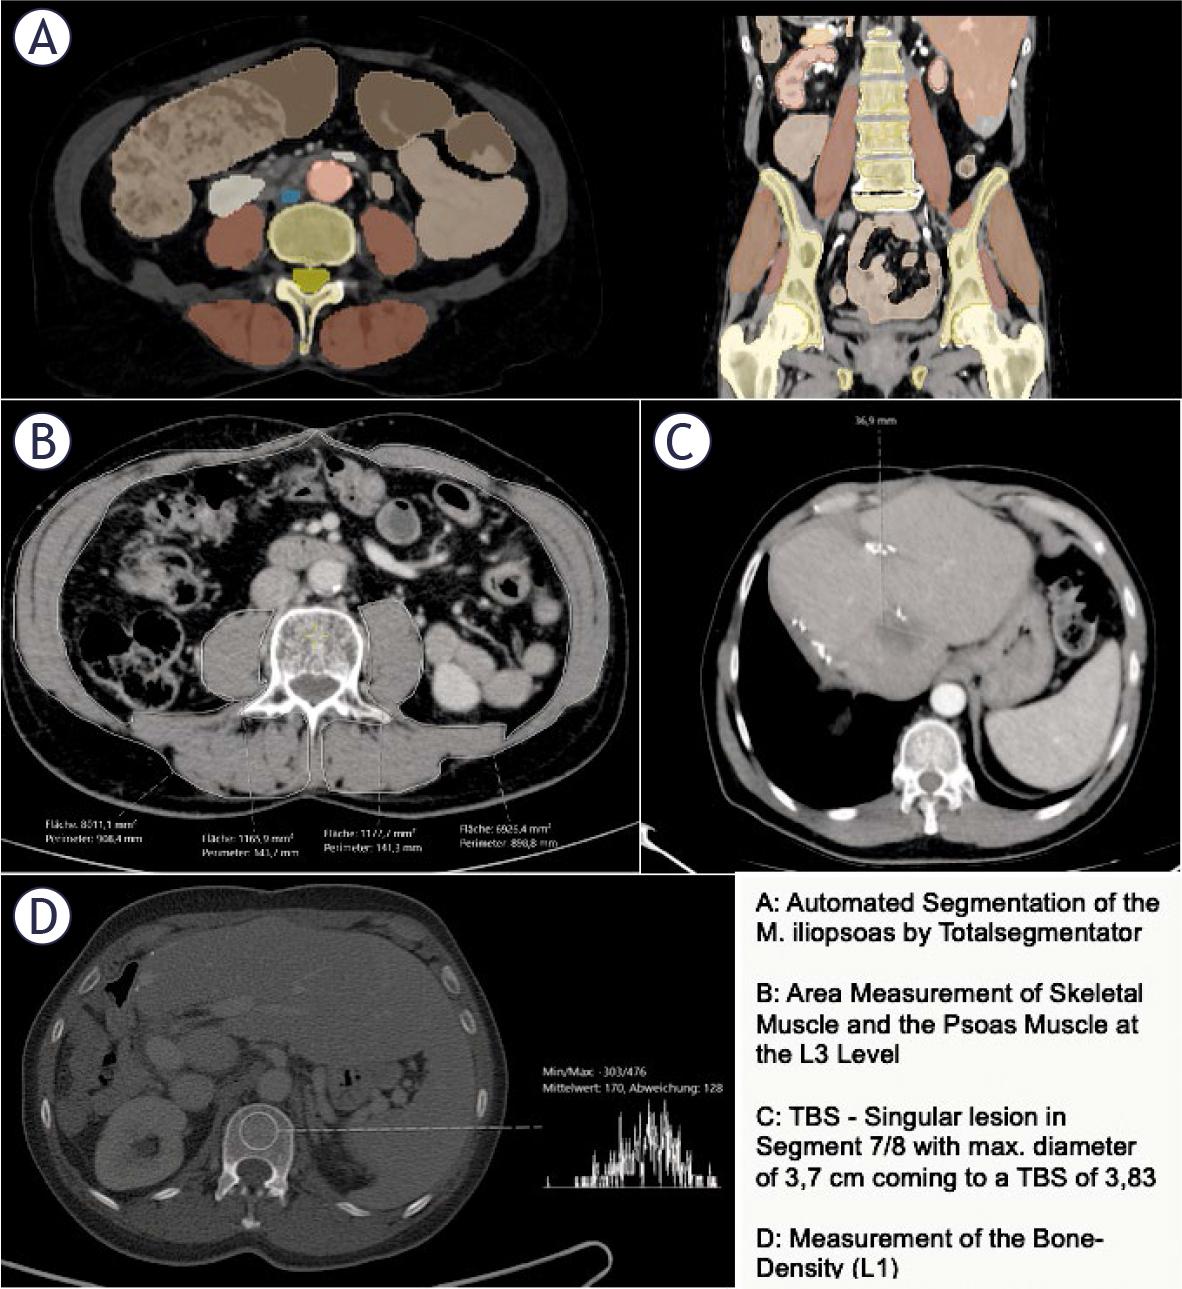
FIGURE 2.
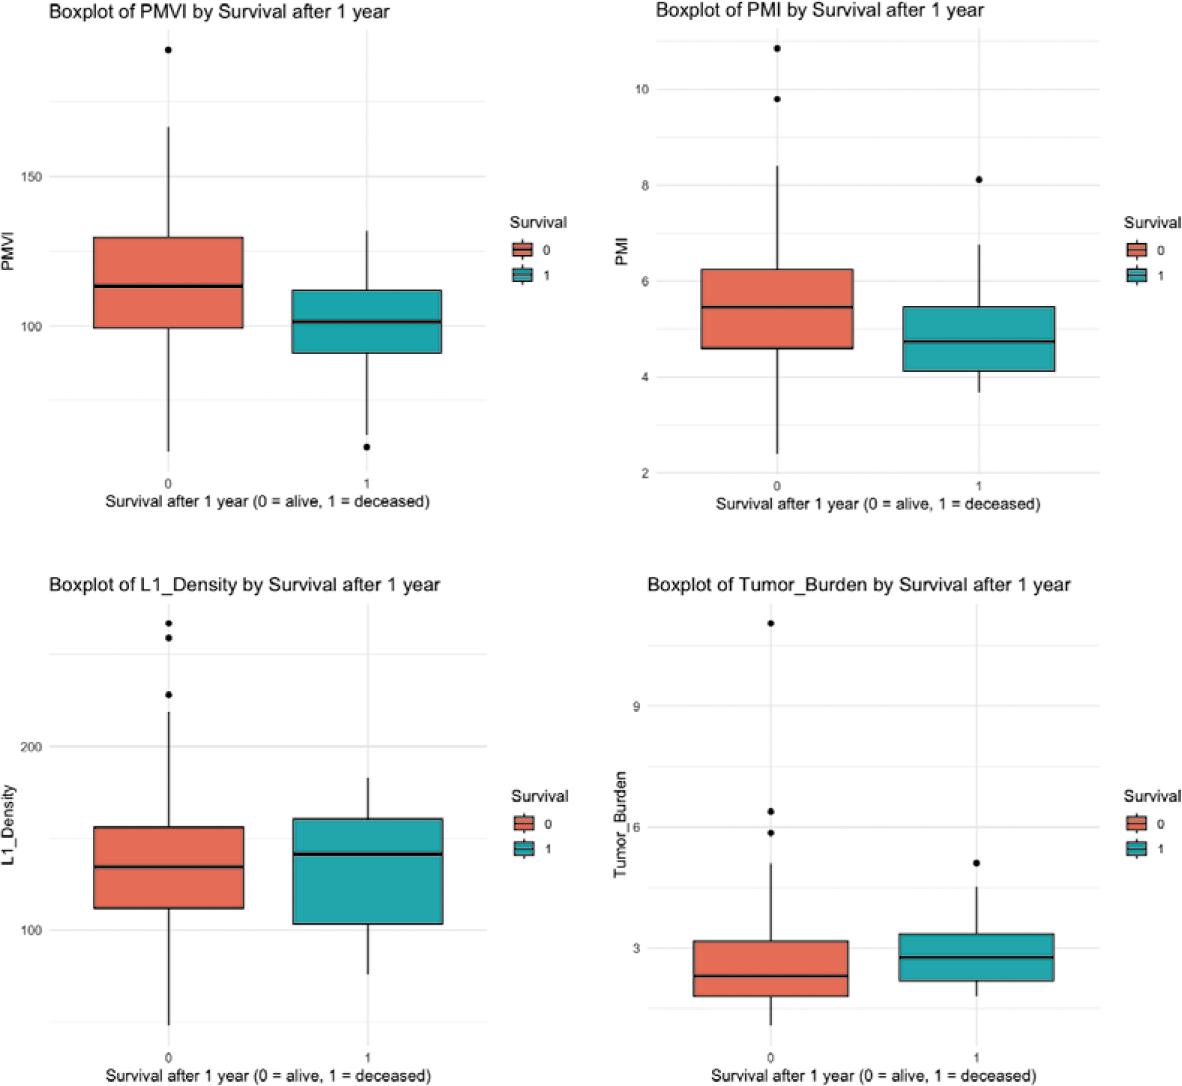
FIGURE 3.

Univariate and multivariate Cox regression analysis of baseline clinical, psoas muscle volume index (PMVI), PMI = psoas muscle index (PMI), skeletal muscle index (SMI), L1-density and tumor burden score (TBS)
| Covariate | Univariate | Multivariate | ||||
|---|---|---|---|---|---|---|
| HR | 95% CI | P-value | HR | 95% CI | P-value | |
| Age | 1.10 | 1.03–1.18 | 0.005 | 1.13 | 1.03–1.24 | 0.013 |
| Gender (female) | 1.58 | 0.46–5.39 | 0.467 | 3.30 | 0.56–19.5 | 0.189 |
| ECOG performance status | 1.88 | 0.5–7.00 | 0.347 | 1.39 | 0.33–5.96 | 0.654 |
| Temporal presentation CRLM (synchronous) | 0.61 | 0.19–2.00 | 0.417 | 1.33 | 0.30–5.90 | 0.705 |
| Chemotherapy (yes) | 1.2 | 032–4.52 | 0.789 | 2.79 | 0.56–13.9 | 0.209 |
| PMVI | 0.97 | 0.95–0.99 | 0.049 | 0.99 | 0.94–1.03 | 0.509 |
| PMI | 0.78 | 0.51–1.21 | 0.273 | 1.53 | 0.62–3.77 | 0.358 |
| SMI | 0.94 | 0.87–1.01 | 0.159 | 0.94 | 0.80–1.10 | 0.417 |
| L1 -density | 1.00 | 0.98–1.01 | 0.502 | 1.01 | 0.99–1.03 | 0.487 |
| TBS | 1.13 | 0.83–1.56 | 0.440 | 1.42 | 0.91–2.23 | 0.124 |
Baseline characteristics of the cohort
| Variable | All patients |
|---|---|
| Age, years, median (IQR) | 62 (55–71) |
| Sex, n (%) | |
| Female | 25 (28%) |
| Male | 63 (72%) |
| Temporal presentation n (%) | |
| Synchronous | 58 (66%) |
| Metachronous | 30 (34%) |
| Prior hepatic resection n (%) | |
| Yes | 72 (82%) |
| No | 16 (18%) |
| Mean time from CRC diagnosis to ablation, years, median (IQR) | 2 (1–4) |
| Mean CRLM count, median (IQR) | 1 (1–1) |
| Mean diameter of largest CRLM, cm, median (IQR) | 2 (1.5–2.6) |
Survival groups after thermal ablation
| Variable | Alive (first year) | Deceased (first year) |
|---|---|---|
| PMVI, cm3/m3, median (IQR) | 113.3 (99.17–129.55) | 101.34 (90.93–111.81) |
| PMI, cm2/m2, median (IQR) | 5.46 (4.6–6.24) | 4.74 (4.12–5.46) |
| SMI, cm2/m2, median (IQR) | 43.78 (40.77–51.96) | 40.74 (37.73–48.48) |
| Ll-density, HU, median (IQR) | 134.5 (112–156) | 141.5 (103.25–160.5) |
| Tumor burden score, median (IQR) | 2.3 (1.8–3.17) | 2.77 (2.19–3.35) |
t-Test/Mann-Whitney-U-Test to show differences in survival groups
| Variable | Test | Test Statistic (t/W) | p-Value | Result |
|---|---|---|---|---|
| PMVI | t-Test (Welch) | t = 2.14 | 0.048 | Significant |
| PMI | Mann-Whitney U Test | W = 519 | 0.137 | Not significant |
| SMI | Mann-Whitney U Test | W = 521 | 0.107 | Not significant |
| L1-Density | Mann-Whitney U Test | W = 415.5 | 0.925 | Not significant |
| TBS | Mann-Whitney U Test | W = 308.5 | 0.182 | Not significant |