
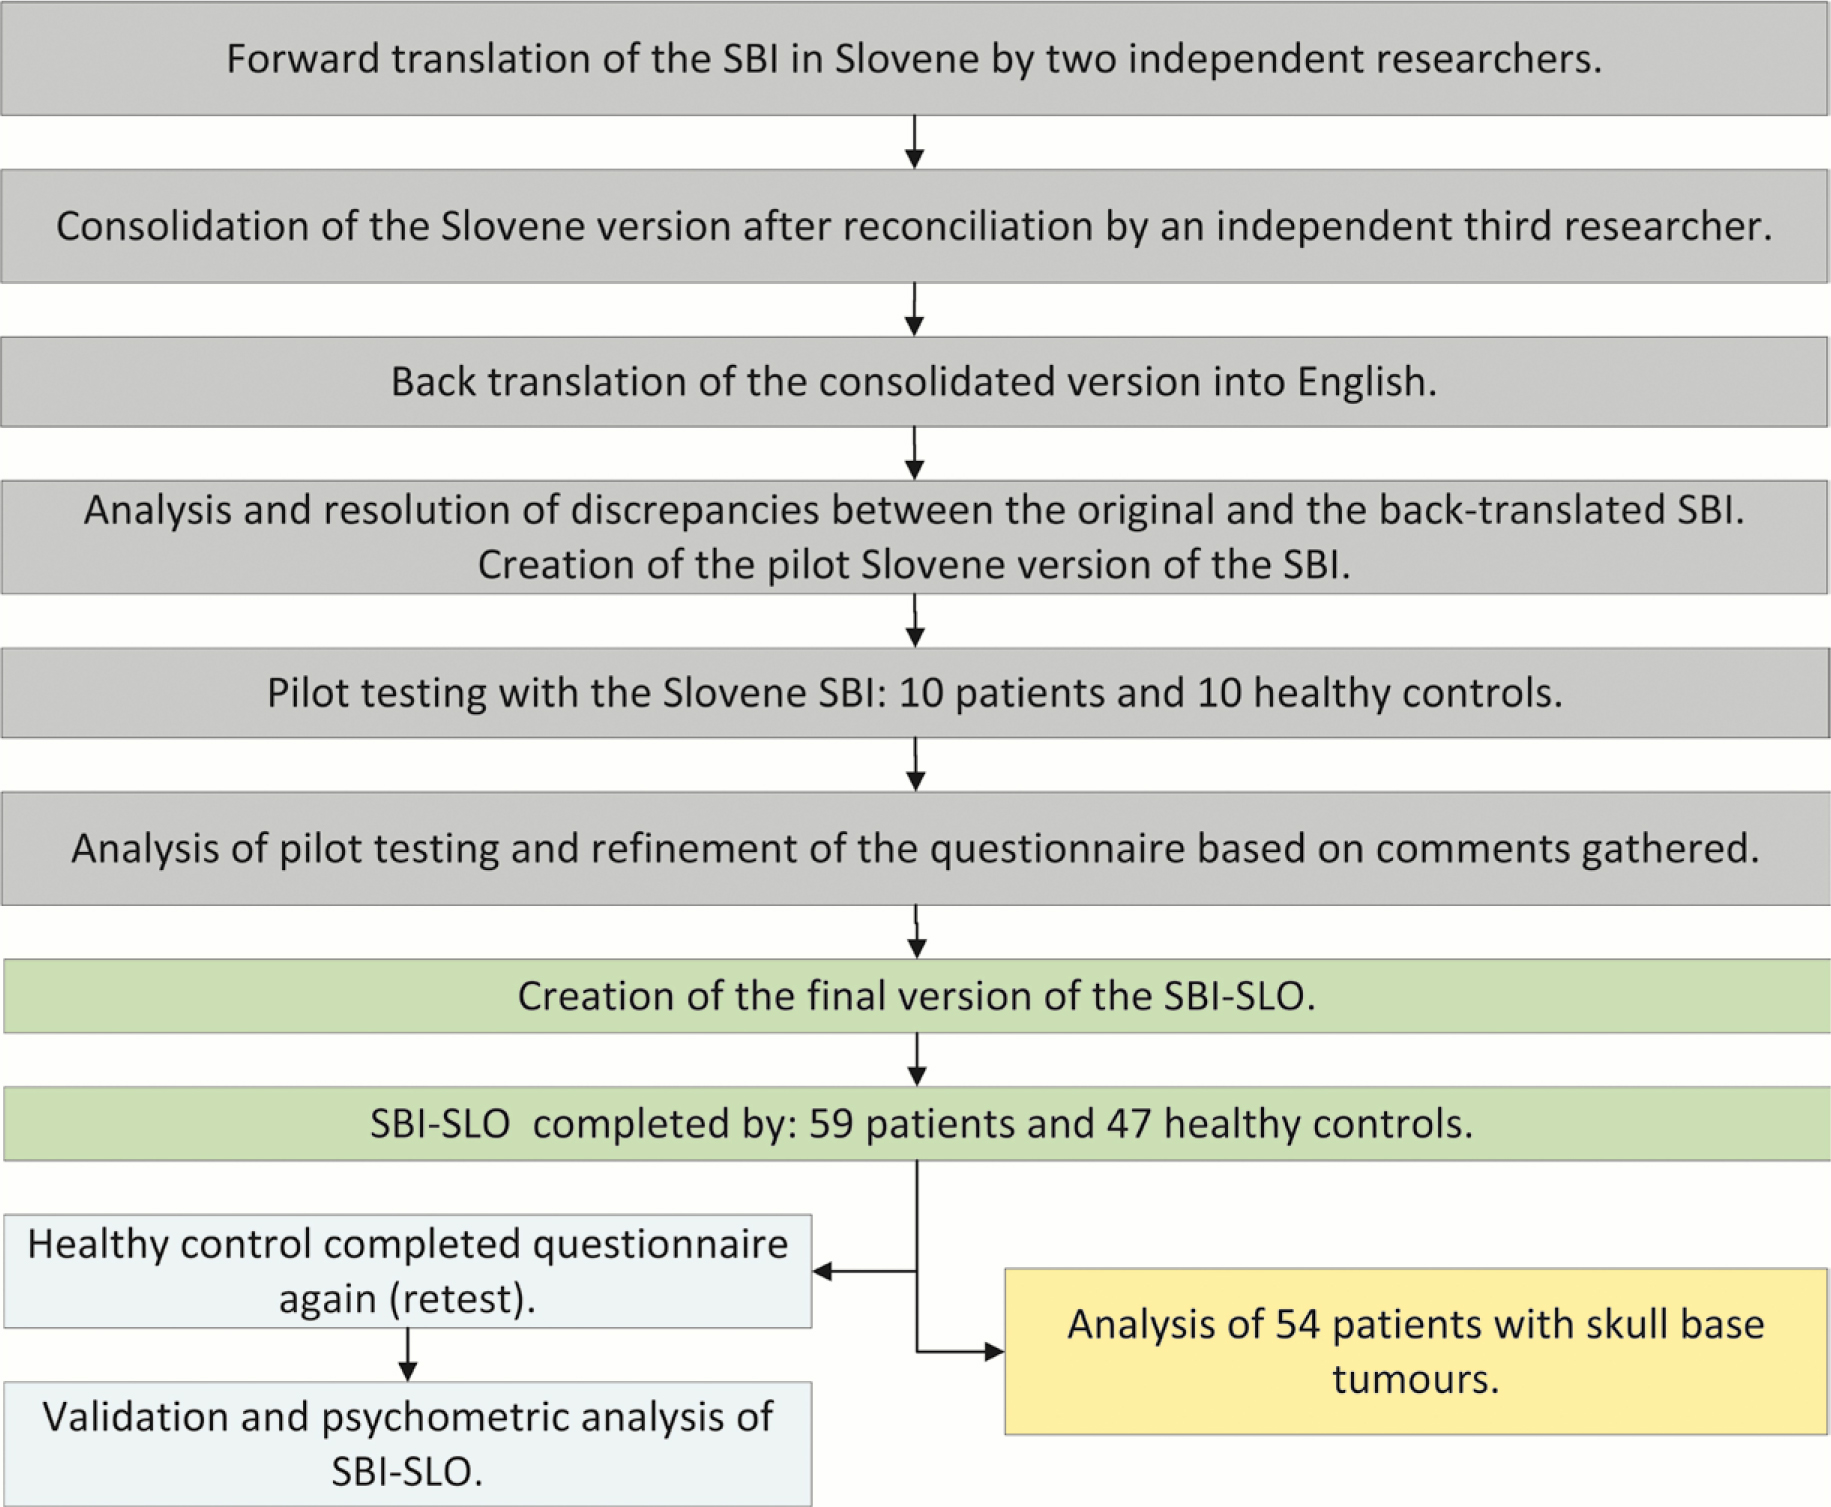
FIGURE 1.
Workflow diagram of the study.
SBI = skull base inventory; SBI-SLO = Slovenian version of SBI
Table 1.
Tumour types in the studied group
| Tumour type | n = 54 | % |
|---|---|---|
| Pituitary macroadenomab | 17 | 31.5 |
| Sinonasal cancerm | 12 | 22.2 |
| Nasopharyngeal cancerm | 4 | 7.4 |
| Olfactory meningiomab | 3 | 5.6 |
| Tuberculum sellae meningiomab | 3 | 5.6 |
| Metastasism | 2 | 3.7 |
| Petroclival meningiomab | 2 | 3.7 |
| Sellar meningiomab | 2 | 3.7 |
| Sphenoid sinus meningoencephaloceleb | 2 | 3.7 |
| Clival chordomam | 1 | 1.9 |
| Craniopharyngiomab | 1 | 1.9 |
| Infratemporal fossa schwannomab | 1 | 1.9 |
| Optic nerve germinomam | 1 | 1.9 |
| Rathke cleft cystb | 1 | 1.9 |
| Sellar teratomab | 1 | 1.9 |
| Skull base hemangiomab | 1 | 1.9 |
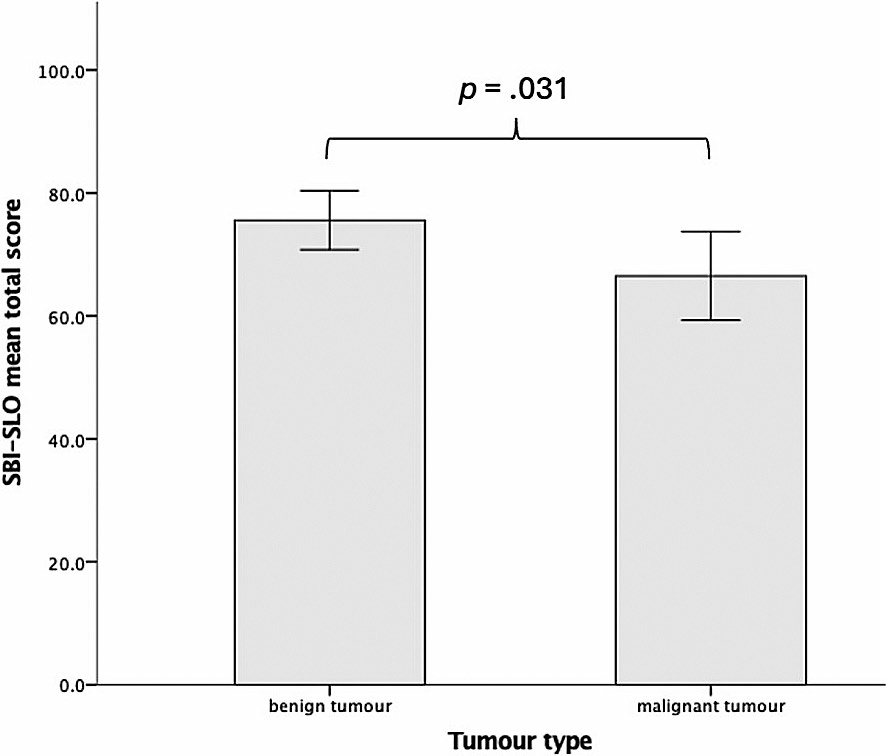
FIGURE 2.
Simple bar chart depicting the differences in Slovenian version of skull base inventory (SBI-SLO) mean total score between benign and malignant tumour group.
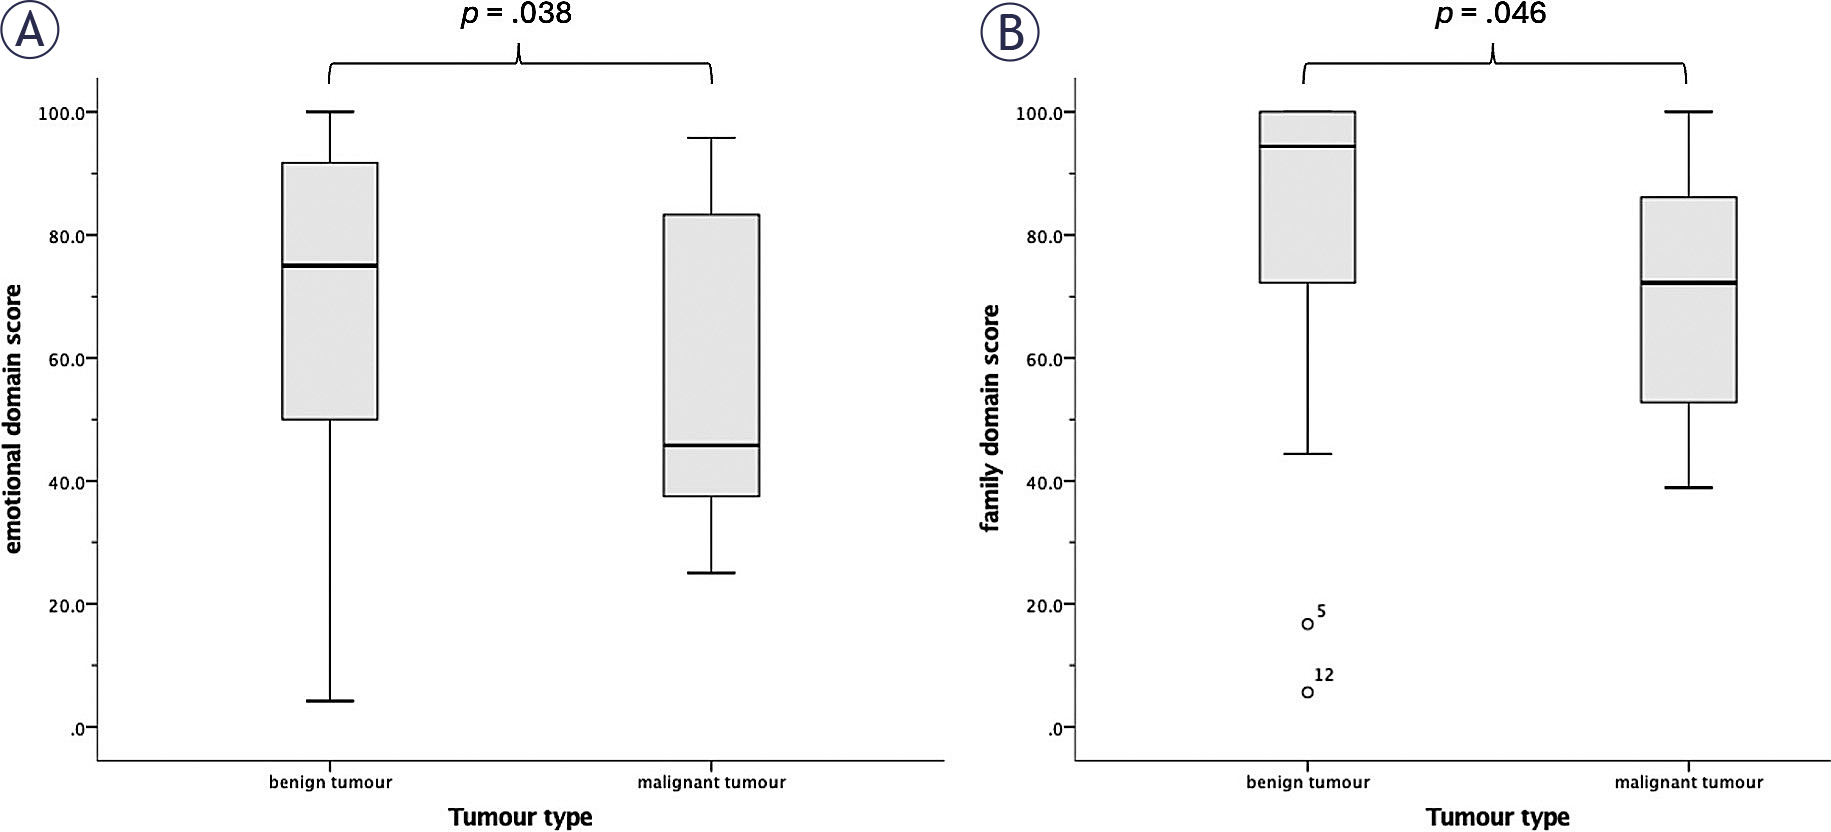
FIGURE 3.
Boxplots of comparisons between patients with benign and malignant skull base tumours in emotional (A) and family domain score (B) of Slovenian version of Skull base inventory.
TABLE 2.
Differences in scores of Slovenian version of Skull base inventory between patients with benign and malignant skull base tumours
| Benign tumour group (n = 35) | Malignant tumour group (n = 19) | p-value | |
|---|---|---|---|
| Total score | 75.6 ± 14.0 | 66.5 ± 15.0 | p = .031* |
| cognitive | 83.3 | 75.0 | p = .102** |
| emotional | 75.0 | 45.8 | p = .038** |
| family | 94.4 | 72.2 | p = .046** |
| financial | 83.3 | 66.7 | p = .058** |
| social | 65.4 ± 23.4 | 61.8 ± 21.7 | p = .591* |
| spiritual | 91.7 | 83.3 | p = .329** |
| endocrine | 87.5 | 87.5 | p = .862** |
| nasal | 67.3 ± 20.5 | 55.0 ± 24.5 | p = .056* |
| neurologic | 75.0 | 62.5 | p = .125** |
| visual | 83.3 | 70.8 | p = .075** |
| other | 75.0 | 58.3 | p = .008** |