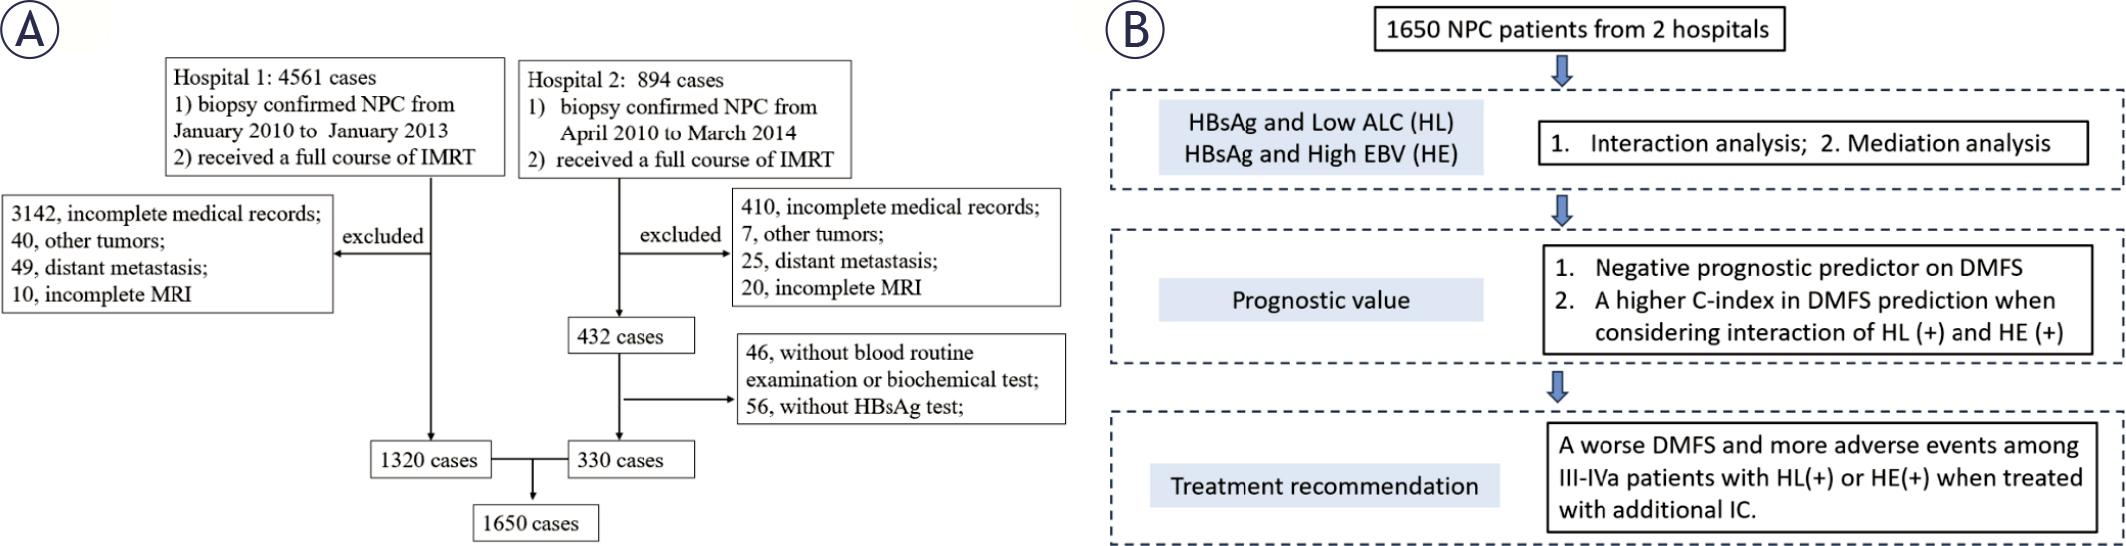
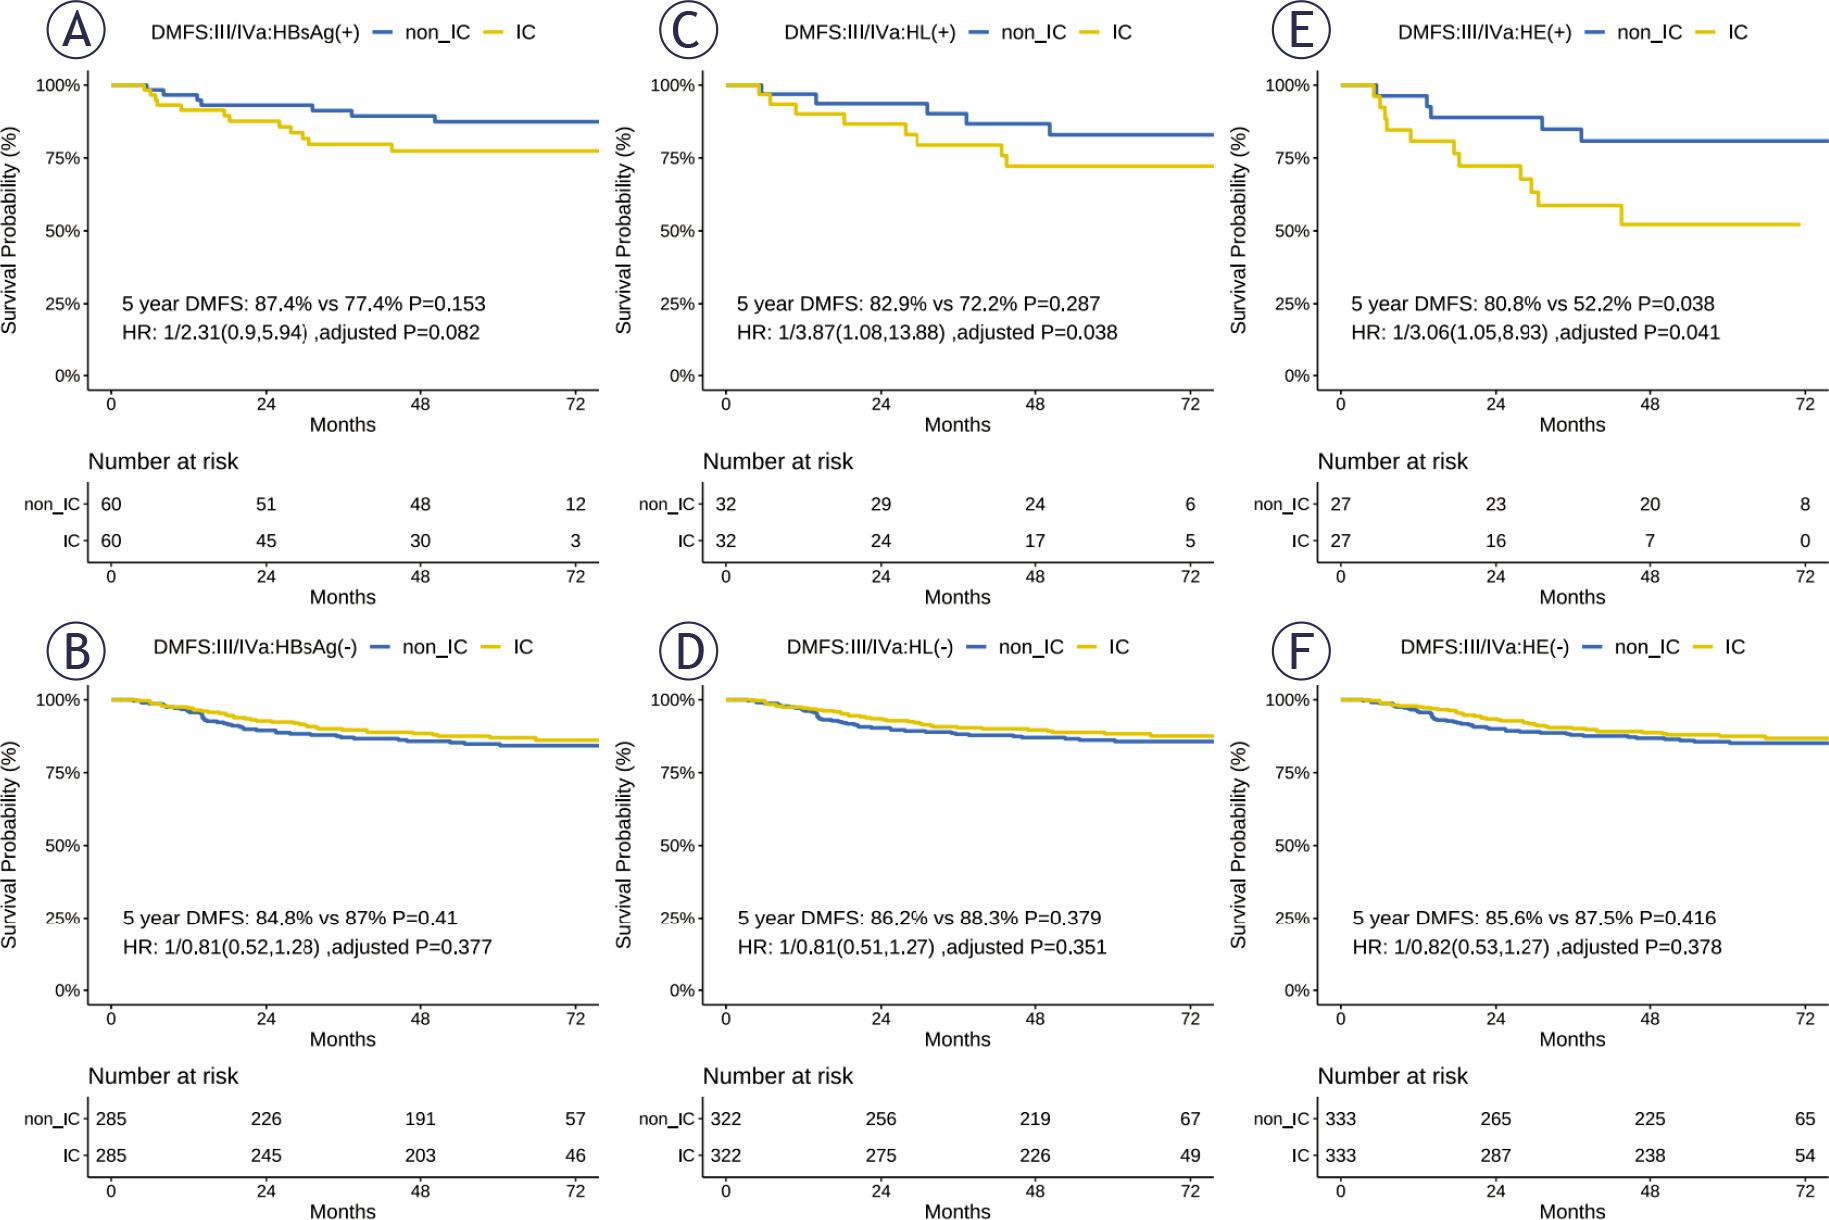
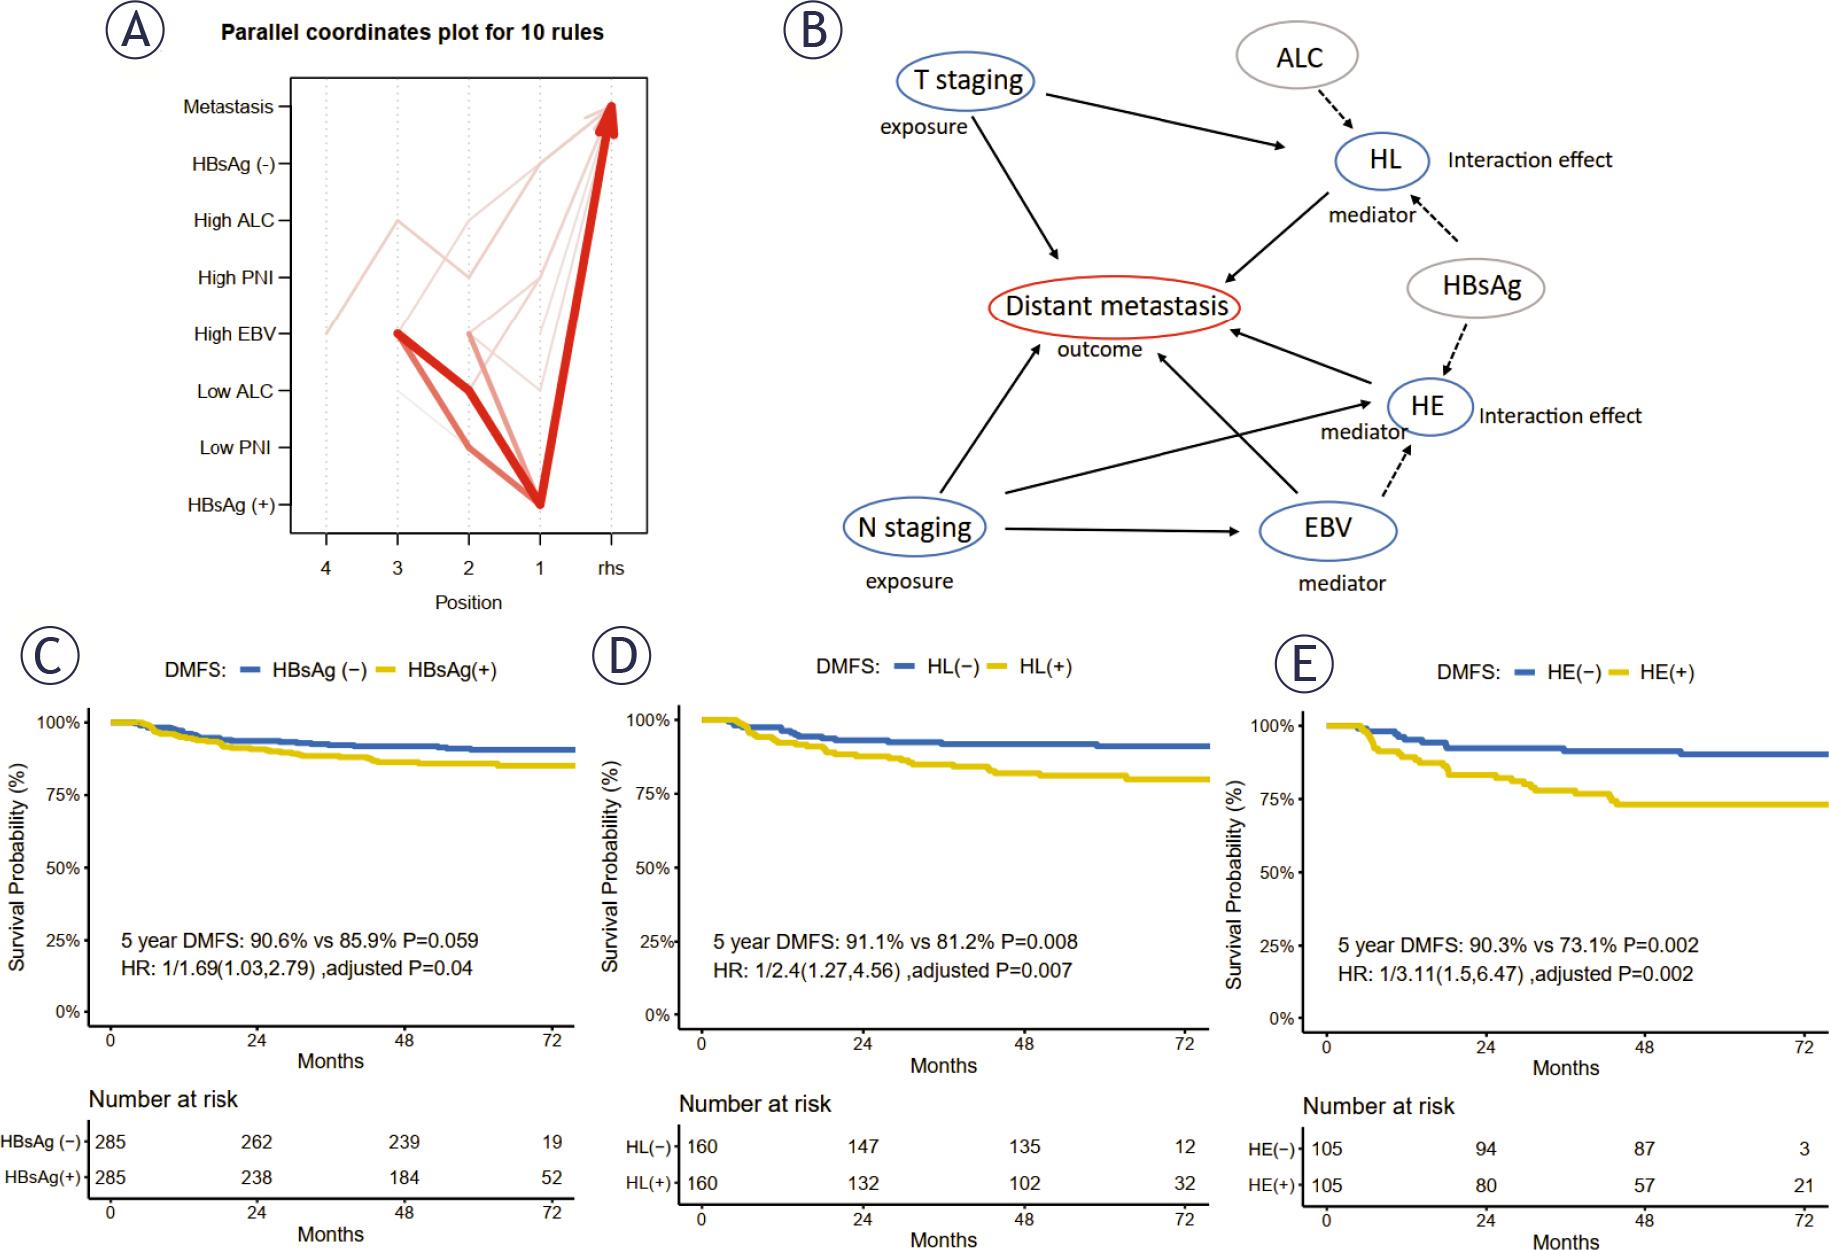
Have a personal or library account? Click to login
Interactions between hematological biomarkers of virus infection and immune cells in mediating distant metastasis in nasopharyngeal carcinoma: insights into prognosis and induction chemotherapy administration Cover

Interactions between hematological biomarkers of virus infection and immune cells in mediating distant metastasis in nasopharyngeal carcinoma: insights into prognosis and induction chemotherapy administration

Open Access
|Feb 2026

Figures & Tables

Figure 1.

Patient enrolment and study flowchart. (A) Patient enrolment flowchart from the two hospitals. (B) Statistical analysis flowchart.
Note 1. The time involved in the exclusion criteria is set at the time before treatment. As all enrolled patients in Hospital 1 had data from routine blood examinations, biochemical tests, and HBsAg tests, no other patients were further excluded from Hospital 1.
Note 2. Complete MRI included scanning of the nasopharynx and neck regions, which can be used for restaging assessment of the 8th TNM staging system.
Note 3. Low ALC indicated an absolute lymphocyte count ≤ 1.9 ×10⁹/L. High EBV indicated plasma EBV DNA level > 4 ×10³ copies/mL.
ALC = absolute lymphocyte count; HBsAg = hepatitis B surface antigen; HE = interaction between HBsAg (+) and high EBV; HL = interaction between HBsAg (+) and low ALC; IC = induction chemotherapy; MRI = magnetic resonance imaging; OS = overall survival; non_IC = treated without induction chemotherapy; + = positive; - = negative
Patient enrolment and study flowchart. (A) Patient enrolment flowchart from the two hospitals. (B) Statistical analysis flowchart. Note 1. The time involved in the exclusion criteria is set at the time before treatment. As all enrolled patients in Hospital 1 had data from routine blood examinations, biochemical tests, and HBsAg tests, no other patients were further excluded from Hospital 1. Note 2. Complete MRI included scanning of the nasopharynx and neck regions, which can be used for restaging assessment of the 8th TNM staging system. Note 3. Low ALC indicated an absolute lymphocyte count ≤ 1.9 ×10⁹/L. High EBV indicated plasma EBV DNA level > 4 ×10³ copies/mL. ALC = absolute lymphocyte count; HBsAg = hepatitis B surface antigen; HE = interaction between HBsAg (+) and high EBV; HL = interaction between HBsAg (+) and low ALC; IC = induction chemotherapy; MRI = magnetic resonance imaging; OS = overall survival; non_IC = treated without induction chemotherapy; + = positive; - = negative

Figure 2.

Association rules, directed acyclic graph, and prognostic value of HBsAg, EBV, and ALC on DMFS. (A) The top 10 association rules related to HBsAg (+) demonstrated strong associations among high EBV, low ALC, and HBsAg (+) with distant metastasis in patients with NPC. (B) The directed acyclic graph (DAG) shows the associations among variables. Significant interactions were observed between HBsAg and plasma EBV DNA load, HBsAg, and ALC, defined as HE and HL. In the mediation analysis, EBV and HE mediated the effect of N staging on distant metastasis, and HL mediated the effect of T staging on distant metastasis. After 1:1 random matched analysis (C–E), HBsAg (+), HL (+), and HE (+) were the independent adverse prognosticators of DMFS in patients with NPC.
Note 1. The width of the curves represents the occurrence frequency of each association rule. X-axis: the number of the position indicates the number of variables involved in the rule. Rhs was set as distant metastasis. The plasma EBV DNA load classification is divided by the cut-off of 4 ×10³ copies/mL. The classification of ALC and PNI is divided by the cut-off with its median value. The original rules are presented in Supplementary Table 1.
Note 2. Supplementary Tables 2 and 4 show the interaction and mediation analyses, respectively.
Note 3. The 1:1 random matched survival analyses were performed with the match factors of T and N stages, plasma EBV DNA, and age group. The P values were calculated using a log-rank test.
ALC = absolute lymphocyte count; DMFS = distant metastasis-free survival; EBV = pre-treatment plasma EBV DNA level; HBsAg = hepatitis B surface antigen; HE = interaction between HBsAg (+) and high EBV; HL = interaction between HBsAg (+) and low ALC; lhs = left-hand side; PNI = prognostic nutritional index; rhs = right-hand side; WBC = white blood cell; +, positive; -, negative
Association rules, directed acyclic graph, and prognostic value of HBsAg, EBV, and ALC on DMFS. (A) The top 10 association rules related to HBsAg (+) demonstrated strong associations among high EBV, low ALC, and HBsAg (+) with distant metastasis in patients with NPC. (B) The directed acyclic graph (DAG) shows the associations among variables. Significant interactions were observed between HBsAg and plasma EBV DNA load, HBsAg, and ALC, defined as HE and HL. In the mediation analysis, EBV and HE mediated the effect of N staging on distant metastasis, and HL mediated the effect of T staging on distant metastasis. After 1:1 random matched analysis (C–E), HBsAg (+), HL (+), and HE (+) were the independent adverse prognosticators of DMFS in patients with NPC. Note 1. The width of the curves represents the occurrence frequency of each association rule. X-axis: the number of the position indicates the number of variables involved in the rule. Rhs was set as distant metastasis. The plasma EBV DNA load classification is divided by the cut-off of 4 ×10³ copies/mL. The classification of ALC and PNI is divided by the cut-off with its median value. The original rules are presented in Supplementary Table 1. Note 2. Supplementary Tables 2 and 4 show the interaction and mediation analyses, respectively. Note 3. The 1:1 random matched survival analyses were performed with the match factors of T and N stages, plasma EBV DNA, and age group. The P values were calculated using a log-rank test. ALC = absolute lymphocyte count; DMFS = distant metastasis-free survival; EBV = pre-treatment plasma EBV DNA level; HBsAg = hepatitis B surface antigen; HE = interaction between HBsAg (+) and high EBV; HL = interaction between HBsAg (+) and low ALC; lhs = left-hand side; PNI = prognostic nutritional index; rhs = right-hand side; WBC = white blood cell; +, positive; -, negative

FIGURE 3.

The 5-year DMFS among patients treated with and without induction chemotherapy.
Note 1. The 1:1 random matched survival analysis was performed among stage III–IVa patients, with the match factors of T and N stages, plasma EBV DNA, and age group. The P values were calculated using a log-rank test.
DMFS = distant metastasis-free survival; HBsAg = hepatitis B surface antigen; HE = interaction between HBsAg (+) and high EBV; HL = interactions between HBsAg (+) and low ALC; IC = induction chemotherapy; non_IC = treated without induction chemotherapy; + = positive; - = negative
The 5-year DMFS among patients treated with and without induction chemotherapy. Note 1. The 1:1 random matched survival analysis was performed among stage III–IVa patients, with the match factors of T and N stages, plasma EBV DNA, and age group. The P values were calculated using a log-rank test. DMFS = distant metastasis-free survival; HBsAg = hepatitis B surface antigen; HE = interaction between HBsAg (+) and high EBV; HL = interactions between HBsAg (+) and low ALC; IC = induction chemotherapy; non_IC = treated without induction chemotherapy; + = positive; - = negative

Consideration of interaction effect of HL and HE in distant-metastasis-free survival (DMFS) prediction

VariablesDMFSVariablesDMFS
HR (95% CI)PHR (95% CI)P
Step 1:Without interaction item Step 2:Interaction consideration
  NA   HBsAg (+) × Low ALC (HL)2.56 (1.14–5.76)0.023
  NA   HBsAg (+) × High EBV (HE)2.16 (1.02–4.58)0.044
  HBsAg (-/+)1.12 (0.79–1.6)0.524  HBsAg (-/+)0.38 (0.17–0.88)0.024
  NA   ALC (≤ 1.9 vs. > 1.9)*0.94 (0.69–1.27)0.692
  EBV (≤ 4 vs > 4)#1.56 (1.16–2.08)0.003  EBV (≤ 4 vs. > 4)#1.34 (0.97–1.84)0.075
  T stage   T stage
    T11 (reference)     T11 (reference)
    T21.61 (0.94–2.76)0.084    T21.66 (0.97–2.84)0.066
    T31.62 (1.04–2.52)0.032    T31.62 (1.04–2.52)0.034
    T42.62 (1.67–4.1)< 0.001    T42.63 (1.68,4.13)< 0.001
  N stage   N stage
    N01 (reference)     N01 (reference)
    N12.01 (1.18–3.43)0.010    N12.01 (1.18–3.43)0.010
    N23.25 (1.83–5.8)< 0.001    N23.34 (1.87–5.95)< 0.001
    N35.09 (2.69–9.61)< 0.001    N35.28 (2.8–9.97)< 0.001

The changes in the hazard ratio of tumor staging when HL and HE are considered as mediators in the multivariate Cox regression model on distant-metastasis-free survival (DMFS)

MediatorExposureUnadjusted for mediatorAdjusted for mediatorMediation proportion %
HR (95%CI)PHR (95% CI)PHR (95%CI)P
HL (+)T stage
T1-21 (Reference)0.0041 (Reference)0.006
T3-41.59 (1.16-2.18) 1.56 (1.14-2.15) 7.58 (0.538-26)0.032
EBVN stage
N0-11 (Reference)< 0.0011 (Reference)< 0.001
N1-22.35 (1.78-3.11) 2.01 (1.51-2.69) 19.3 (7.28-36)0.004
HE (+)N stage
N0-11 (Reference)< 0.0011 (Reference)< 0.001
N1-22.01 (1.51-2.69) 2.05 (1.53-2.74) 5.39 (0.37-14.0)0.032

Basic patient characteristics and univariate analysis

VariablesTotalHBsAg (-)HBsAg (+)Chi-squareDMFS
(n = 1650)(n = 1365)(n = 285)P value5-yearLog-Rank P
Age group < 0.001 0.548
  ≤ 45821 (49.8%)651 (47.7%)170 (59.6%) 87.06
  > 45829 (50.2%)714 (52.3%)115 (40.4%) 85.87
Sex 0.035 0.424
  Male1221 (74.0%)996 (73.0%)225 (78.9%) 86.05
  Female429 (26.0%)369 (27.0%)60 (21.1%) 87.64
Plasma EBV DNA load (copies/ml) 0.536 < 0.001
  ≤ 4×1031071 (64.9%)891 (65.3%)180 (63.2%) 90.49
  > 4×103579 (35.1%)474 (34.7%)105 (36.8%) 78.83
Histologic typea 0.391 0.463
  WHO type 1/263 (3.8%)55 (4.0%)8 (2.8%) 82.71
  WHO type 31587 (96.2%)1310 (96.0%)277 (97.2%) 86.63
T stageb 0.186 < 0.001
  T1415 (25.2%)350 (25.6%)65 (22.8%) 93.54
  T2201 (12.2%)172 (12.6%)29 (10.2%) 85.97
  T3649 (39.3%)521 (38.2%)128 (44.9%) 86.49
  T4385 (23.3%)322 (23.6%)63 (22.1%) 78.71
N stageb 0.962 < 0.001
  N0331 (20.1%)272 (19.9%)59 (20.7%) 95.22
  N1934 (56.6%)774 (56.7%)160 (56.1%) 87.63
  N2277 (16.8%)231 (16.9%)46 (16.1%) 79.05
  N3108 (6.5%)88 (6.4%)20 (7.0%) 66.79
Stageb 0.590 < 0.001
  I139 (8.4%)119 (8.7%)20 (7.0%) 97.55
  II361 (21.9%)302 (22.1%)59 (20.7%) 93.05
  III677 (41%)551 (40.4%)126 (44.2%) 86.81
  IVa473 (28.7%)393 (28.8%)80 (28.1%) 77.13
IC treatment 0.188 < 0.001
  non_IC809 (49.0%)659 (48.3%)150 (52.6%) 90.10
  IC841 (51.0%)706 (51.7%)135 (47.4%) 82.91
HBsAg status < 0.001 0.612
  HBsAg (-)1365 (82.7%)1365 (100.0%)0 86.60
  HBsAg (+)285 (17.3%)0285 (100.0%) 85.87
ALCc (109/L)1650 (100%)1.9 (1.5–2.3)1.9 (1.5–2.4)0.514-0.663
ALC group (109/L) 0.694 0.223
  > 1.9742 (45.0%)617 (45.2%)125 (43.9%)160 (56.1%)87.58
  ≤ 1.9908 (55.0%)748 (54.8%) 85.55
ALTc (U/L)1650 (100.0%)19.9 (16–24.9)24 (18.9–34)< 0.001-0.256
ASTc (U/L)1650 (100.0%)20 (16.2–26)24.2 (20–36.5)< 0.001-0.273
DOI: https://doi.org/10.2478/raon-2026-0005 | Journal eISSN: 1581-3207 | Journal ISSN: 1318-2099
Language: English
Submitted on: May 24, 2025
|
Accepted on: Sep 18, 2025
|
Published on: Feb 6, 2026
In partnership with: Paradigm Publishing Services
Publication frequency: 4 issues per year

© 2026 Shuqi Li, Biyun Chen, Di Cao, Chao Luo, Zhiying Liang, Ian Kou, Ge Ren, Wenjie Huang, Guangying Ruan, Lizhi Liu, Haojiang Li, Siyu Zhu, Ai Fei, published by Association of Radiology and Oncology
This work is licensed under the Creative Commons Attribution 4.0 License.

AHEAD OF PRINT