
FIGURE 1.
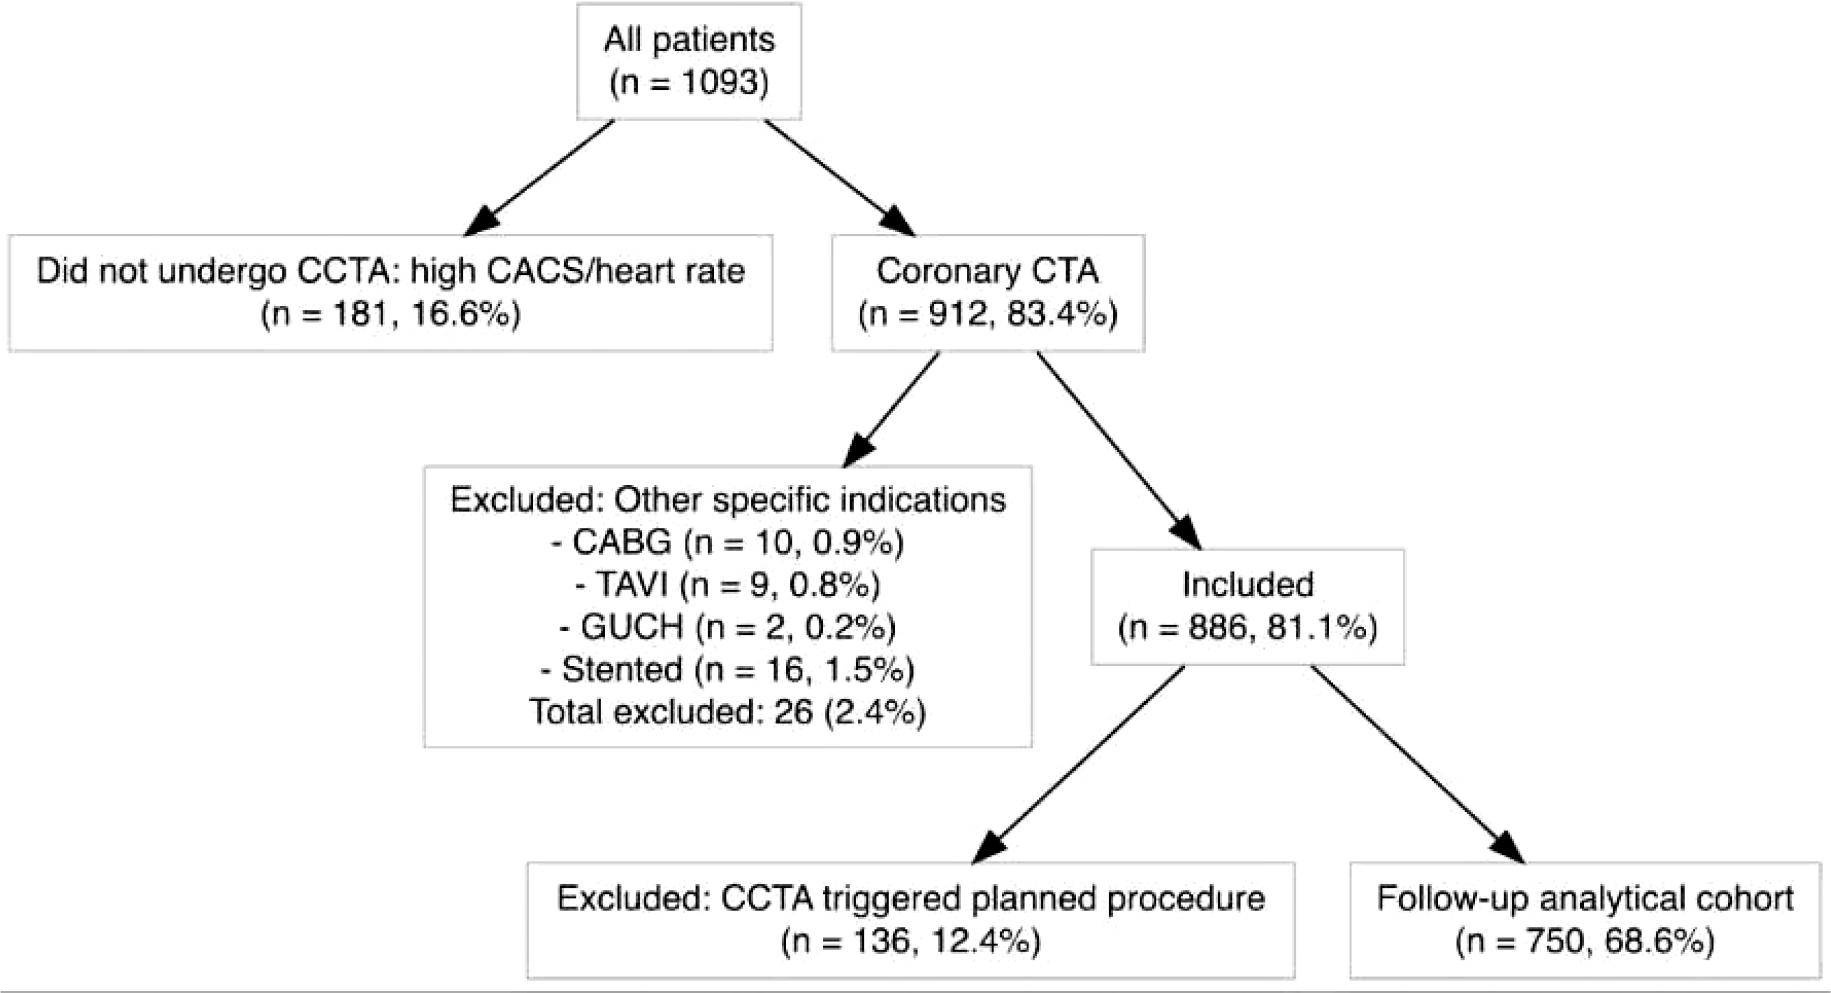
FIGURE 2.
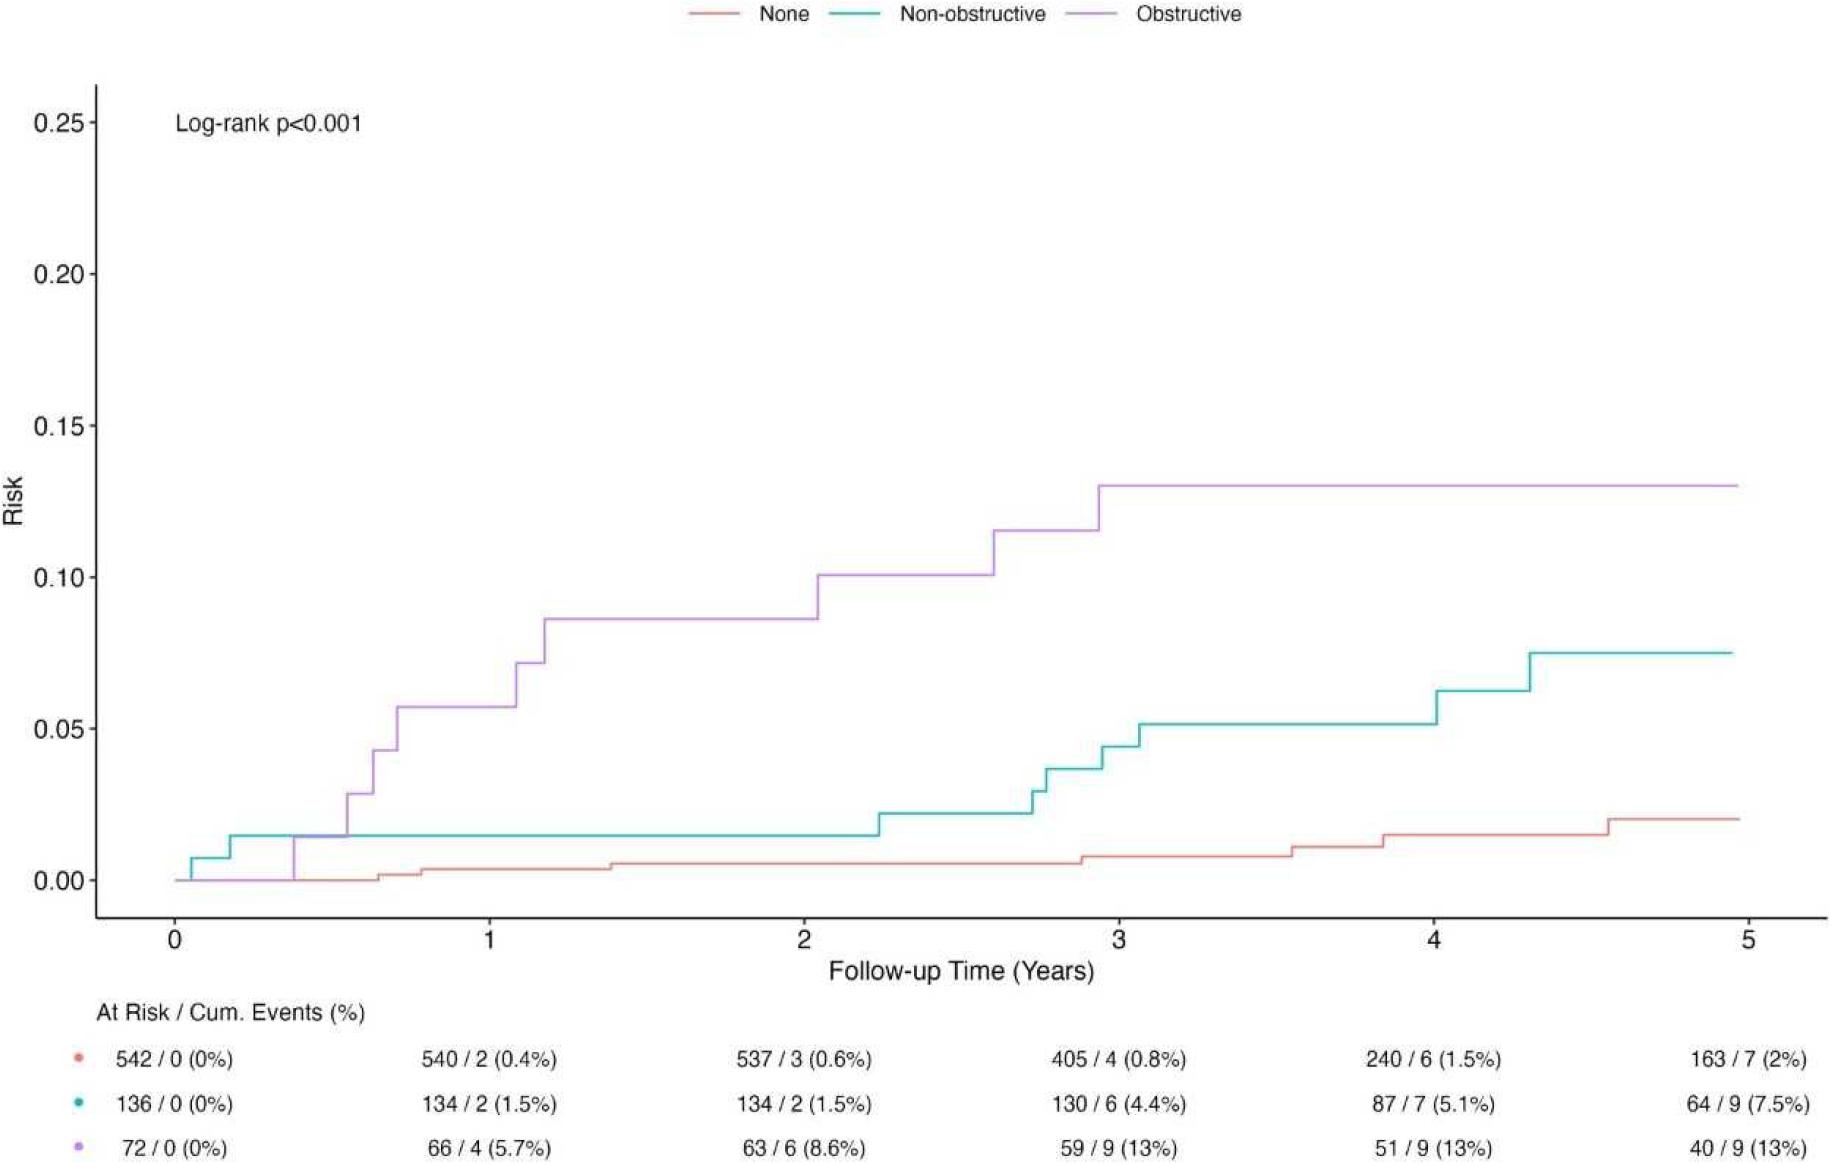
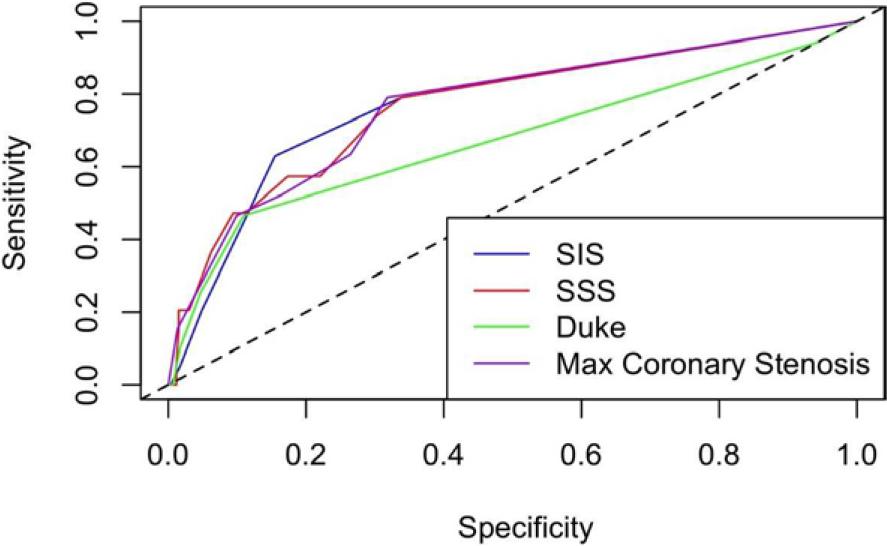
FIGURE 3.
Cox models for different coronary computed tomographic angiography (CCTA)-derived scoring systems and their association with clinical endpoints
| CV Death | MACE | MACE plus unplanned revascularization | ||||||||
|---|---|---|---|---|---|---|---|---|---|---|
| Model | HR | CI | p | HR | CI | p | HR | CI | p | |
| Segment involvement score (SIS) | Base model | 1.75 | 1.33–2.29 | < 0.001 | 1.80 | 1.39–2.34 | < 0.001 | 1.84 | 1.47–2.31 | < 0.001 |
| Plus calcium score (log) | 1.72 | 1.13–2.61 | 0.011 | 1.72 | 1.15–2.59 | 0.008 | 1.56 | 1.09–2.24 | 0.015 | |
| Full model | 1.56 | 1.03–2.37 | 0.038 | 1.61 | 1.07–2.42 | 0.023 | 1.69 | 1.17–2.45 | 0.005 | |
| Segment stenosis score (SSS) | Base model | 1.16 | 1.08–1.24 | < 0.001 | 1.17 | 1.09–1.25 | < 0.001 | 1.18 | 1.11–1.25 | < 0.001 |
| Plus calcium score (log) | 1.13 | 1.01–1.26 | 0.026 | 1.14 | 1.03–1.26 | 0.010 | 1.12 | 1.03–1.23 | 0.009 | |
| Full model | 1.11 | 1–1.24 | 0.057 | 1.13 | 1.02–1.25 | 0.024 | 1.13 | 1.03–1.24 | 0.009 | |
| Modified Duke CAD score | Base model | 1.48 | 1.14–1.92 | 0.003 | 1.54 | 1.2–1.96 | < 0.001 | 1.66 | 1.35–2.02 | < 0.001 |
| Plus calcium score (log) | 1.25 | 0.9–1.73 | 0.192 | 1.27 | 0.93–1.75 | 0.132 | 1.34 | 1.03–1.74 | 0.032 | |
| Full model | 1.18 | 0.85–1.64 | 0.324 | 1.21 | 0.88–1.67 | 0.237 | 1.35 | 1.01–1.81 | 0.041 | |
| Maximal coronary stenosis grade | Base model | 1.58 | 1.28–1.95 | < 0.001 | 1.63 | 1.33–2 | < 0.001 | 1.70 | 1.42–2.04 | < 0.001 |
| Plus calcium score (log) | 1.64 | 1.22–2.19 | < 0.001 | 1.68 | 1.26–2.23 | < 0.001 | 1.66 | 1.28–2.15 | < 0.001 | |
| Full model | 1.54 | 1.16–2.04 | 0.003 | 1.58 | 1.2–2.09 | 0.001 | 1.66 | 1.3–2.12 | < 0.001 | |
| Presence of any non-obstructive plaque | Base model | 3.86 | 1.49–10.03 | 0.006 | 3.87 | 1.49–10.06 | 0.005 | 2.78 | 1.15–6.73 | 0.023 |
| Plus calcium score (log) | 4.44 | 1.51–13.05 | 0.007 | 4.23 | 1.44–12.48 | 0.009 | 2.43 | 0.87–6.82 | 0.092 | |
| Full model | 3.53 | 1.19–10.44 | 0.023 | 3.57 | 1.21–10.6 | 0.022 | 3.24 | 1.16–9.08 | 0.025 | |
Coronary risk score overview
| Scoring system | Definition | Scoring range | Used in model(s) |
|---|---|---|---|
| Maximal coronary stenosis | Maximum stenosis severity observed across LAD, LCX, RCA according to CAD-RADS definition | 0 - No stenosis | e.g., 30–49% stenosis of LAD (score = 2) and 70–99% stenosis of proximal RCA (score = 4) yields a maximal coronary stenosis of 4 |
| Obstruction category | Categorized as none, non-obstructive, or obstructive | None - No stenosis | e.g., 30–49% stenosis of LAD (score = 2) and 70–99% stenosis of proximal RCA (score = 4) yields a categorisation of obstructive CAD |
| Segment involvement score (SIS) | Number of coronary segments with any stenosis; a segment is counted if there is any measurable stenosis (typically corresponds to ≥1 on a 0–5 scale) | 0–15 | e.g., isolated involvement of mid LAD and proximal RCA yields a SIS score of 2 |
| Segment stenosis score (SSS) | Sum of all stenosis severity scores across 15 coronary segments | 0–75 | e.g., 30–49% stenosis of the mid LAD (score = 2) and 70–99% stenosis of the proximal RCA (score = 4) yields a SIS of 6 |
| Duke CAD Score | Number of major vessels with ≥ 70% stenosis (score ≥ 4), + 1 if LADp also ≥ 70% | 0 - None or single < 5 0% stenosis | e.g., 30–49% stenosis of LAD (score = 2) and 50–69% stenosis of proximal RCA (score = 4) yields a Duke CAD score of 2 |
Baseline characteristics
| Characteristic | N = 7501 | |
|---|---|---|
| Sex (male) | 346 (46%) | |
| Age (years) | 61 (52, 69) | |
| Arterial hypertension | 70 (9.3%) | |
| Diabetes mellitus | 25 (3.3%) | |
| Dyslipidemia | 43 (5.7%) | |
| Smoking | 28 (3.7%) | |
| CACS | Zero | 531 (71%) |
| 1–99 | 123 (16%) | |
| 100–299 | 51 (6.8%) | |
| ≥ 300 | 45 (6.0%) | |
| Stenosis | None | 542 (72%) |
| 1–24% stenosis | 35 (4.7%) | |
| 25–49% stenosis | 61 (8.1%) | |
| 50–69% stenosis | 40 (5.3%) | |
| 70–99% stenosis | 59 (7.9%) | |
| Occlusion | 13 (1.7%) | |
| Obstruction | None | 542 (72%) |
| Non-obstructive | 136 (18%) | |
| Obstructive | 72 (9.6%) | |
| 1n (%); Median (IQR); Mean (SD) | ||