
FIGURE 1.
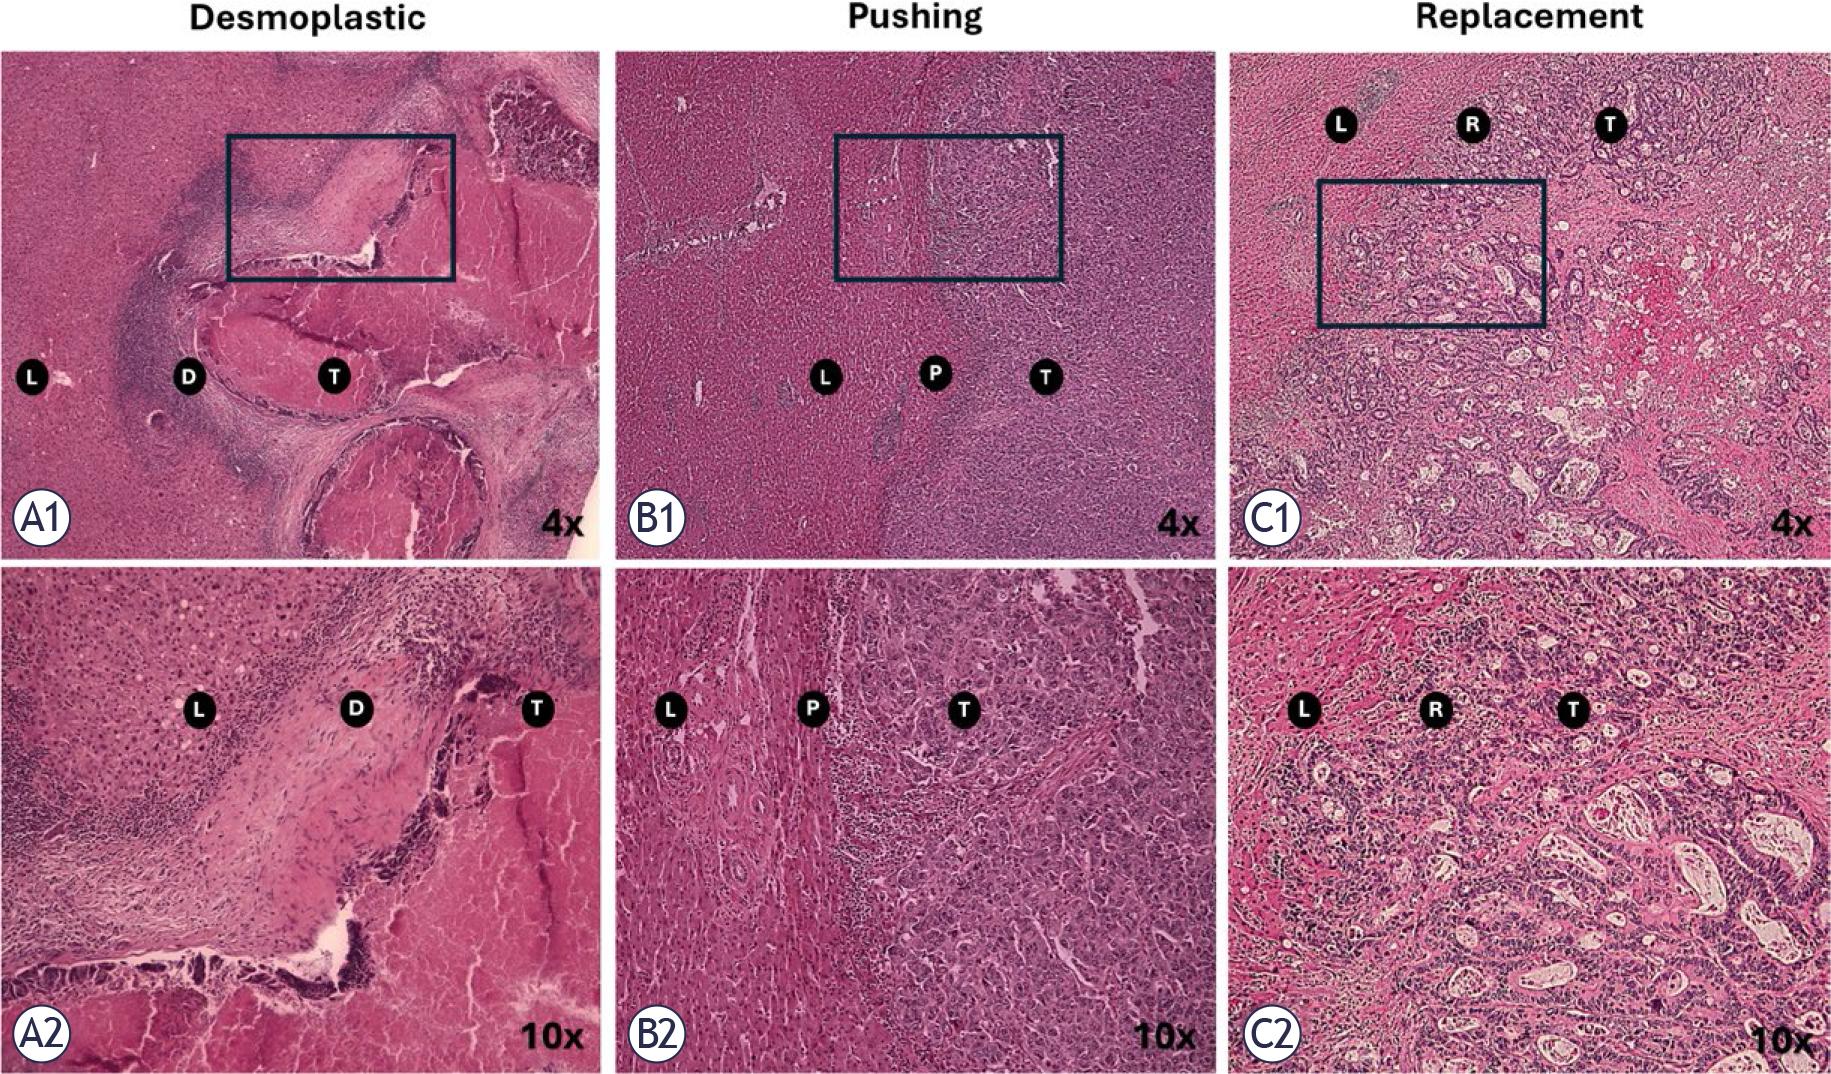
Figure 2.
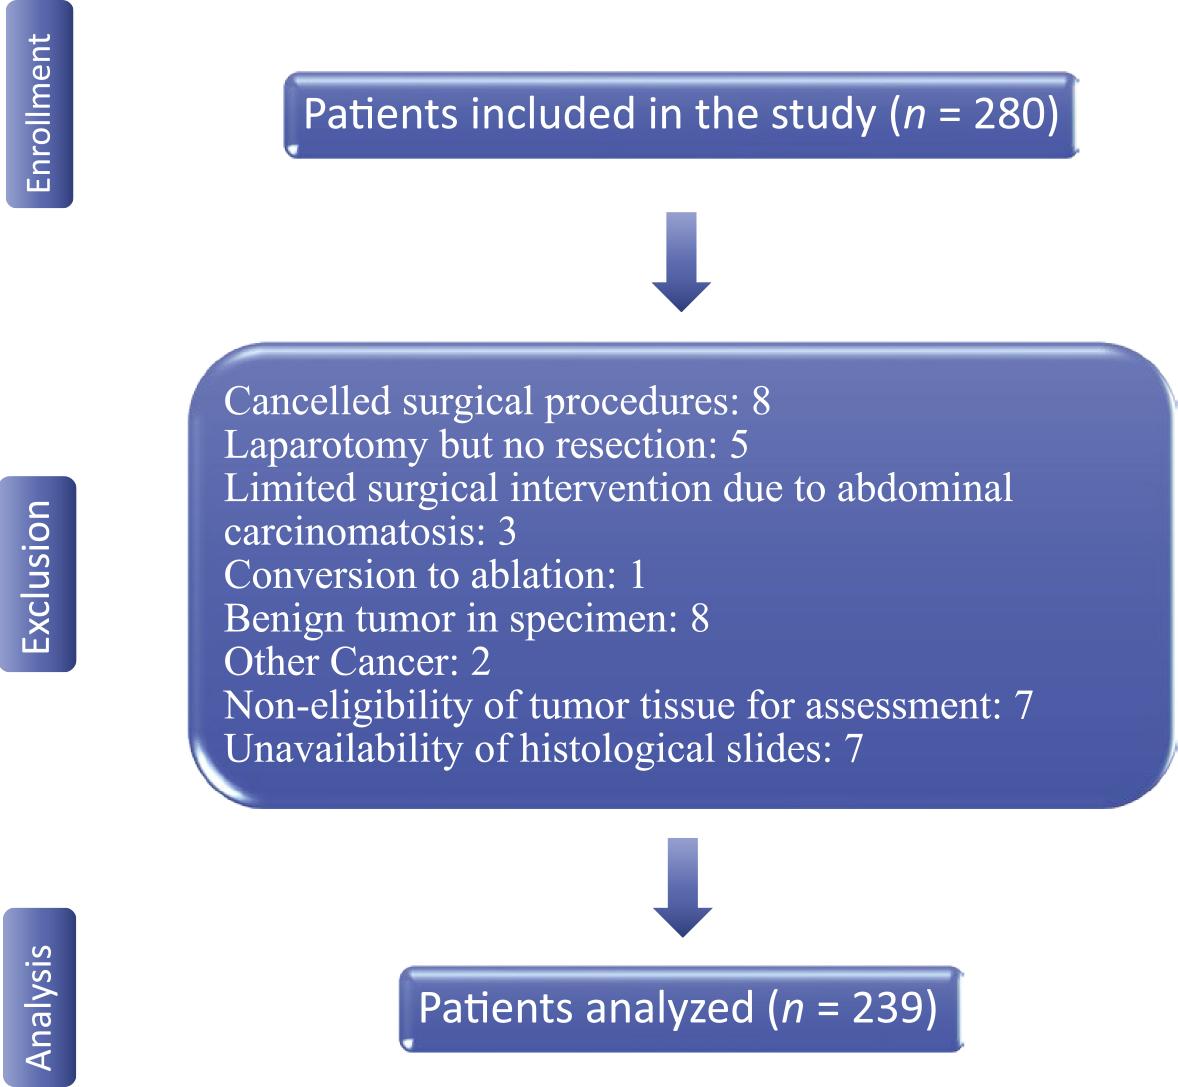
Figure 3.
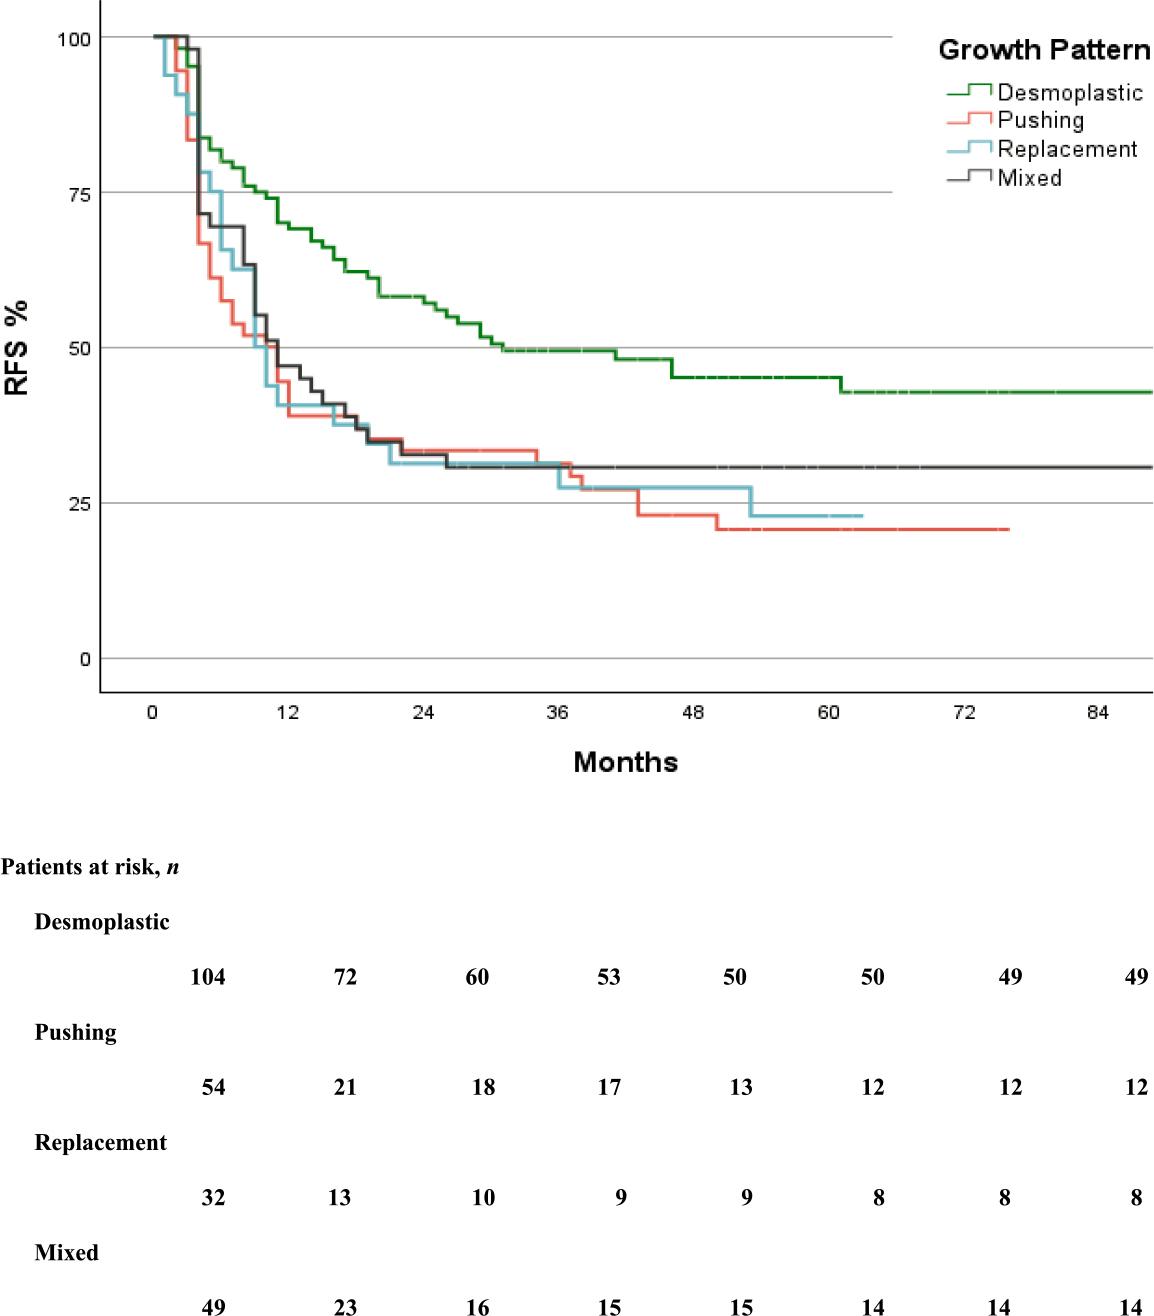
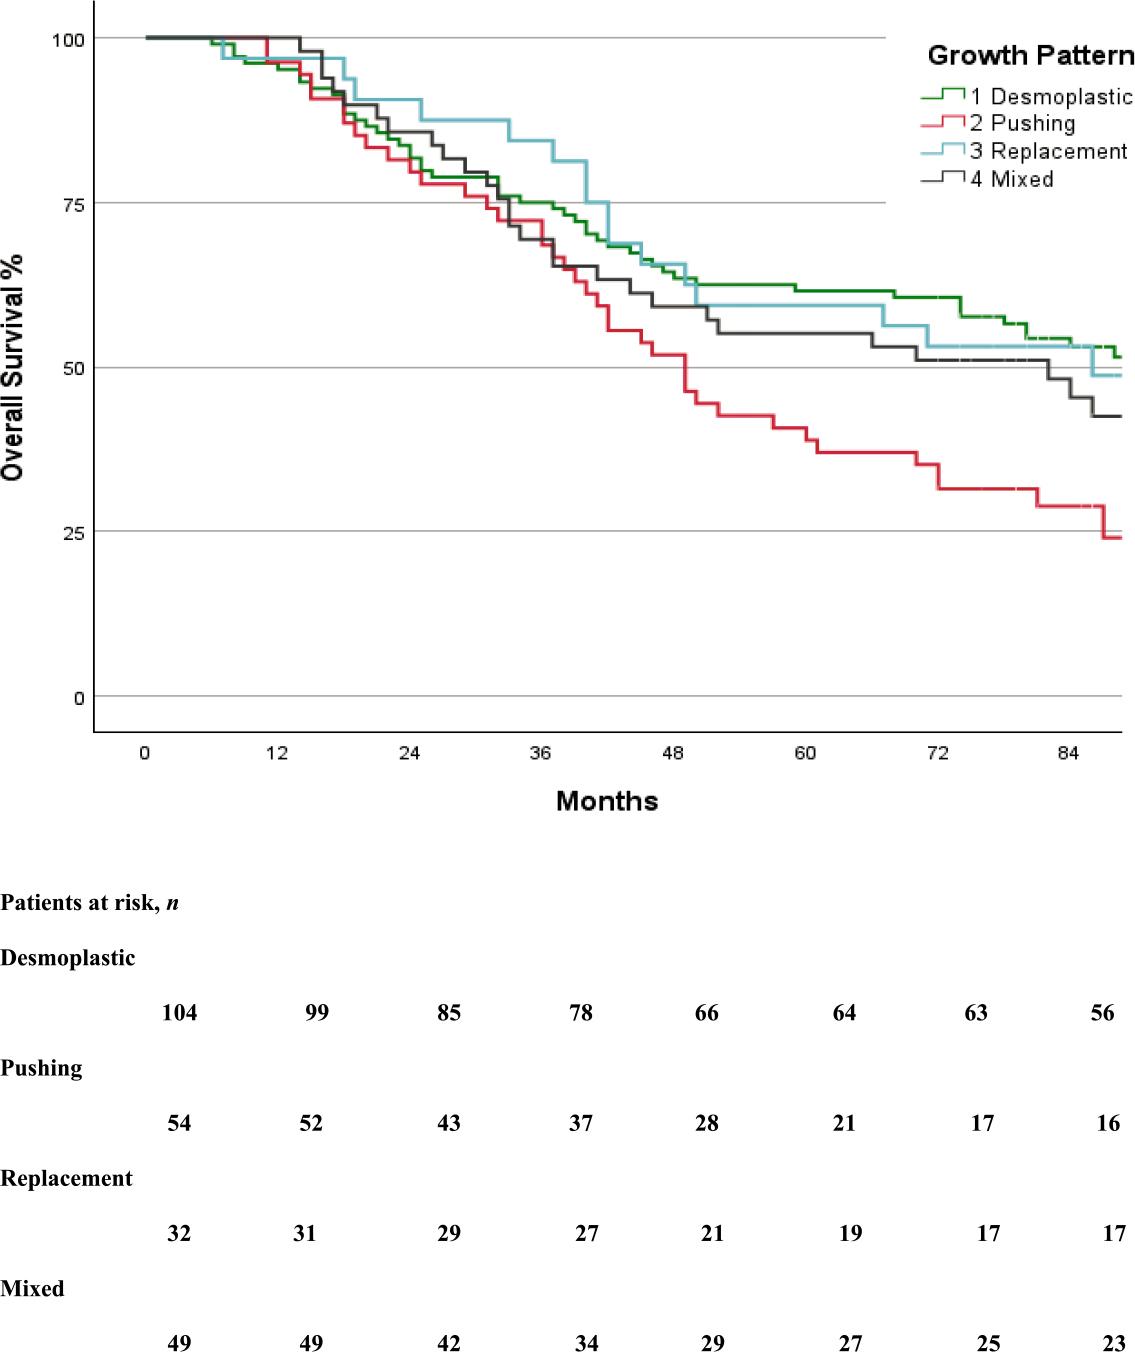
Figure 4.
Univariable and multivariable analysis of prognostic factors for recurrence free and overall survival
| Variable | Recurrence-free survival | Overall survival | ||||
|---|---|---|---|---|---|---|
| Univariable | Multivariable Cox regression analysis | Univariable | Multivariable Cox regression analysis | |||
| P Value | Hazard ratio (95% CI) | P-Value | P-value | Hazard ratio (95% CI) | P-value | |
| Age (per year) | 0.463 | < 0.001 | 1.027 (1.007–1.047) | 0.008 | ||
| Male sex | 0.579 | 0.193 | 1.432 (0.993–2.065) | 0.055 | ||
| BMI | 0.126 | 1.029 (0.989–1.070) | 0.156 | 0.697 | ||
| ECOG score | 0.130 | 1.273 (0.868– .869) | 0.217 | 0.005 | 1.659 (1.129–2.437) | 0.010 |
| ASA score | 0.108 | 1.119 (0.858–1.458) | 0.408 | 0.192 | ||
| Primary tumor | ||||||
| Rectum | 0.195 | 0.885 (0.624–1.256) | 0.494 | 0.403 | ||
| Right colon | 0.75 | 0.134 | 1.238 (0.798–1.919) | 0.341 | ||
| AJCC T- stage (1,2–3,4) | 0.176 | 0.547 (0.291–1.029) | 0.061 | 0.597 | ||
| Lymph node involvement | < 0.001 | 1.610 (1.075–2.412) | 0.021 | 0.041 | 1.349 (0.921–1.976) | 0.124 |
| Liver metastasis | ||||||
| Synchronous | 0.023 | 1.302 (0.914–1.856) | 0.144 | 0.129 | ||
| Previous liver resection | 0.791 | 0.256 | ||||
| Multiple lesions | 0.310 | 0.798 | ||||
| Lobar distribution | 0.621 | 0.494 | ||||
| Tumor size (per cm) | 0.017 | 1.084 (0.992–1.185) | 0.076 | < 0.001 | 1.014 (1.005–1.022) | 0.002 |
| Chemo within 6 mo prior surgery | 0.109 | 1.140 (0.814–1.597) | 0.446 | 0.997 | ||
| Preoperative CEA (> 5 ng/mL) | 0.155 | 1.255 (0.896–1.757) | 0.186 | 0.750 | ||
| Extrahepatic disease | < 0.001 | 2.834 (1.766–4.548) | < 0.001 | 0.011 | 1.690 (1.028–2.779) | 0.039 |
| Liver resection | ||||||
| Laparoscopy | 0.489 | 0.515 | ||||
| Blood loss | 0.486 | 0.863 | ||||
| Blood transfusion | 0.353 | 0.243 | ||||
| Operative time | 0.896 | 0.684 | ||||
| Post operative severe complications | 0.900 | 0.216 | ||||
| R1 resection (<1 mm)* | 0.094 | 0.831 (0.504–1.370) | 0.468 | 0.120 | 1.075 (0.663–1.741) | 0.77 |
| Involved resection margin | 0.002 | 1.625 (0.841–3.141) | 0.148 | 0.156 | 1.390 (0.730–2.648) | 0.316 |
| No adjuvant chemotherapy | 0.401 | 0.555 | ||||
| Growth patterns | ||||||
| Desmoplastic vs. none desmoplastic | < 0.001 | 1.446 (1.005–2.081) | 0.047 | 0.073 | 0.912 (0.633–1.313) | 0.619 |
Chemotherapy administration and long-term oncologic outcomes
| Variable | All types 239 | Desmoplastic 104 | Pushing 54 | Replacement 32 | Mixed 49 | P-value |
|---|---|---|---|---|---|---|
| Neoadjuvant chemotherapy, n (%) | 95 (40%) | 46 (44%) | 19 (35%) | 12 (38%) | 18 (37%) | 0.660 |
| Adjuvant chemotherapy, n (%) | 122 (51%) | 53 (51%) | 25 (46%) | 12 (38%) | 32 (65%) | 0.078 |
| Recurrence-free survival | ||||||
| 1 y, % | 54% | 69% | 39% | 41% | 47% | |
| 3y, % | 38% | 49% | 31% | 27% | 31% | |
| 5y, % | 33% | 45% | 21% | 23% | 31% | |
| Median (95% CI), mo | 16 (11 to 21) | 31 (12 to 50) | 10 (5 to 15) | 9 (6 to 12) | 11 (6 to 16) | 0.002 |
| Disease recurrence, n (%) | 155 (65%) | 55 (53%) | 42 (78%) | 24 (75%) | 34 (70%) | 0.006 |
| Liver, n | 84 (35%) | 33 (32%) | 22 (42%) | 9 (29%) | 20 (41%) | 0.415 |
| Isolated liver recurrence | 58 (24%) | 24 (23%) | 15 (28%) | 6 (19%) | 13 (27%) | 0.750 |
| Recurrence in resection bed | 9 (4%) | 5 (5%) | 3 (6%) | 1 (3%) | 0 | 0.433 |
| Lung, n | 60 (25%) | 18 (17%) | 17 (31%) | 12 (38%) | 13 (27%) | 0.066 |
| Other Extrahepatic, n | 37 (16%) | 15 (14%) | 9 (17%) | 5 (16%) | 8 (16%) | 0.982 |
| Treatment of the first disease recurrence | ||||||
| Repeated liver surgery, n (%) | 56 (23%) | 20 (19%) | 16 (30%) | 7 (22%) | 13 (27%) | 0.500 |
| LLR | 29 (12%) | 13 (13%) | 5 (9%) | 3 (9%) | 8 (16%) | |
| OLR | 20 (8%) | 7 (7%) | 6 (11%) | 2 (6%) | 5 (10%) | |
| RFA | 6 (3%) | 0 | 5 (9%) | 1 (3%) | 0 | |
| Transplant | 1 (0.5%) | 0 | 0 | 1 (3%) | 0 | |
| Lung resection, n (%) | 13 (5%) | 4 (4%) | 1 (2%) | 6 (20%) | 2 (4%) | 0.005 |
| Other surgical procedure, n (%) | 9 (4%) | 5 (5%) | 2 (4%) | 2 (6%) | 0 | 0.428 |
| Only palliative chemotherapy, n (%) | 43 (18%) | 13 (13%) | 13 (24%) | 5 (16%) | 12 (25%) | 0.172 |
| Radiotherapy and radio-chemotherapy, n (%) | 24 (10%) | 9 (9%) | 7 (13%) | 4 (13%) | 4 (8%) | 0.768 |
| No treatment, n (%) | 10 (4%) | 5 (5%) | 4 (7%) | 1 (3%) | 0 | 0.292 |
| Overall survival | ||||||
| 1 y, % | 97% | 95% | 96% | 97% | 98% | |
| 3 y, % | 74% | 75% | 72% | 84% | 69% | |
| 5 y, % | 55% | 62% | 39% | 59% | 55% | |
| Median (95% CI), months | 74 (58 to 90) | 94 | 49 (39 to 59) | 86 (43 to 129) | 82 (43 to 121) | 0.036 |
| Alive patients, n (%) | 103 (43%) | 52 (50%) | 16 (30%) | 14 (44%) | 22 (45%) | 0.064 |
Baseline characteristics
| Variable | Total n = 239 | Desmoplastic HGP n = 104 | Pushing HGP n = 54 | Replacement HGP n = 32 | Mixed HGP n = 49 | P-value |
|---|---|---|---|---|---|---|
| Male | 141 (59%) | 68 (65%) | 34 (62%) | 14 (44%) | 25 (51%) | 0.091 |
| Median age (IQR), years* | 67 (60–74) | 66 (58–73) | 70 (63–76) | 62.5 (58–71) | 68 (64–73) | 0.028 |
| Median BMI (IQR), kg/m2 | 24.8 (22.53–28.03) | 24.89 (22.85–28.6) | 24.68 (23.0–26.56) | 24.93 (21.71–27.68) | 24.8 (21.85–28.41) | 0.585 |
| ECOG score | ||||||
| 0 | 197 (82%) | 85 (82%) | 46 (85%) | 26 (81%) | 40 (82%) | |
| 1 | 40 (17%) | 18 (17%) | 8 (15%) | 5 (16%) | 9 (18%) | 0.843 |
| 2 | 2 (1%) | 1 (1%) | 0 | 1 (3%) | 0 | |
| ASA score | ||||||
| 1 | 27 (11%) | 13 (13%) | 6 (11%) | 7 (22%) | 2 (4%) | |
| 2 | 120 (50.5%) | 49 (47%) | 25 (46%) | 16 (50%) | 30 (61%) | 0.151 |
| 3 | 90 (38%) | 42 (40%) | 22 (41%) | 9 (28%) | 17 (35%) | |
| 4 | 1 (0.5%) | 0 | 1 (2%) | 0 | 0 | |
| Primary tumor in the rectum | 99 (41%) | 44 (42%) | 22 (41%) | 14 (44%) | 19 (39%) | 0.968 |
| Primary tumor lymph node metastasis | 158 (66%) | 5 (57%) | 41 (76%) | 26 (81%) | 32 (65%) | 0.021 |
| Primary tumor | ||||||
| AJCC stage | ||||||
| T1 | 5 (2%) | 3 (3%) | 0 | 0 | 2 (4%) | |
| T2 | 14 (6%) | 2 (2%) | 5 (9%) | 2 (6%) | 5 (10%) | 0.116 |
| T3 | 164 (69%) | 79 (76%) | 31 (58%) | 21 (66%) | 33 (67%) | |
| T4 | 56 (23%) | 20 (19%) | 18 (33%) | 9 (28%) | 9 (19%) | |
| Synchronous | 140 (59%) | 56 (54%) | 34 (63%) | 18 (56%) | 32 (65%) | 0.499 |
| Chemotherapy within 6 months prior to surgery | 121 (51%) | 55 (53%) | 27 (50%) | 17 (53%) | 22 (45%) | 0.815 |
| Median CEA level (IQR), μg/L | 4.3 (2.35–9.5) | 4.0 (2.45–8.4) | 3.9 (1.8–10.5) | 5.65 (2.47–6.25) | 5.0 (2.6–8.05) | 0.731 |
| Previous liver resection | 29 (12%) | 13 (13%) | 6 (11%) | 5 (16%) | 5 (10%) | 0.896 |
| Median tumor size (IQR), cm | 2.4 (1.50–3.50) | 2.1 (1.30–3.40) | 2.5 (2.08–4.08) | 1.8 (1.40–3.15) | 2.5 (1.95–4.00) | 0.003 |
| Minimum/maximum | 0.6–16 | 0.7–9 | 0.6–8 | 0.8–7.5 | 0.8–16 | |
| Open liver resection | 126 (53%) | 55 (53%) | 28 (52%) | 17 (53%) | 26 (53%) | 1.000 |
| Multiple lesions | 95 (40%) | 37 (36%) | 26 (48%) | 10 (31%) | 22 (45%) | 0.278 |
| Right colon | 39 (16%) | 15 (14%) | 10 (19%) | 4 (13%) | 10 (20%) | 0.704 |