
FIGURE 1.
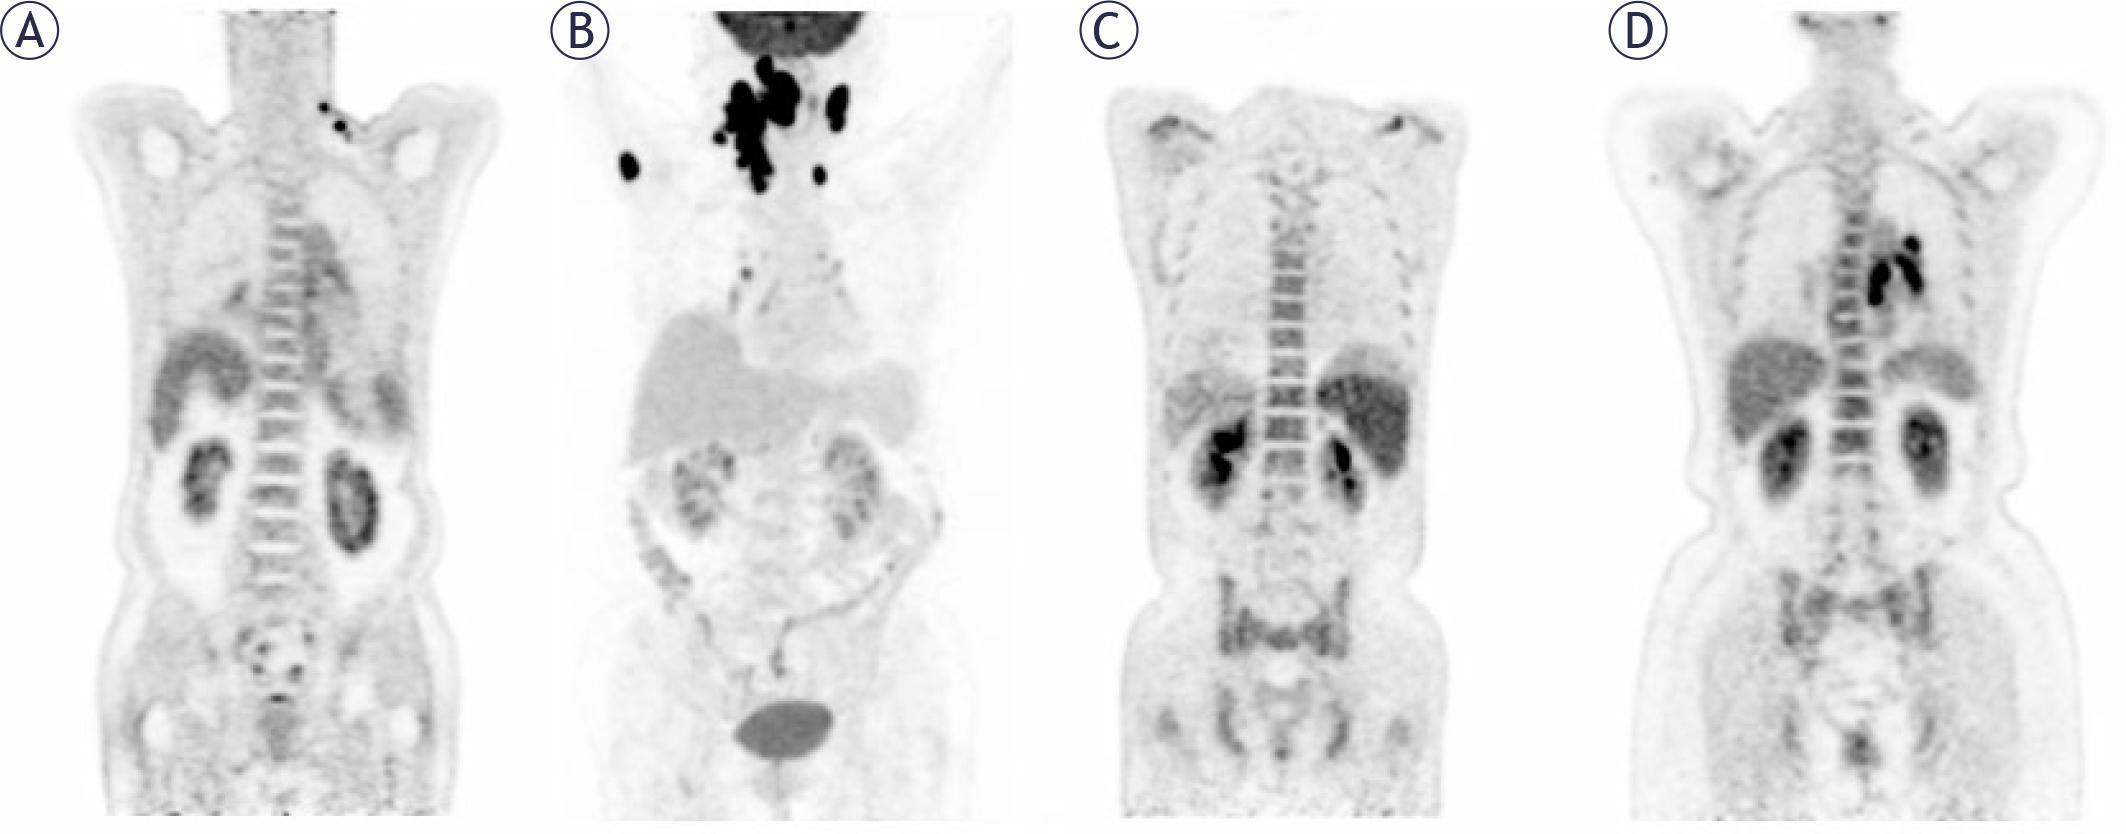
FIGURE 2.
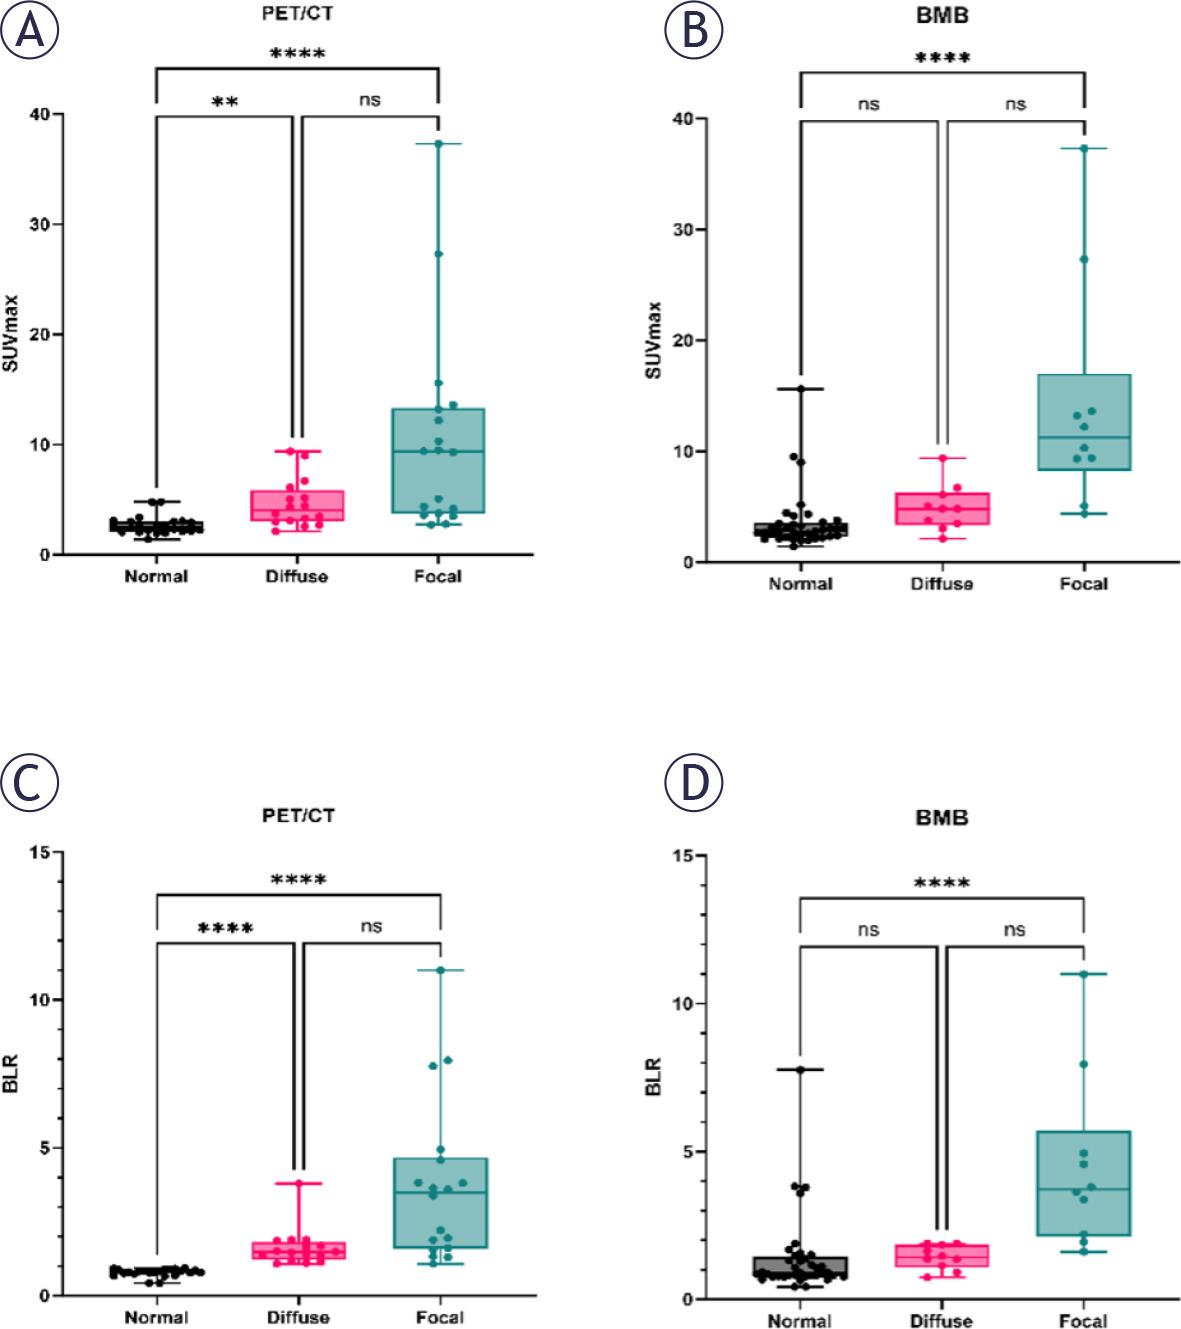
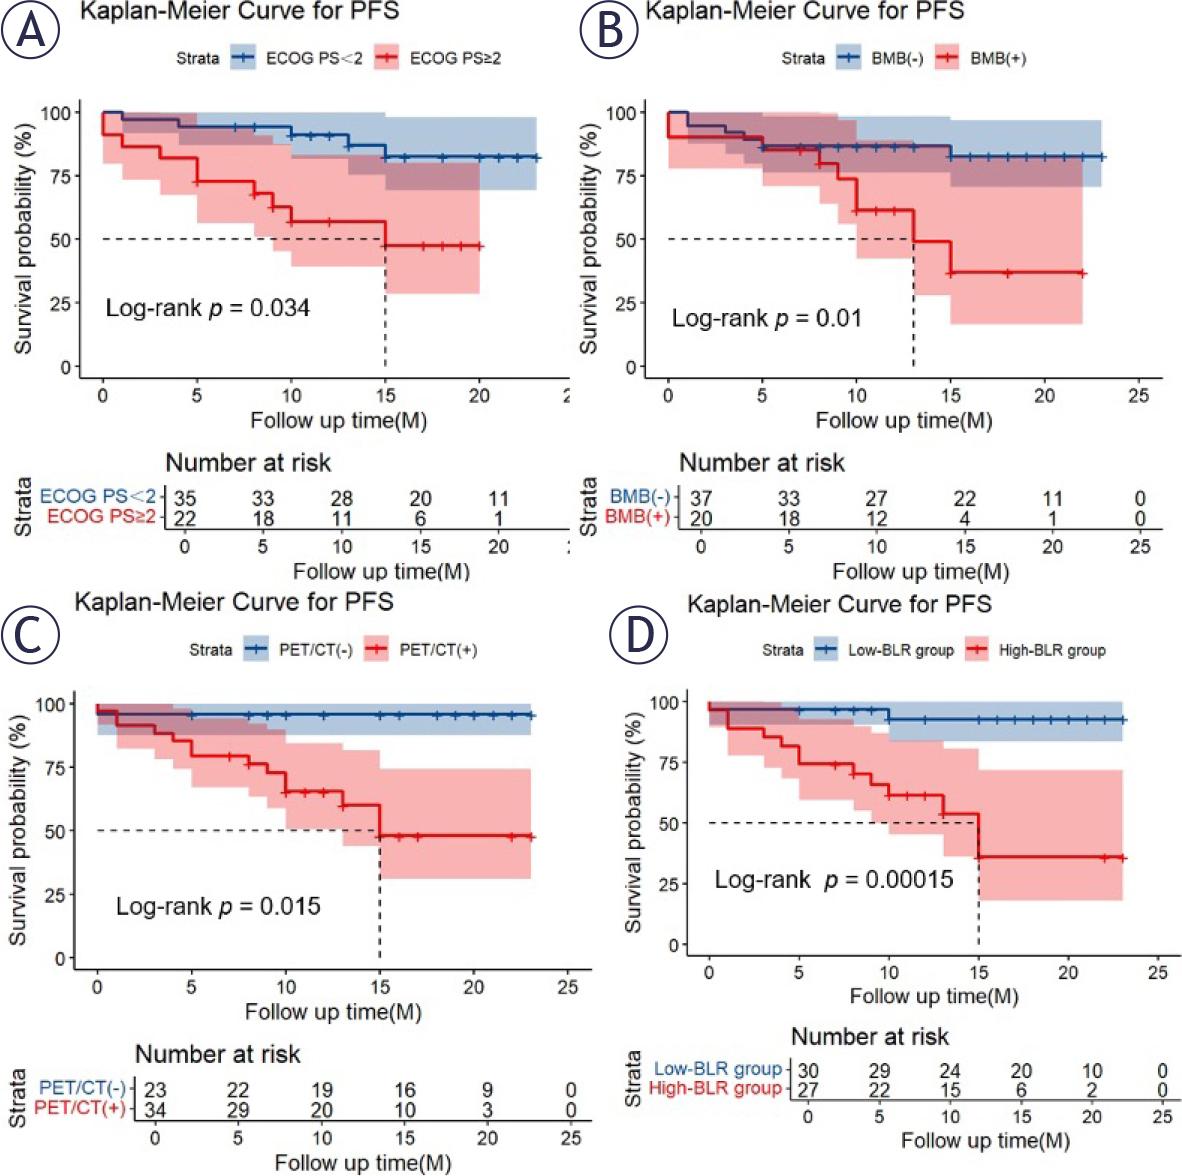
FIGURE 3.
Comparison of bone marrow biopsy (BMB) and PET/CT results with bone marrow involvement (BMI)
Baseline characteristics at diagnosis
| Characteristic | PET/CT | p -value | BMB | p-value | ||
|---|---|---|---|---|---|---|
| (-) (n = 23) | (+) (n = 34) | (-) (n = 37) | (+) (n = 20) | |||
| Male, no. (%) | 11 (47.83) | 16 (47.06) | 0.955 | 17 (45.95) | 10 (50.00) | 0.770 |
| Leukopenia, no. (%) | 2 (8.70) | 6 (17.65) | 0.571 | 2 (5.41) | 6 (30.00) | 0.031 |
| Anaemia, no. (%) | 4 (17.39) | 15 (44.12) | 0.036 | 7 (18.92) | 12 (60.00) | 0.002 |
| Thrombocytopenia, no. (%) | 2 (8.70) | 8 (23.53) | 0.276 | 3 (8.11) | 7 (35.00) | 0.029 |
| LMR > 3, no. (%) | 15 (65.22) | 20 (58.82) | 0.627 | 26 (70.27) | 9 (45.00) | 0.061 |
| NLR > 2.5, no. (%) | 10 (43.5) | 21 (61.8) | 0.174 | 19 (51.40) | 12 (60.00) | 0.532 |
| Age > 60 years, no. (%) | 10 (43.48) | 20 (58.82) | 0.255 | 19 (51.35) | 11 (55.00) | 0.792 |
| Stage III/IV, no. (%) | 19 (82.61) | 29 (85.29) | 1 | 28 (75.68) | 20 (100) | 0.043 |
| ECOG PS ≥ 2, no. (%) | 8 (34.78) | 14 (41.18) | 0.627 | 11 (29.73) | 11 (55.00) | 0.061 |
| Clinical systemic symptoms, no. (%) | 21 (91.30) | 25 (73.53) | 0.185 | 31 (83.78) | 15 (75.00) | 0.652 |
| Biological systemic symptoms, no. (%) | 11 (47.83) | 20 (58.82) | 0.413 | 18 (48.65) | 13 (65.00) | 0.237 |
| LDH (+), no. (%) | 8 (34.78) | 18 (52.94) | 0.177 | 15 (40.54) | 11 (55.00) | 0.296 |
| IPI score > 2, no. (%) | 8 (34.78) | 18 (52.94) | 0.177 | 12 (32.43) | 14 (70.00) | 0.007 |
| Extranodal sites ≥ 2 | 6 (26.09) | 13 (38.24) | 0.340 | 8 (21.62) | 11 (55.00) | 0.011 |
| BMB (+), no. (%) | 2 (8.70) | 18 (52.94) | < 0.001 | - | - | - |
| PET (+), no. (%) | - | - | - | 16 (43.24) | 18 (90.00) | < 0.001 |
| High level of BLR, no. (%) | 0 | 27 (79.41) | < 0.001 | 10 (27.03) | 17 (85.00) | < 0.001 |
| BM SUVmax, median (P25, P75) | 2.48 (2.12,3.02) | 4.74 (3.42,9.43) | 0.002 | 2.78 (2.28,3.55) | 6.39 (4.47,11.73) | 0.003 |
Comparison of bone marrow biopsy (BMB) and PET/CT to detect bone marrow involvement (BMI)
| Accuracy (%) | Sensitivity (%) | Specificity (%) | PPV (%) | NPV (%) | YI | kappa | AUC | |
|---|---|---|---|---|---|---|---|---|
| PET/CT (BMB as standard) | 68.4 (95 CI,76.9–100) | 56.8 (95 CI, 40.8–72.7) | 52.9 (95 CI, 36.2–69.7) | 52.9 (95 CI, 36.2–69.7) | 91.3 (95 CI, 79.8–100) | 0.468 | 0.403 | 0.734 |
| PET/CT (BMI as standard) | 93.0 (95 CI, 92.8–93.2) | 94.1 (95 CI, 86.2–100) | 91.3 (95 CI, 79.8–100) | 94.1 (95 CI, 86.2–100) | 91.3 (95 CI, 79.8–100) | 0.854 | 0.854 | 0.927 |
| BMB (BMI as standard) | 75.4 (95 CI, 74.8–76.1) | 58.8 (95 CI,42.3–75.4) | 100 (95 CI,100–100) | 100 (95 CI,100–100) | 62.2 (95 CI,46.5–77.8) | 0.588 | 0.536 | 0.794 |
Univariate and multivariate Cox analysis of risk factors for progression-free survival (PFS) in 57 patients with diffuse large B-cell lymphoma (DLBCL)
| Characteristics | Univariable | Multivariable | ||
|---|---|---|---|---|
| HR (95%CI) | p-value | HR (95%CI) | p-value | |
| Male | 0.619 (0.220-1.747) | 0.365 | ||
| Leukopenia | 0.370 (0.049-2.821) | 0.338 | ||
| Anaemia | 1.880 (0.680-5.199) | 0.224 | ||
| Thrombocytopenia | 0.772 (0.174-3.429) | 0.734 | ||
| LMR > 3 | 0.251 (0.085-0.737) | 0.012 | ||
| NLR > 2.5 | 2.763 (0.877-8.708) | 0.083 | ||
| Age<60 years | 1.270 (0.458-3.521) | 0.646 | ||
| Clinical systemic symptoms | 1.500 (0.338-6.656) | 0.594 | ||
| Biological systemic symptoms | 0.636 (0.217-1.866) | 0.410 | ||
| Stage III or IV | 1.268 (0.286-5.624) | 0.755 | ||
| ECOG PS ≥ 2 | 4.368 (1.479-12.896) | 0.008 | 4.286 (1.422-12.919) | 0.010 |
| LDH (+) | 3.856 (1.227-12.122) | 0.021 | ||
| Extranodal sites ≥ 2 | 3.638 (1.292-10.245) | 0.014 | ||
| IPI score<2 | 3.110 (1.055-9.163) | 0.040 | ||
| BMB (+) | 3.663 (1.267-10.415) | 0.016 | ||
| PET (+) | 12.850 (1.678-98.407) | 0.014 | ||
| High level of BLR | 10.527 (2.340-47.364) | 0.002 | 10.518 (2.305-47.986) | 0.002 |
| BM SUVmax | 1.021 (0.954-1.093) | 0.543 | ||
Diagnostic performance in all diffuse large B-cell lymphoma (DLBCL) patients
| PET/CT | Total | |||
|---|---|---|---|---|
| (+) | (-) | |||
| BMB | (+) | 18 | 2 | 20 |
| (-) | 16 | 21 | 37 | |
| Total | 34 | 23 | 57 | |