
FIGURE 1.
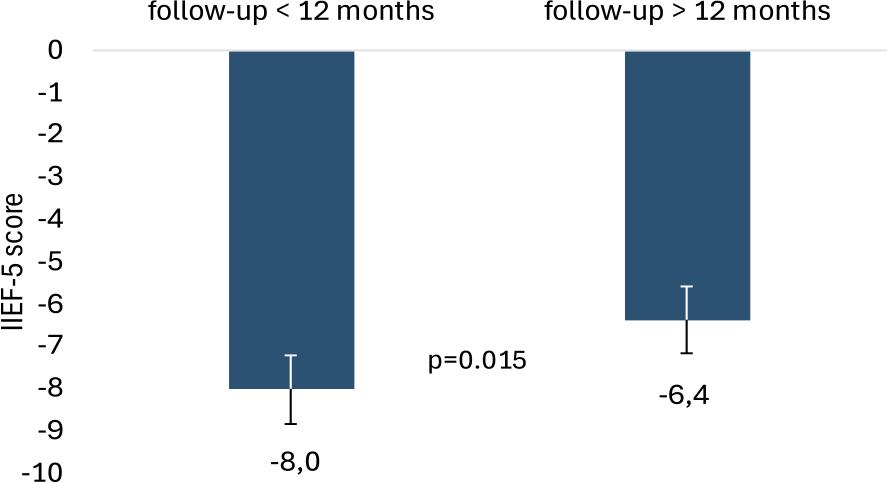
FIGURE 2.
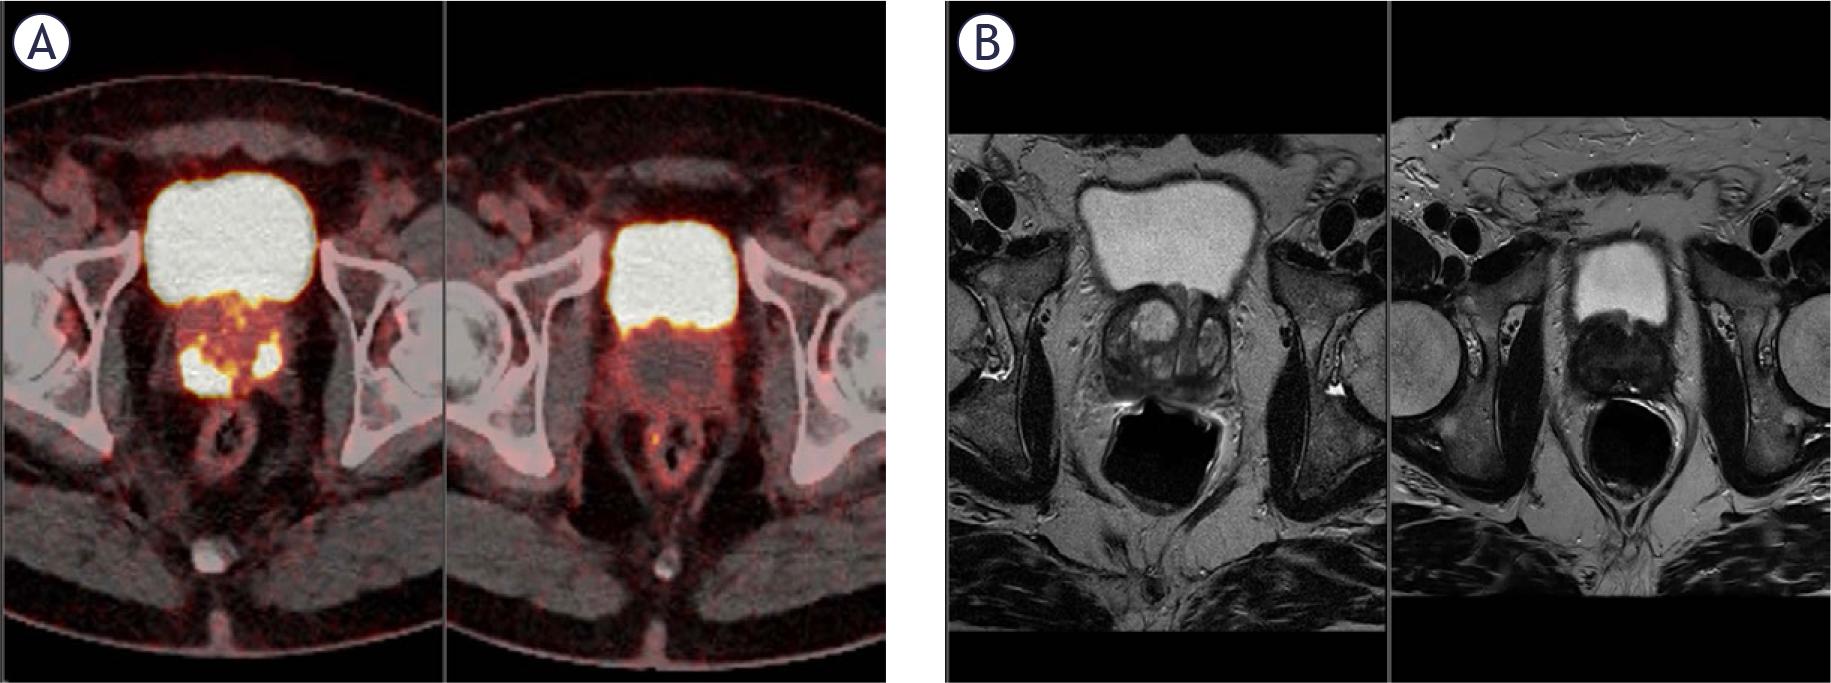
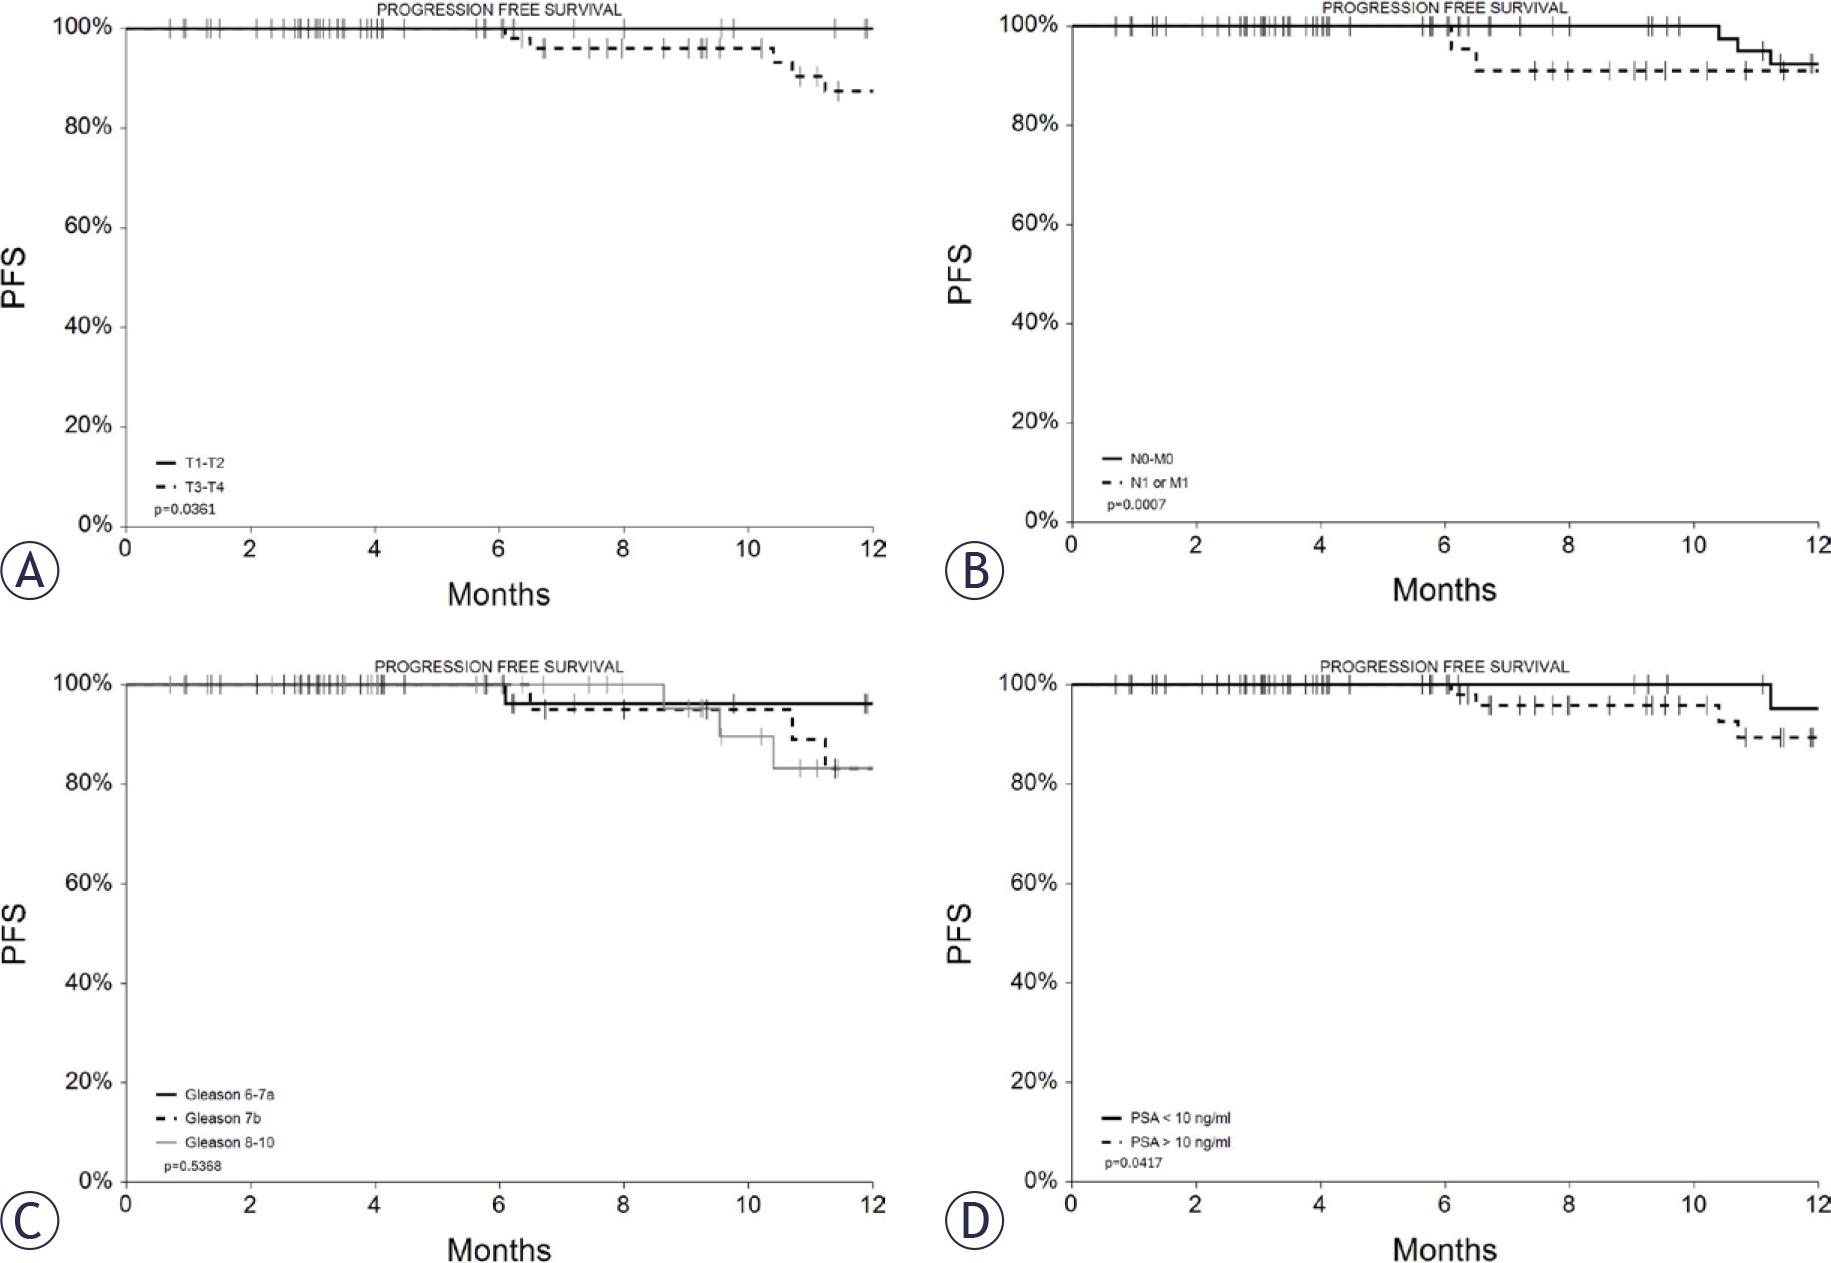
FIGURE 3.
Patient cancer stage and grade
| Gleason score | N | % |
|---|---|---|
| 6 (3+3) + 7a (3+4) | 52 | 36% |
| 7b (4+3) | 40 | 28% |
| 8–10 (4+4/5+3/4+5/5+4/5+5) | 51 | 35% |
| Not available (no biopsy) | 1 | 1% |
| D’Amico risk classification | ||
| Low | 2 | 1% |
| Intermediate | 18 | 13% |
| High | 124 | 86% |
| Stage | N | % |
| T1c | 6 | 4% |
| T2a | 16 | 11% |
| T2b | 3 | 2% |
| T2c | 25 | 18% |
| T3a | 36 | 25% |
| T3b | 26 | 18% |
| T4 | 32 | 22% |
| N0 | 111 | 77% |
| N1 | 33 | 23% |
| M0 | 112 | 78% |
| M1 | 32 | 22% |
Descriptive characteristics of patients included
| Mean | St.Dev. | Median | Min | Max | |
|---|---|---|---|---|---|
| Age (yrs) | 68 | 8 | 67 | 50 | 83 |
| Height (cm) | 180 | 7 | 180 | 156 | 196 |
| Weight (kg) | 81 | 11 | 82 | 51 | 110 |
| PSA (ng/ml) | 24.9 | 28.5 | 15.1 | 1.8 | 177.0 |
| Prostate volume (ml) | 44 | 18 | 40 | 6 | 117 |
Association between short term response and disease specific characteristics
| SHORT TERM RESPONSE | P value | |||
|---|---|---|---|---|
| T Stage | T1/T2 | T3/T4 | ||
| CR | 92% | 66% | ||
| PR | 5% | 25% | ||
| SD | 3% | 6% | ||
| PD | 0% | 3% | 0.0190 | |
| N-M Stage | N0 and M0 | N1 or M1 | ||
| CR | 89% | 43% | ||
| PR | 9% | 40% | ||
| SD | 1% | 14% | ||
| PD | 1% | 3% | < 0.0001 | |
| Gleason score | 6–7a | 7b | 8–10 | |
| CR | 98% | 68% | 56% | |
| PR | 0% | 26% | 32% | |
| SD | 0% | 3% | 12% | |
| PD | 2% | 3% | 0% | 0.0002 |
| PSA level | < 10 ng/ml | > 10 ng/ml | ||
| CR | 94% | 66% | ||
| PR | 2% | 26% | ||
| SD | 2% | 7% | ||
| PD | 2% | 1% | 0.0070 |
Previous treatments
| Previous treatments | ||
|---|---|---|
| No | 95 | 66% |
| Irreversible electroporation (IRE) | 10 | 7% |
| Systemic therapy | 8 | 6% |
| Radiotherapy/Radioligand | 5 | 4% |
| Radical prostatectomy/TURP | 3 | 2% |
| High-intensity focused ultrasound (HIFU) | 2 | 1% |
| Thermoablation | 2 | 1% |
| Multiple | 19 | 13% |
One-year progression free survival in the analysis by subgroups
| GROUPS | 1-year PFS | C.I. 95% | N at risk at 12 months | P value |
|---|---|---|---|---|
| Whole cohort | 88% | 80%–97% | 43 | |
| Stage | ||||
| T1/T2 | 100% | 100% | 15 | |
| T3/T4 | 83% | 71%–95% | 28 | 0.0361 |
| N0 and M0 | 92% | 84%–100% | 33 | |
| N1 or M1 | 79% | 61%–98% | 10 | 0.0007 |
| Gleason score | ||||
| 6–7a | 96% | 89%–100% | 19 | |
| 7b | 83% | 66%–100% | 13 | |
| 8–10 | 83% | 66%–100% | 10 | 0.5368 |
| PSA | ||||
| < 10 ng/ml | 95% | 86%–100% | 20 | |
| > 10 ng/ml | 84% | 72%–96% | 23 | 0.0417 |