
FIGURE 1.
Improvement in patients symptoms shown by r-ESAS questionnaire_ Each symptom is rated on a scale from 0 to 10, with a higher value indicating a more severe symptom
| Parameter | Before (0-10) | After 3 months (0-10) |
|---|---|---|
| VAS (Pain) | 5 | 0 |
| Fatigue | 3 | 0 |
| Dizziness | 3 | 0 |
| Nausea | 2 | 0 |
| Inappetence | 1 | 0 |
| Dyspnoea | 1 | 0 |
| Depression | 4 | 0 |
| Anxiety | 4 | 2 |
| Overall Well-Being | 4 | 2 |
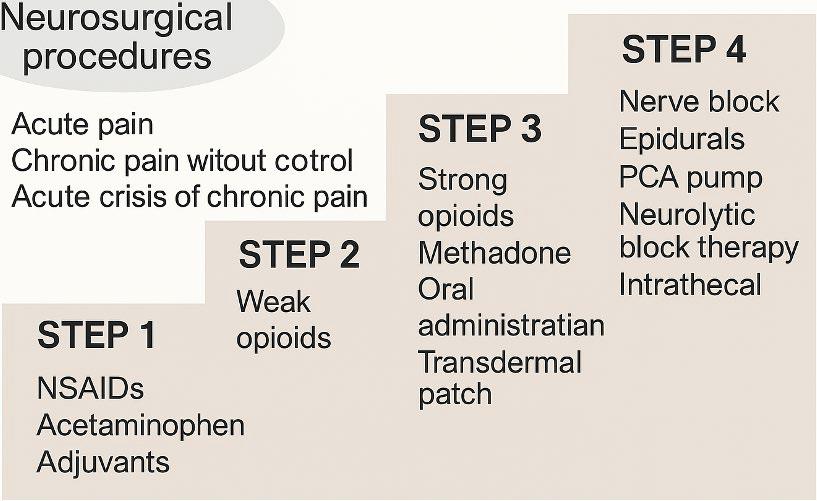
Pharmacological treatment according to the WHO analgesic ladder
| Mild pain | Moderate pain | Severe pain |
|---|---|---|
| NSAID Paracetamol Metamizole | Tramadol Codeine | Morphine Fentanyl Methadone Oxycodone Hydromorphone Buprenorphine Tapentadol |
Improvement in patients symptoms shown by EORTC QLQ-C30 questionnaire
| Category | Parameter | Before (0-100) | After 3 months (0-100) |
|---|---|---|---|
| Symptoms | Pain | 83.3 | 50 |
| Insomnia | 100 | 33.3 | |
| Appetite Loss | 66.7 | 0 | |
| Constipation | 100 | 66.7 | |
| Nausea and Vomiting | 50 | 0 | |
| Functioning | Physical | 73.3 | 80 |
| Role | 66.7 | 100 | |
| Emotional | 0 | 75 | |
| Cognitive | 50 | 100 | |
| Social | 50 | 100 |