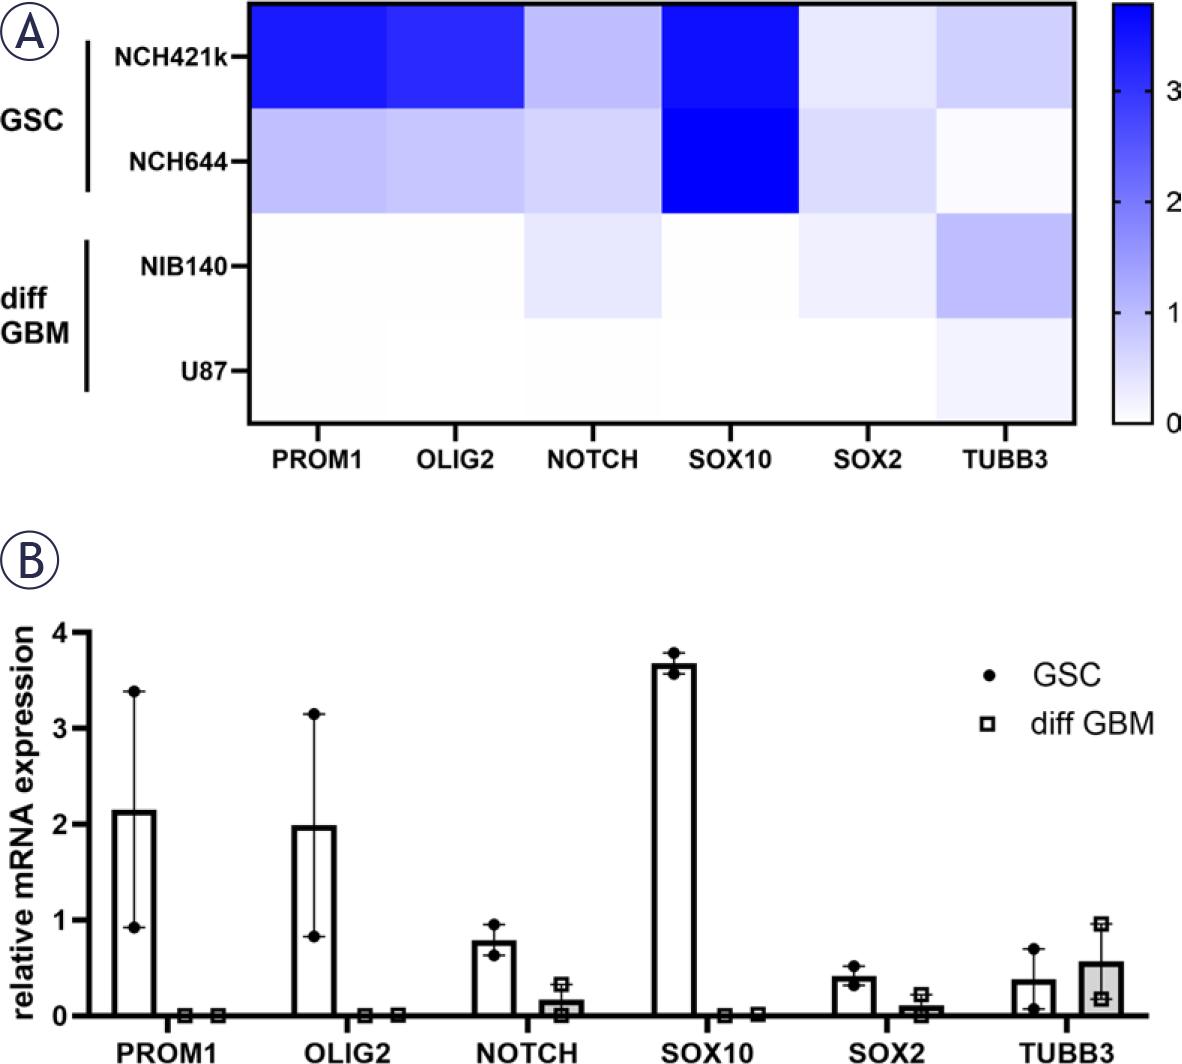
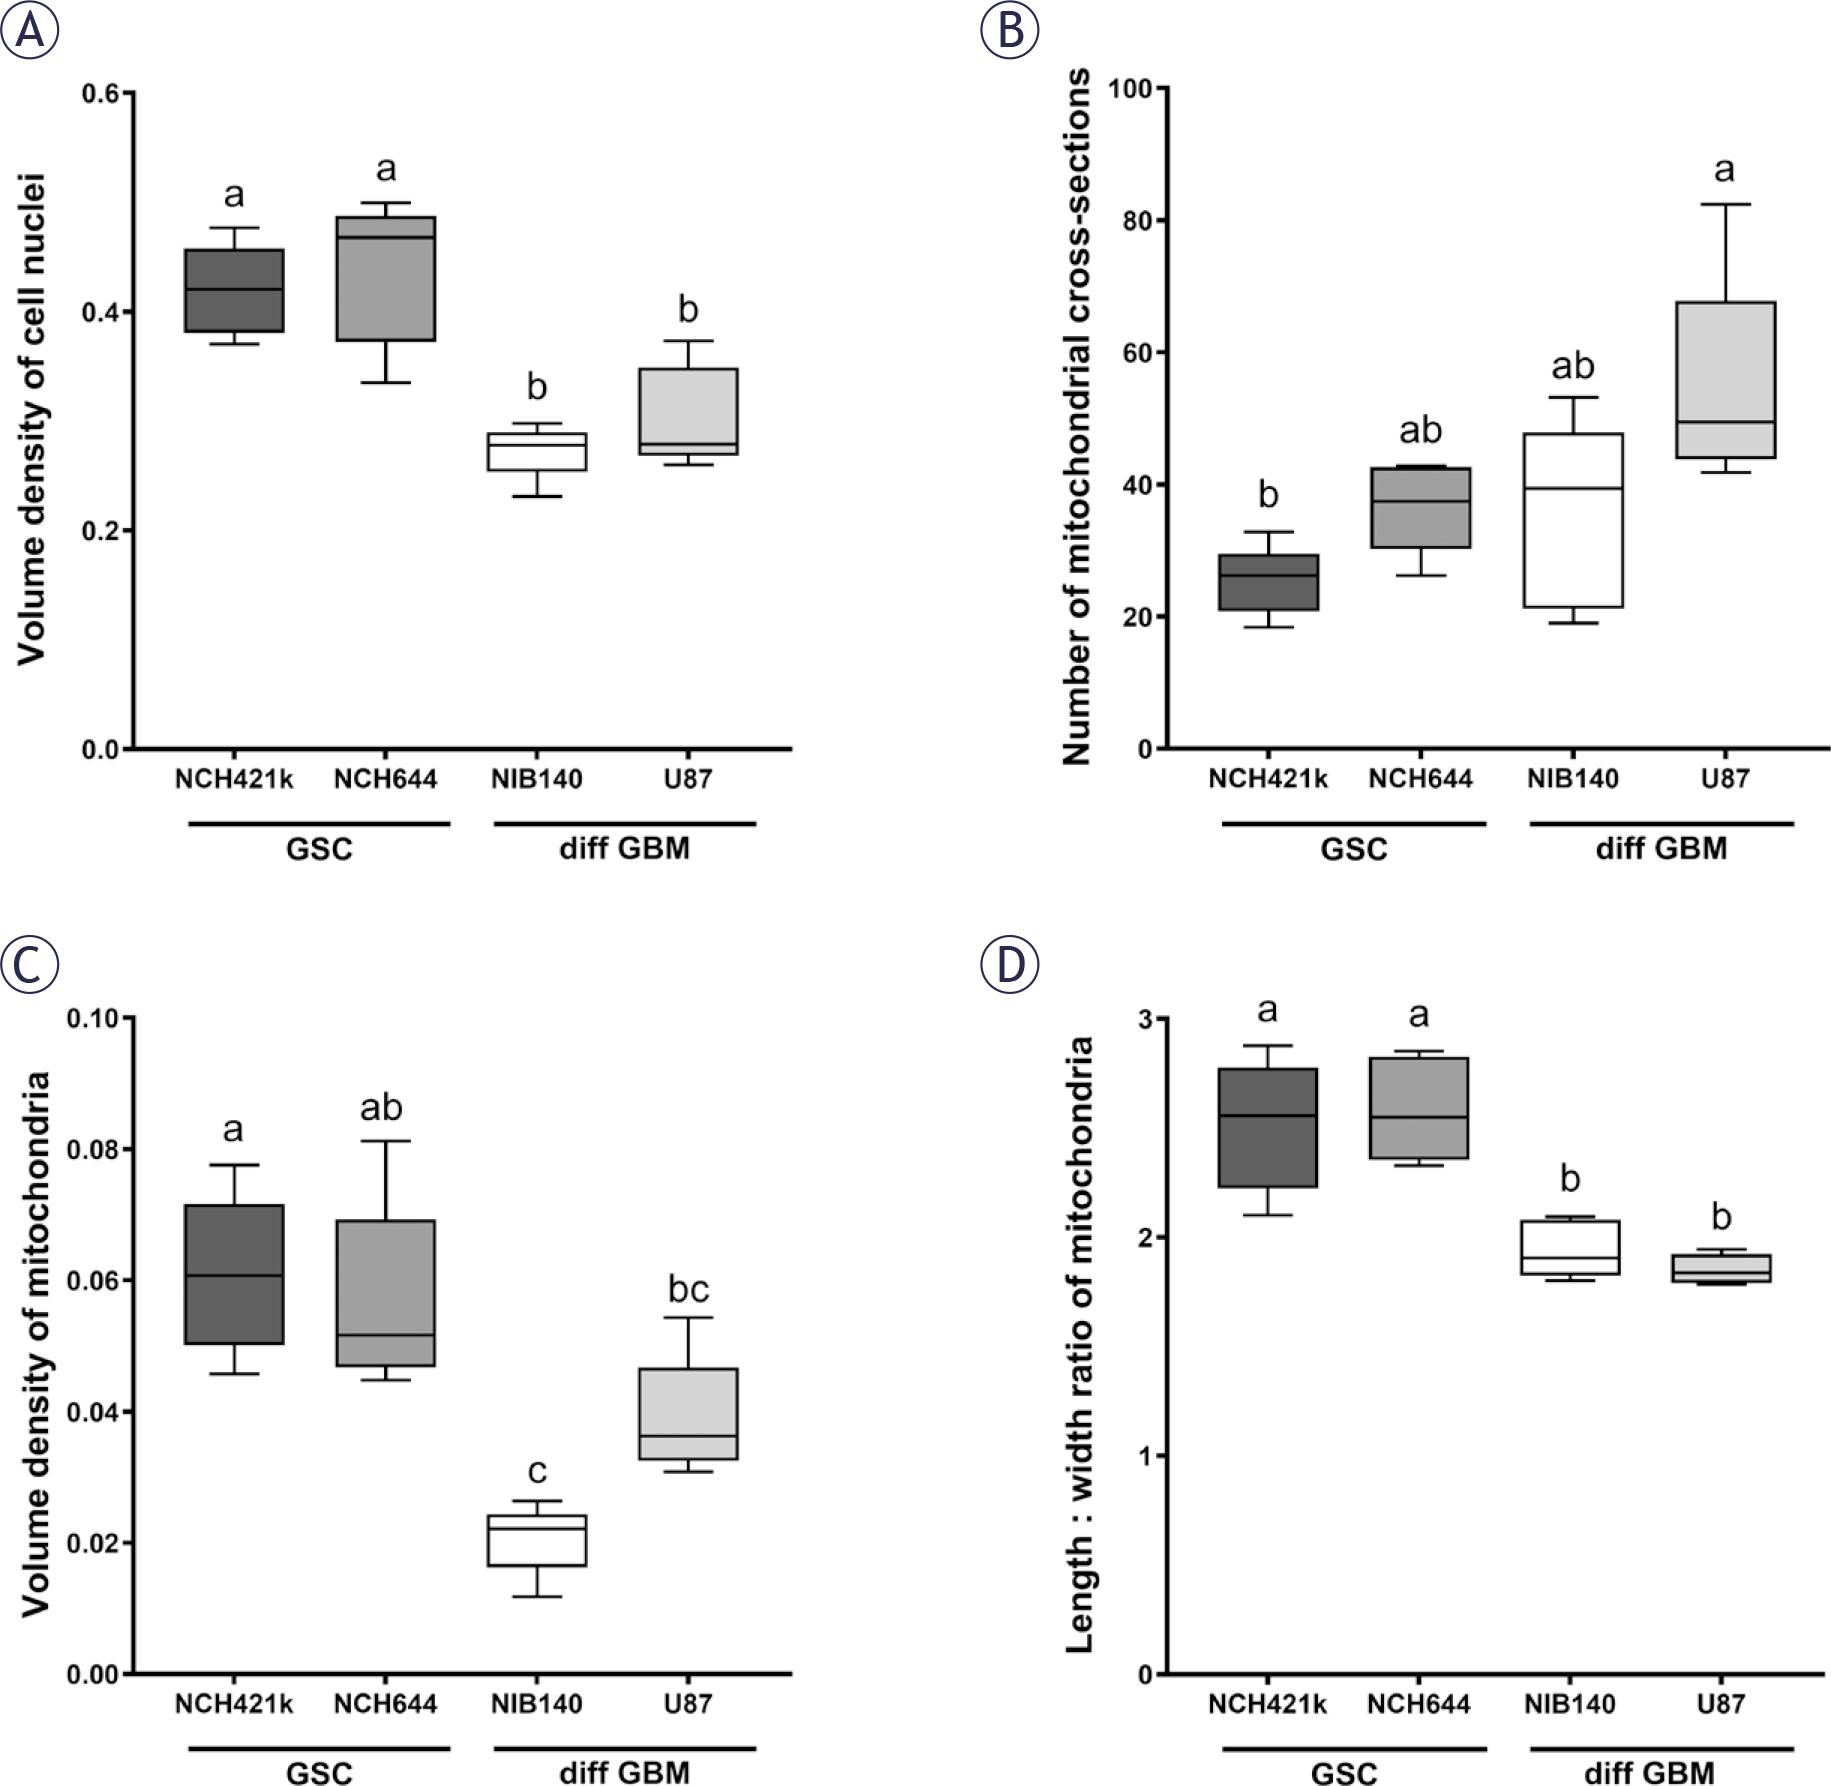
Have a personal or library account? Click to login
Heterogenous mitochondrial ultrastructure and metabolism of human glioblastoma cells: differences between stem-like and differentiated cancer cells in response to chemotherapy Cover

Heterogenous mitochondrial ultrastructure and metabolism of human glioblastoma cells: differences between stem-like and differentiated cancer cells in response to chemotherapy

Open Access
|Oct 2025

Figures & Tables

FIGURE 1.

Relative mRNA expression of GSC (PROM1, OLIG2, NOTCH, SOX10, SOX2) and differentiation (TUBB3) markers in GSCs and differentiated GBM cells based on RT-qPCR analysis. (A) A heatmap of relative mRNA expression is shown for each cell lines. (B) Combined data are shown with mean values of relative mRNA expression ± SEM.
diff GBM = differentiated glioblastoma cell; GSC = glioblastoma stem-like cell; RT-qPCR = realtime quantitative polymerase chain reaction; SEM = standard error of the mean
Relative mRNA expression of GSC (PROM1, OLIG2, NOTCH, SOX10, SOX2) and differentiation (TUBB3) markers in GSCs and differentiated GBM cells based on RT-qPCR analysis. (A) A heatmap of relative mRNA expression is shown for each cell lines. (B) Combined data are shown with mean values of relative mRNA expression ± SEM. diff GBM = differentiated glioblastoma cell; GSC = glioblastoma stem-like cell; RT-qPCR = realtime quantitative polymerase chain reaction; SEM = standard error of the mean

FIGURE 2.

Quantification of (A) volume density of cell nuclei, (B) number of mitochondrial cross-sections per cell, (C) volume density of mitochondria and (D) length/width ratio of mitochondrial cross-sections. Data are represented by mean values ± SEM. Statistically significant differences are displayed with compact letters display (a, b, c). Cell lines that do not share any common letter have statistically significantly different means of a dependent variable (p < 0.05). Cell lines that share a common letter do not have statistically significant different means of a dependent variable (p ≥ 0.05).
diff GBM = differentiated glioblastoma cell; GSC = glioblastoma stem-like cell; SEM = standard error of the mean
Quantification of (A) volume density of cell nuclei, (B) number of mitochondrial cross-sections per cell, (C) volume density of mitochondria and (D) length/width ratio of mitochondrial cross-sections. Data are represented by mean values ± SEM. Statistically significant differences are displayed with compact letters display (a, b, c). Cell lines that do not share any common letter have statistically significantly different means of a dependent variable (p < 0.05). Cell lines that share a common letter do not have statistically significant different means of a dependent variable (p ≥ 0.05). diff GBM = differentiated glioblastoma cell; GSC = glioblastoma stem-like cell; SEM = standard error of the mean

FIGURE 3.

Mitochondria in GSCs have elongated mitochondria. (A) Electron-dense mitochondria (M) with narrow cristae (arrow) oriented along the longitudinal axis of mitochondria in the NCH421k glioblastoma stem-like cells (GSCs). (B) Electrondense mitochondria (M) with dilated cristae (arrow) in the NCH421k GSCs. (C) Typical electron-dense mitochondria (M) with narrow cristae (arrow) oriented along the longitudinal axis of mitochondria in the NCH644 GSCs. (D) Deformed cristae with swirled shape (arrow) in a mitochondrion of a NCH644 cells.

FIGURE 4.

Mitochondria in differentiated GBM cells are smaller and fragmented. (A) Electron-lucent swollen mitochondria (M) with reduced cristae (arrow) in NIB140 cells. (B) Condensed electron-dense mitochondria (M) with dilated cristae (arrows) in NIB140 cells. (C) Electron-lucent swollen mitochondria (M) with reduced cristae in U87 cells. (D) Condensed electron-dense mitochondria (M) with dilated cristae (arrows) in U87 cells.

FIGURE 5.

Mitochondrial ultrastructure and its quantification after exposure of cells to 100 μM TMZ. (A) Mitochondria were classified into two following types: normal and defective. Normal mitochondria are defined as mitochondria with electron-dense matrix with narrow cristae indicating metabolism with a high OXPHOS rate (a) and mitochondria with electron-dense matrix with dilated cristae indicating metabolism with a lower OXPHOS rate (b). Defective mitochondria are defined as mitochondria with electron-lucent matrix and cristae reduced in size and numbers indicating metabolism without OXPHOS (c) and mitochondria with abnormal ultrastructural alterations (swollen with membrane swirls) indicating damage and stress in mitochondria (d). (B) Quantification of the 2 categories of mitochondrial ultrastructure as fraction of all mitochondria. Experiments were performed in two independent repeats.
diff GBM = differentiated glioblastoma cell; GSC = glioblastoma stem-like cell; OXPHOS = oxidative phosphorylation; TMZ = temozolomide
Mitochondrial ultrastructure and its quantification after exposure of cells to 100 μM TMZ. (A) Mitochondria were classified into two following types: normal and defective. Normal mitochondria are defined as mitochondria with electron-dense matrix with narrow cristae indicating metabolism with a high OXPHOS rate (a) and mitochondria with electron-dense matrix with dilated cristae indicating metabolism with a lower OXPHOS rate (b). Defective mitochondria are defined as mitochondria with electron-lucent matrix and cristae reduced in size and numbers indicating metabolism without OXPHOS (c) and mitochondria with abnormal ultrastructural alterations (swollen with membrane swirls) indicating damage and stress in mitochondria (d). (B) Quantification of the 2 categories of mitochondrial ultrastructure as fraction of all mitochondria. Experiments were performed in two independent repeats. diff GBM = differentiated glioblastoma cell; GSC = glioblastoma stem-like cell; OXPHOS = oxidative phosphorylation; TMZ = temozolomide

FIGURE 6.

Metabolic profiles of GSCs and differentiated GBM cells as determined by extracellular flux analysis and XF Real-time ATP Rate Assay Kit (Seahorse, Agilent). (A, B) Representative kinetic graphs of oxygen consumption rate (OCR) and extracellular acidification rate (ECAR) in response to oligomycin and rotenone/antimycin A (Rot/AA) are shown. (C) Mitochondrial (mito) and glycolytic (glyco) ATP production rate in cells with respective statistics are shown in the table. Statistically significant differences in ATP production are marked directly on the graph. (D) Ratio between mito ATP and glyco ATP production rates in cells. (E) Metabolic profiles of cells that can be aerobic, energetic, quiescent and glycolytic. Values are shown as means ± SD (A, B) or SEM (C-E). Experiments were performed in 3 independent repeats (n = 3). Statistics were performed using Tukey’s multiple comparisons test.
ATP = adenosine triphosphate; diff GBM = differentiated glioblastoma cell; GSC = glioblastoma stem-like cell; SEM = standard error of the mean; XF = extracellular flux; * p < 0.05; ** p < 0.01; *** p < 0.001
Metabolic profiles of GSCs and differentiated GBM cells as determined by extracellular flux analysis and XF Real-time ATP Rate Assay Kit (Seahorse, Agilent). (A, B) Representative kinetic graphs of oxygen consumption rate (OCR) and extracellular acidification rate (ECAR) in response to oligomycin and rotenone/antimycin A (Rot/AA) are shown. (C) Mitochondrial (mito) and glycolytic (glyco) ATP production rate in cells with respective statistics are shown in the table. Statistically significant differences in ATP production are marked directly on the graph. (D) Ratio between mito ATP and glyco ATP production rates in cells. (E) Metabolic profiles of cells that can be aerobic, energetic, quiescent and glycolytic. Values are shown as means ± SD (A, B) or SEM (C-E). Experiments were performed in 3 independent repeats (n = 3). Statistics were performed using Tukey’s multiple comparisons test. ATP = adenosine triphosphate; diff GBM = differentiated glioblastoma cell; GSC = glioblastoma stem-like cell; SEM = standard error of the mean; XF = extracellular flux; * p < 0.05; ** p < 0.01; *** p < 0.001

FIGURE 7.

Metabolic profiles and their differences after treatment with 100 μM TMZ in GSCs and differentiated GBM cells and determined by extracellular flux analysis and XF Real-time ATP Rate Assay Kit (Seahorse, Agilent). (A) Changes in ATP production, glycolytic (glyco) ATP and mitochondrial (mito) ATP production rate after treatment with TMZ were not detected. (B) Differences in ratio between mito and glyco ATP production rates after treatment with TMZ. Values are shown as means ± SEM. Experiments were performed in 3 independent repeats (n = 3). Unpaired t-test was performed to compare statistical difference between control and treated samples within each cell line (A). Tukey’s multiple comparisons test was used to compare all conditions after treatment with TMZ (B).
ATP = adenosine triphosphate; SEM = standard error of the mean; TMZ = temozolomide; XF = extracellular flux; * p < 0.05, ** p < 0.01, *** p < 0.001
Metabolic profiles and their differences after treatment with 100 μM TMZ in GSCs and differentiated GBM cells and determined by extracellular flux analysis and XF Real-time ATP Rate Assay Kit (Seahorse, Agilent). (A) Changes in ATP production, glycolytic (glyco) ATP and mitochondrial (mito) ATP production rate after treatment with TMZ were not detected. (B) Differences in ratio between mito and glyco ATP production rates after treatment with TMZ. Values are shown as means ± SEM. Experiments were performed in 3 independent repeats (n = 3). Unpaired t-test was performed to compare statistical difference between control and treated samples within each cell line (A). Tukey’s multiple comparisons test was used to compare all conditions after treatment with TMZ (B). ATP = adenosine triphosphate; SEM = standard error of the mean; TMZ = temozolomide; XF = extracellular flux; * p < 0.05, ** p < 0.01, *** p < 0.001

List of TaqMan gene expression assays fluorescent dye -minor groove binder (FAM-MGB)

Gene nameSourceIdentifierProtein name
PROM1Thermo Fisher ScientificHs01009259_m1Prominin -1; CD133 antigen
OLIG2Thermo Fisher ScientificHs00377820_m1Oligodendrocyte transcription factor 2
NOTCH1Thermo Fisher ScientificHs01062014_m1Neurogenic locus notch homolog protein 1
SOX10Thermo Fisher ScientificHs00366918_m1SRY - Box transcription factor 10
SOX2Thermo Fisher ScientificHs01053049_m1SRY - Box transcription factor 2
TUBB3Thermo Fisher ScientificHs00801390_s1Tubulin beta 3 class III
HPRT1Thermo Fisher ScientificHs02800695_m1Hypoxanthine phosphoribosyltransferase 1
GAPDHThermo Fisher ScientificHs00909233_m1Glial fibrillary acidic protein
DOI: https://doi.org/10.2478/raon-2025-0056 | Journal eISSN: 1581-3207 | Journal ISSN: 1318-2099
Language: English
Page range: 551 - 565
Submitted on: Jun 11, 2025
|
Accepted on: Aug 13, 2025
|
Published on: Oct 27, 2025
In partnership with: Paradigm Publishing Services
Publication frequency: 4 issues per year

© 2025 Urban Bogataj, Metka Novak, Simona Katrin Galun, Klementina Fon Tacer, Milos Vittori, Cornelis J.F. Van Noorden, Barbara Breznik, published by Association of Radiology and Oncology
This work is licensed under the Creative Commons Attribution 4.0 License.