
FIGURE 1.
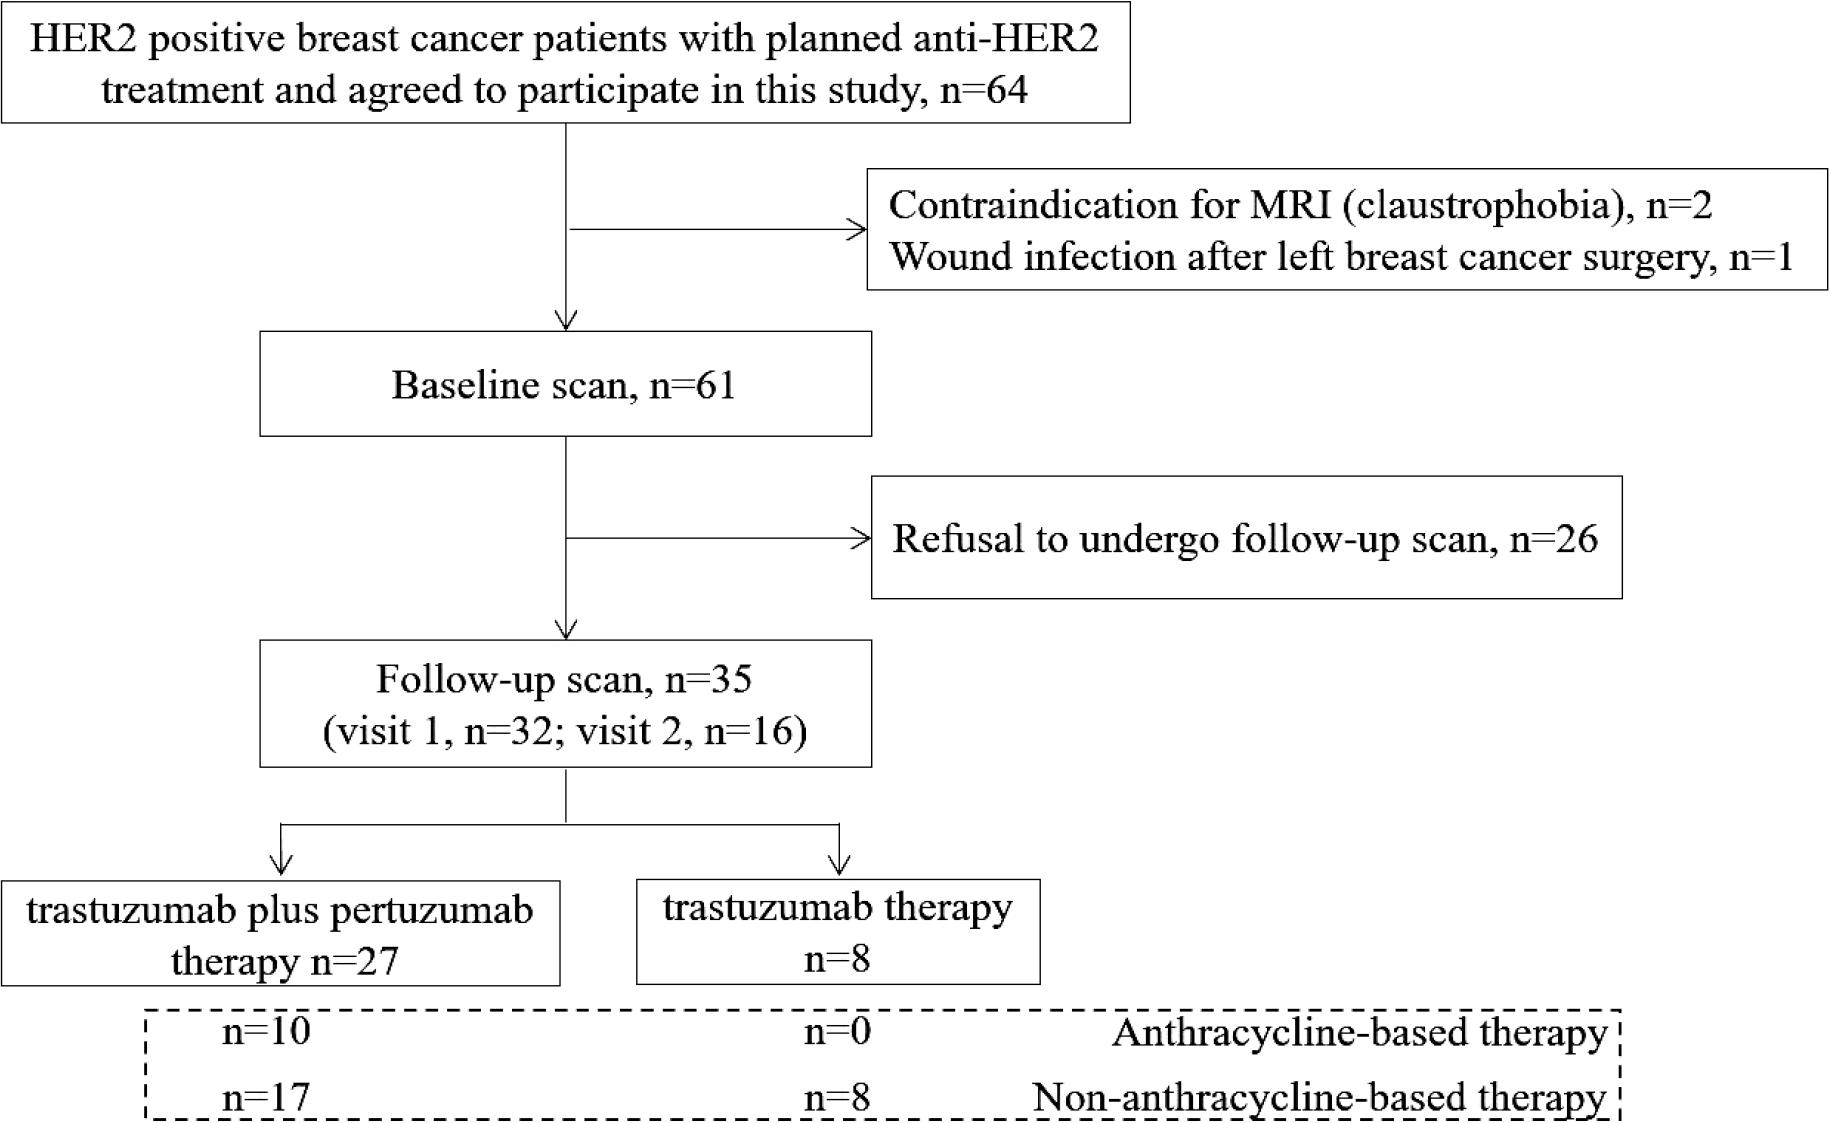
FIGURE 2.
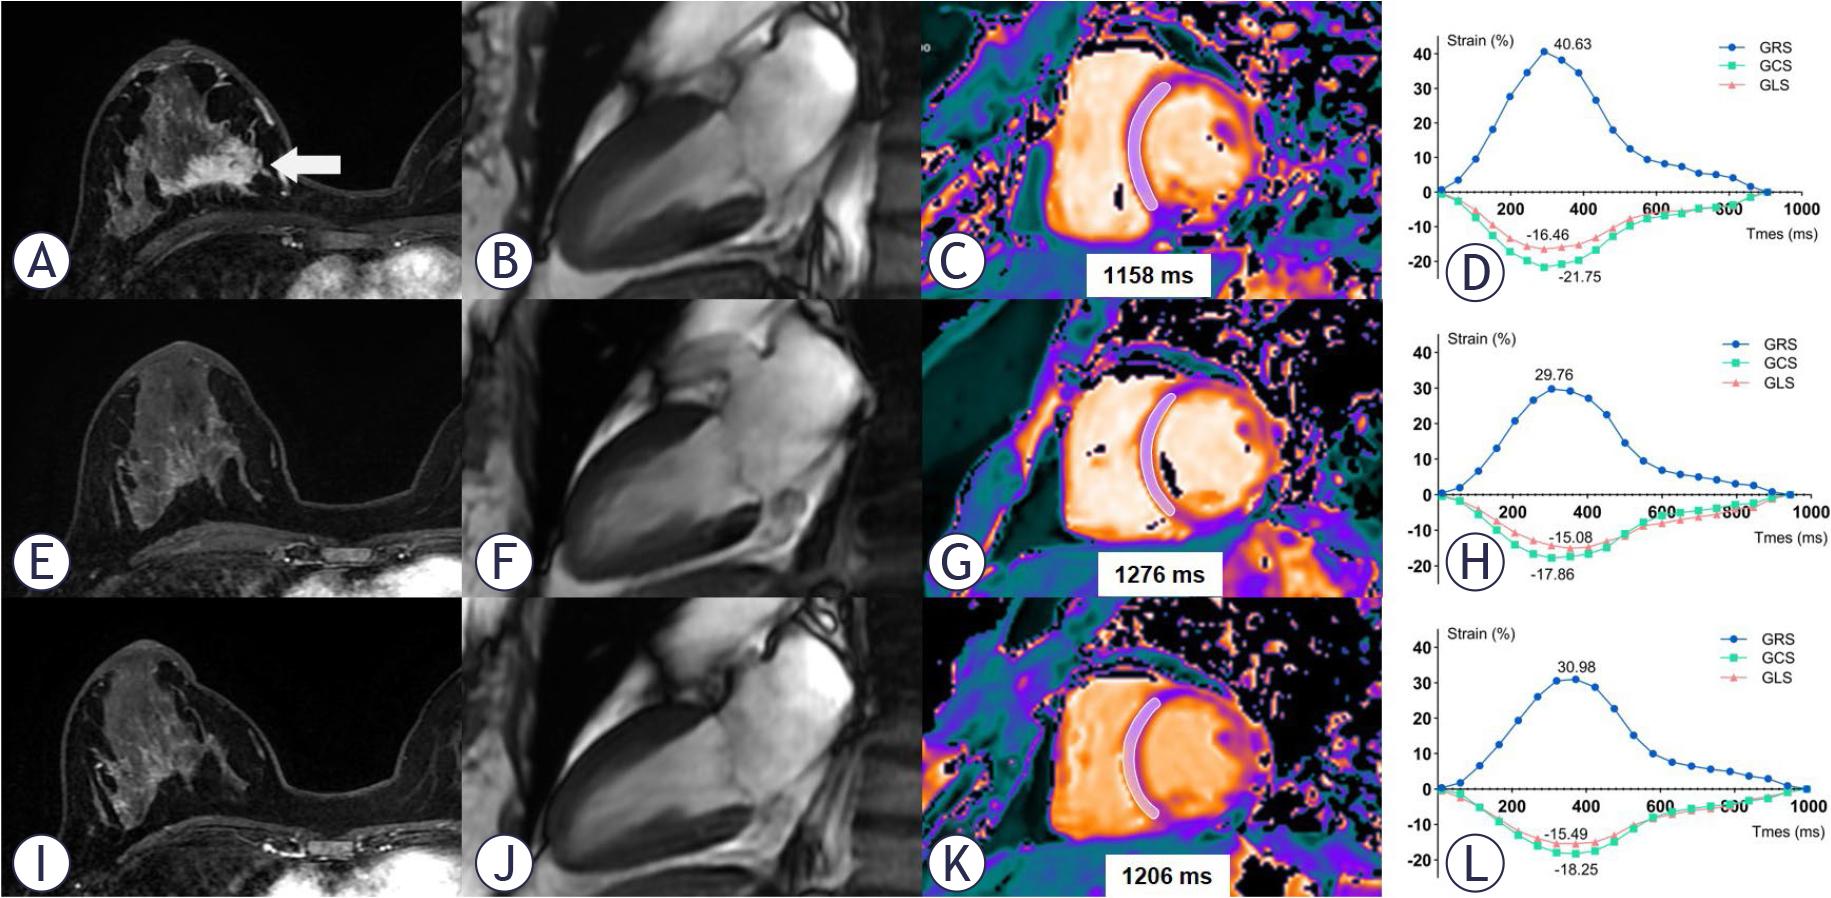
FIGURE 3.
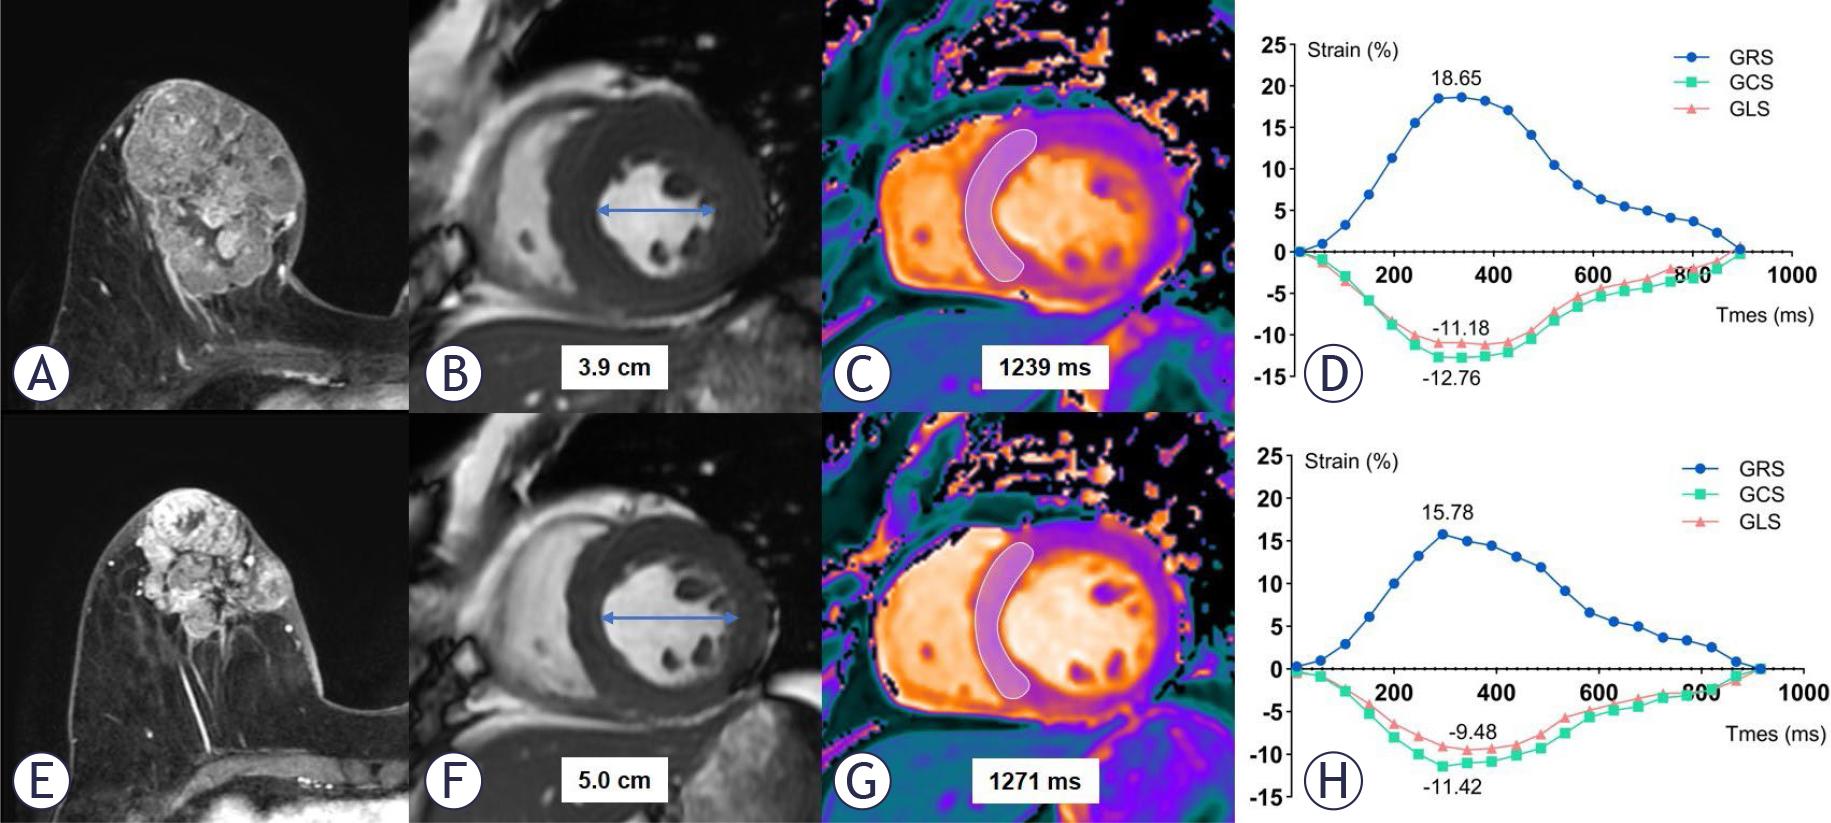
FIGURE 4.
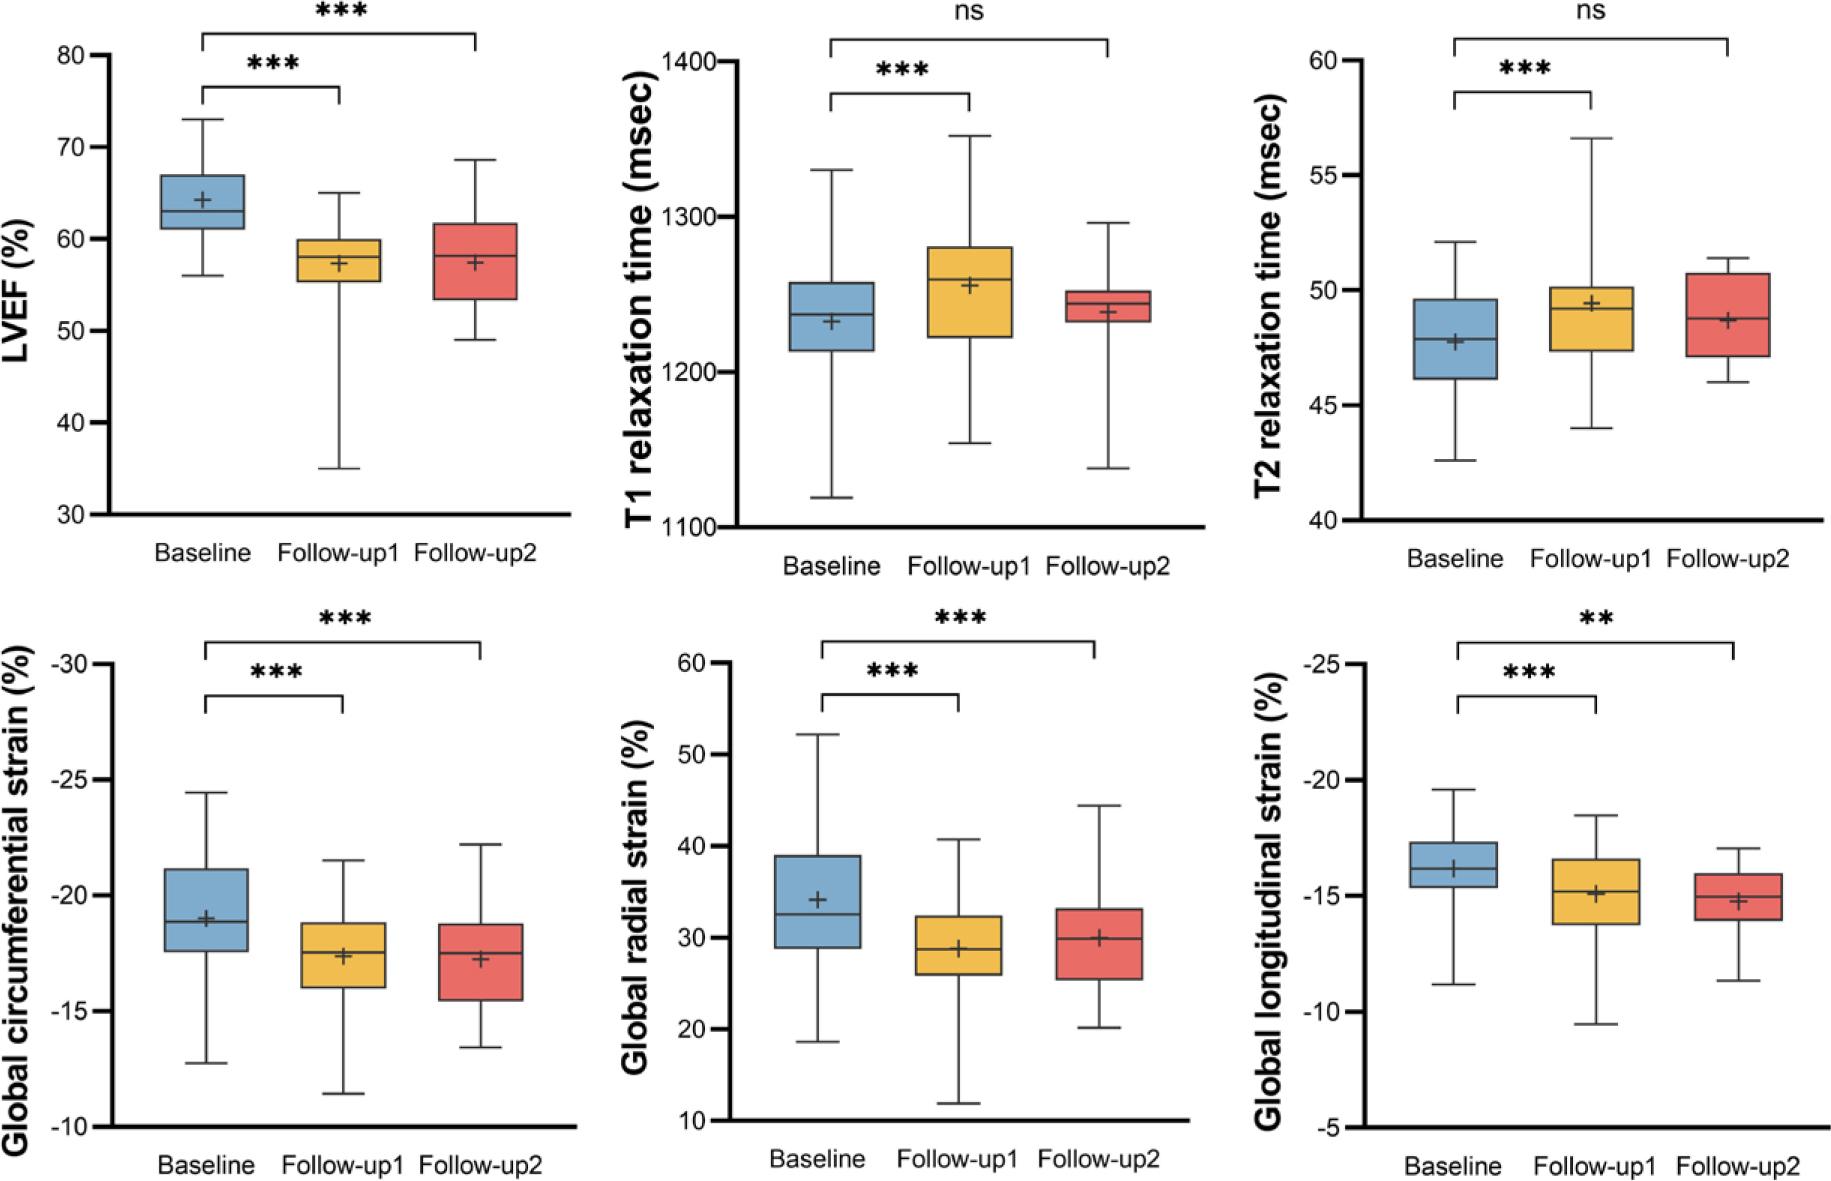
FIGURE 5.
Clinical characteristics and treatment of the study participants
| Variable | Value |
|---|---|
| No. of participants | 35 |
| Age, years* | 48.86 ± 10.34 |
| Height (cm)* | 160.97 ± 4.20 |
| Weight (kg)* | 62.61 ± 8.36 |
| Body surface area (m2)* | 1.63 ± 0.12 |
| Hypertension† | 5 (14%) |
| Chronic kidney disease | 0 |
| Current smoker or significant smoking history | 0 |
| Obesity (BMI > 30 kg/m2) † | 4 (11%) |
| Age 65–79 years† | 2 (6%) |
| Diabetes | 0 |
| Hyperlipidaemia | 0 |
| Prior cardiovascular disease | 0 |
| HFA-ICOS baseline cardiovascular toxicity risk stratification† | |
| Moderate risk (moderate risk factors with a total of 2–3 points) | 4 (11%) |
| Low risk | 31 (89%) |
| No risk factor | 18 (52%) |
| One moderate risk factor with a total of 1 point | 13 (37%) |
| Therapies† | |
| HER2-targeted therapies without anthracycline | 25 (71%) |
| Trastuzumab | 8 (23%) |
| Trastuzumab and pertuzumab | 17 (48%) |
| Anthracycline chemotherapy followed by a taxane plus trastuzumab plus pertuzumab | 10 (29%) |
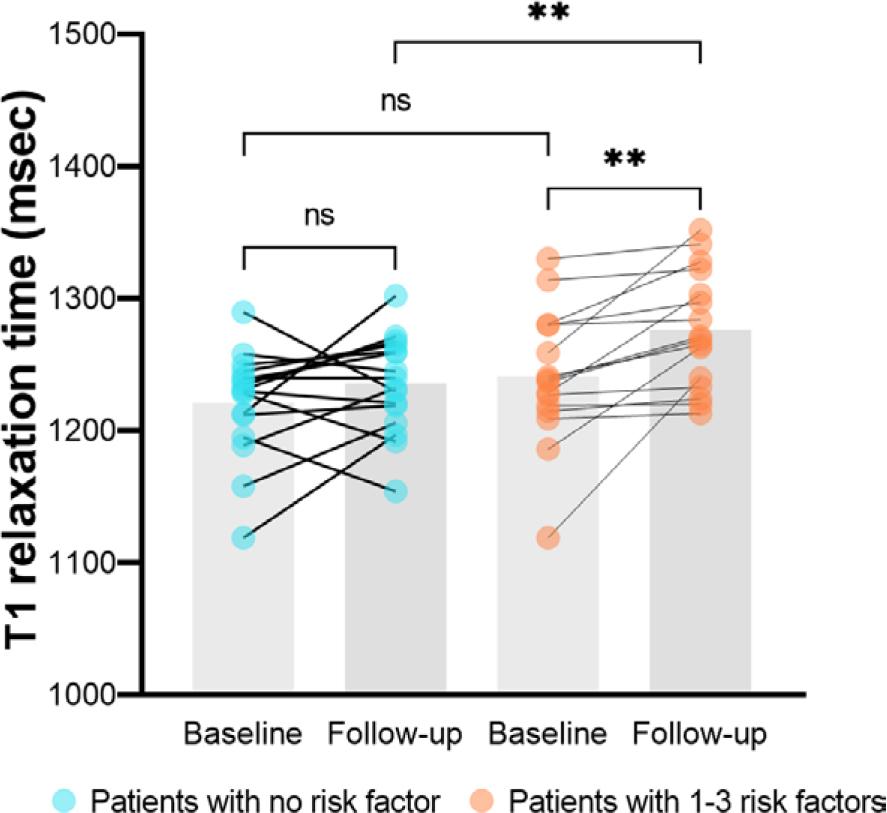
Differences in CMR parameters at follow-up 1 between patients with and without baseline risk factors
| Variable | Patients with no risk factor (n = 16) | Patients with 1-3 risk factors (n = 16) | P Value |
|---|---|---|---|
| LV ejection fraction (%) | 57.92 ± 3.43 | 56.75 ± 6.79 | 0.543 |
| LV end-diastolic volume index (mL/m2) | 63.88 ± 10.89 | 67.39 ± 14.92 | 0.454 |
| LV end-systolic volume index (mL/m2) | 26.89 ± 5.66 | 29.63 ± 11.70 | 0.406 |
| LV mass index (g/m2) | 37.07 ± 6.68 | 43.03 ± 8.86 | 0.040 |
| Stroke volume index (mL/m2) | 36.60 ± 6.67 | 37.61 ± 6.36 | 0.665 |
| Cardiac output index (L/min×m2) | 2.84 ± 0.48 | 2.99 ± 0.49 | 0.387 |
| Global radial strain | 30.56 ± 5.40 | 27.07 ± 6.94 | 0.123 |
| Global circumferential strain | -17.94 ± 2.16 | -16.82 ± 2.37 | 0.174 |
| Global longitudinal strain | -15.11 ± 1.85 | -15.06 ± 1.90 | 0.938 |
| T1 value (msec) | 1235.06 ± 36.77 | 1276.56 ± 44.25 | 0.007 |
| T2 value (msec) | 48.95 ± 2.28 | 49.94 ± 3.07 | 0.318 |
| Heart rate during MR scan (bpm) | 77.56 ± 11.28 | 81.38 ± 15.37 | 0.430 |
Cardiac magnetic resonance (CMR) parameter results between follow-up 1 and follow-up 2 (n = 13)
| Variable | Follow-up 1 | Follow-up 2 | P Value |
|---|---|---|---|
| LV ejection fraction (%) | 58.45 ± 4.44 | 57.76 ± 5.53 | 0.545 |
| LV end-diastolic volume index (mL/m2) | 66.33 ± 11.13 | 62.32 ± 14.02 | 0.055 |
| LV end-systolic volume index (mL/m2) | 27.59 ± 6.20 | 26.35 ± 7.46 | 0.294 |
| LV mass index (g/m2) | 38.07 (36.22, 44.09) | 39.13 (35.77, 43.31) | 0.650 |
| Stroke volume index (mL/m2) | 39.37 (35.27, 43.55) | 39.44 (27.44, 40.83) | 0.101 |
| Cardiac output index (L/min×m2) | 3.01 ± 0.47 | 2.60 ± 0.54 | 0.022 |
| Global radial strain | 28.69 ± 8.12 | 29.70 ± 6.48 | 0.670 |
| Global circumferential strain | -17.70 ± 2.52 | -17.12 ± 2.30 | 0.172 |
| Global longitudinal strain | -15.01 ± 1.46 | -14.74 ±1.70 | 0.647 |
| T1 value (msec) | 1245.31 ± 22.46 | 1236.77 ± 40.36 | 0.486 |
| T2 value (msec) | 49.67 ± 2.19 | 49.11 ± 2.12 | 0.465 |
| Heart rate during MR scan (bpm) | 78.38 ± 14.67 | 73.92 ± 13.09 | 0.189 |
CMR parameter results between patients treated with anthracycline-based and non-anthracycline-based antihuman epidermal growth factor receptor 2 (HER2) therapies at follow-up 1
| Variable | Anthracycline-based therapy (n = 10) | Non-anthracycline-based therapy (n = 22) | P Value |
|---|---|---|---|
| LV ejection fraction (%) | 57.01 ± 3.68 | 57.49 ± 5.99 | 0.816 |
| LV end-diastolic volume index (mL/m2) | 67.51 ± 12.83 | 64.78 ± 13.24 | 0.590 |
| LV end-systolic volume index (mL/m2) | 28.88 ± 6.01 | 27.98 ± 10.38 | 0.800 |
| LV mass index (g/m2) | 41.76 ± 7.91 | 39.28 ± 8.53 | 0.442 |
| Stroke volume index (mL/m2) | 38.58 ± 7.78 | 36.43 ± 5.80 | 0.389 |
| Cardiac output index (L/min×m2) | 3.13 ± 0.49 | 2.82 ± 0.46 | 0.094 |
| Global radial strain | 26.73 ± 6.62 | 29.76 ± 6.16 | 0.218 |
| Global circumferential strain | -17.09 ± 1.92 | -17.52 ± 2.49 | 0.637 |
| Global longitudinal strain | -15.36 (-16.56, -13.74) | -15.07 ± 2.05 | 1.000 |
| T1 value (msec) | 1280.90 ± 43.10 | 1244.41 ± 42.29 | 0.032 |
| T2 value (msec) | 49.65 (47.06, 53.10) | 49.04 ± 2.23 | 0.231 |
| Heart rate during MR scan (bpm) | 84.20 ± 18.44 | 77.32 ± 10.20 | 0.182 |
Cardiac magnetic resonance (CMR) parameter results at baseline and follow-up
| Variable | Follow-up 1 (n = 32) | Follow-up 2 (n = 16) | ||||
|---|---|---|---|---|---|---|
| Baseline 1 | Follow-up 1 | P Value | Baseline 2 | Follow-up 2 | P Value | |
| LV ejection fraction (%) | 64.03 ± 4.16 | 57.34 ± 5.32 | < 0.001 | 66.23 ± 4.19 | 57.45 ± 5.54 | < 0.001 |
| LV end-diastolic volume index (mL/m2) | 68.23 ± 12.41 | 65.63 ± 12.97 | > 0.057 | 68.20 ± 11.56 | 64.94 ± 14.01 | 0.275 |
| LV end-systolic volume index (mL/m2) | 24.53 ± 6.17 | 28.26 ± 9.15 | 0.001 | 22.91 ± 5.02 | 27.70 ± 7.60 | 0.002 |
| LV mass index (g/m2) | 37.17 (33.96, 43.69) | 38.24 (34.40, 41.45) | 0.369 | 39.23 ± 6.31 | 40.03 ± 6.78 | 0.261 |
| Stroke volume index (mL/m2) | 43.36 ± 8.12 | 37.10 ± 6.43 | < 0.001 | 44.84 ± 8.12 | 39.46 (30.13, 42.17) | 0.002 |
| Cardiac output index (L/min×m2) | 3.23 ± 0.58 | 2.91 ± 0.49 | 0.002 | 3.19 ± 0.38 | 2.65 ± 0.51 | 0.001 |
| Global radial strain | 33.59 ± 7.31 | 28.81 ± 6.37 | 0.001 | 37.16 ± 8.99 | 30.07 ± 6.18 | < 0.001 |
| Global circumferential strain | -18.86 ± 2.41 | -17.38 ± 2.31 | < 0.001 | -19.93 ± 2.81 | -17.23 ± 2.34 | < 0.001 |
| Global longitudinal strain | -16.12 ± 1.55 | -15.09 ±1.85 | 0.001 | -16.67 ± 1.28 | -14.88 ± 1.60 | 0.004 |
| T1 value (msec) | 1231.16 46.49 | 1255.81 ± 45.23 | 0.001 | 1222.00 ± 40.89 | 1237.13 ± 35.19 | 0.051 |
| T2 value (msec) | 47.86 ± 2.17 | 49.43 ± 2.71 | 0.001 | 48.13 ± 2.15 | 48.84 ± 1.75 | 0.306 |
| Heart rate during MR scan (bpm) | 74.50 ± 11.11 | 79.47 ± 13.40 | 0.048 | 72.50 ± 9.68 | 72.69 ± 12.28 | 0.928 |