
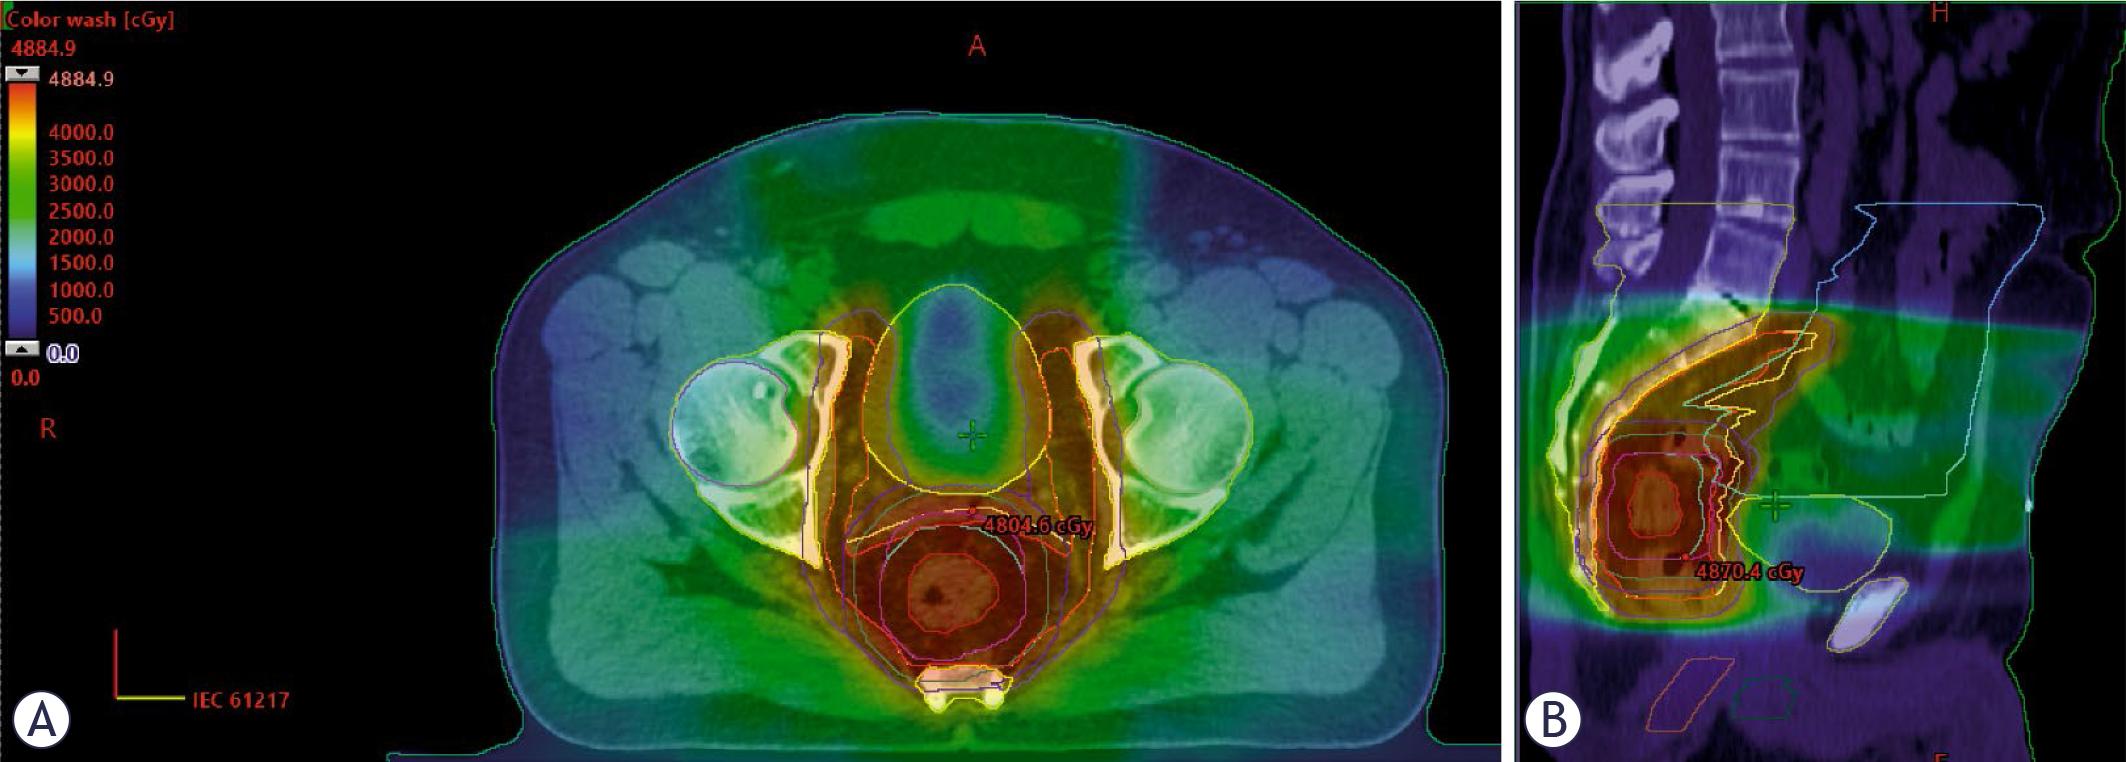
FIGURE 1.
Patient, lymphocyte count and dosimetric characteristics
| Induction chemotherapy | Consolidation chemotherapy | |
|---|---|---|
| Number of patients | 28 | 25 |
| Sex | 25 M, 3 F | 20 M, 5 F |
| Mean age at the start of treatment (years) | 59.1 (37-76) | 54.3 (33-72) |
| Mean absolute lymphocyte count at the start of treatment | 2.13 × 10⁹/L (0.78 IQR) | 1.95 × 10⁹/L (1.03 IQR) |
| Mean absolute lymphocyte count at the end of treatment | 1.12 × 10⁹/L (0.52 IQR) | 0.92 × 10⁹/L (0.37 IQR) |
| Mean change in lymphocyte count | -1.05 × 10⁹/L (0.77 IQR) | -1.10 × 10⁹/L (1.02 IQR) |
| Number of patients with RIL | 15 (53.6%) | 19 (76.0%) |
| Mean PTV size | 1273 mL (299 IQR) | 1259 mL (378 IQR) |
| Mean pelvic bone marrow volume | 1767 mL (304 IQR) | 1693 mL (362 IQR) |
| Mean dose to pelvic bone marrow | 20.38 Gy (3.04 IQR) | 20.43 Gy (2.16 IQR) |
| V5Gy | 80.23% (8.48 IQR) | 80.26% (8.75 IQR) |
| V10Gy | 71.34% (10.0 IQR) | 69.43% (11.1 IQR) |
| V20Gy | 50.95% (9.1 IQR) | 51.06% (8.6 IQR) |
| V30Gy | 26.65% (8.2 IQR) | 26.56% (6.9 IQR) |
| V40Gy | 10.25% (3.6 IQR) | 10.10% (2.9 IQR) |
| V42Gy | 5.47 % (2.1 IQR) | 4.90% (2.5 IQR) |
Neutrophil-to-lymphocyte ratio (NLR) pre- and post-treatment
| Induction chemotherapy | Consolidation chemotherapy | |
|---|---|---|
| Mean absolute neutrophil count at the start of treatment | 5.15 × 10⁹/L (1.94 IQR) | 5.79 × 10⁹/L (2.12 IQR) |
| Mean absolute neutrophil count at the end of treatment | 2.79 × 10⁹/L (0.88 IQR) | 3.03 × 10⁹/L (1.53 IQR) |
| Mean change in neutrophil count | -2.35 × 10⁹/L (1.63 IQR) | -2.76 × 10⁹/L (2.88 IQR) |
| Mean pre-treatment NLR | 2.76 (1.18 IQR) | 3.27 (2.33 IQR) |
| Mean post-treatment NLR | 2.83 (1.64 IQR) | 3.73 (1.49 IQR) |
| Mean change NLR | +0.07 (1.49 IQR) | +0.46 (2.44 IQR) |