
Figure 1.
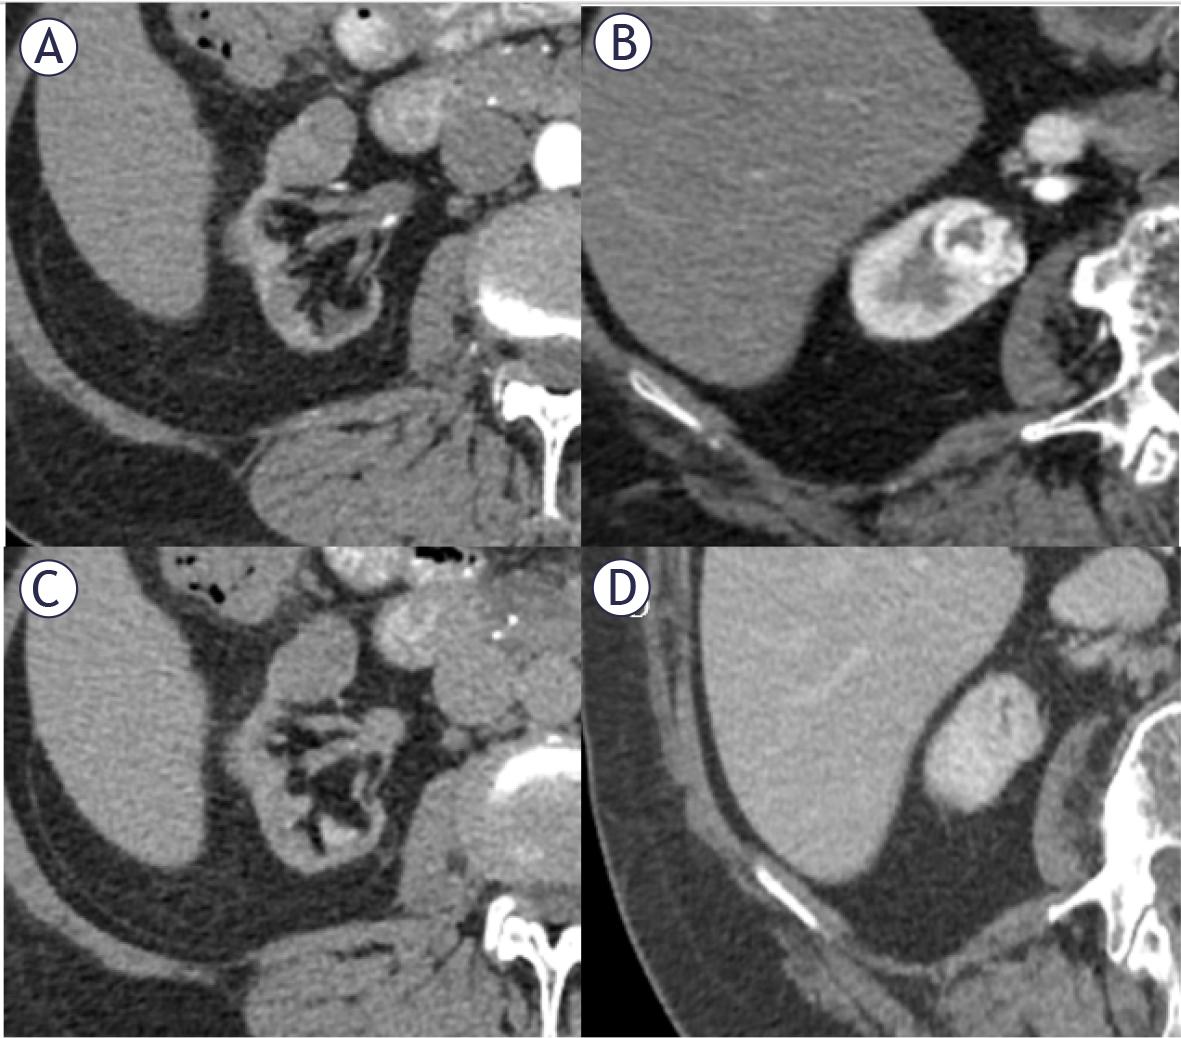
Figure 2.

Figure 3.
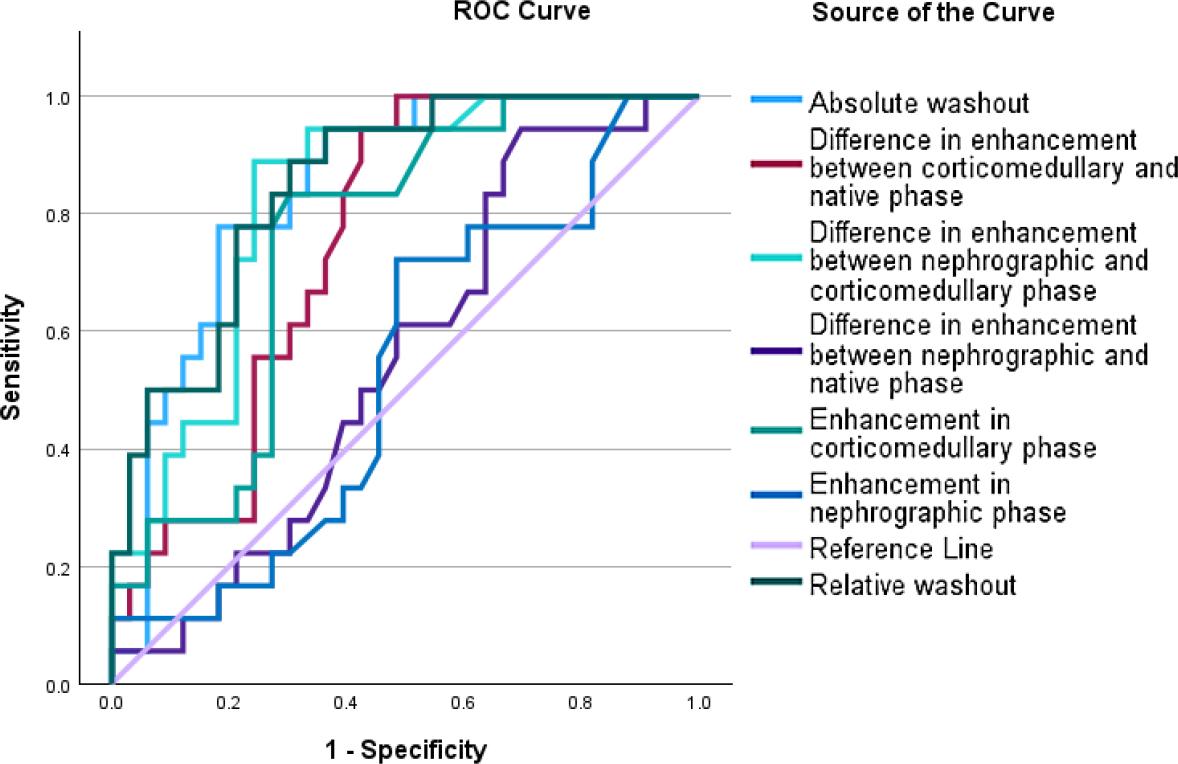
Figure 4.
Differences in risk factors detected in patients with ccRCC vs_ patients with other etiologies of indeterminate small renal masses (SRMs)
| Risk factors | ccRCC group (n = 18) | non-ccRCC group (n = 33) | p-value |
|---|---|---|---|
| All risk factors | 17 (94.4%) | 22 (66.7%) | 0.037 |
| Smoking | 11 (61.1%) | 9 (27.3%) | 0.018 |
| Family history of neoplasm | 0 (0%) | 1 (3%) | 1 |
| Genetic syndrome | 0 (0%) | 0 (0%) | 1 |
| Dialysis related cystic disease | 0 (0%) | 0 (0%) | 1 |
| Obesity | 0 (0%) | 3 (9.1%) | 0.544 |
| Hypertension | 14 (77.8%) | 16 (48.5%) | 0.042 |
| Cyclophosphamide treatment | 1 (5.6%) | 1 (3.0%) | 1 |
| Male sex | 6 (33.3%) | 19 (57.6%) | 0.098 |
Differences in CECT parameters in patients with ccRCC and patients with other etiologies of indeterminate small renal masses
| CECT Features | ccRCC (n = 18) | Non-ccRCC (n = 33) | p-value |
|---|---|---|---|
| Anatomical | |||
| Right kidney | 55.6% (10) | 36.4% (13) | 0.268 |
| Left kidney | 44.4% (8) | 60.6% (20) | 0.268 |
| Morphological | |||
| Bean-like shape | 38.9% (7) | 27.3% (9) | 0.393 |
| Ball-like shape | 61.1% (11) | 72.2% (24) | 0.393 |
| Heterogeneous mass | 88.9% (16) | 60.6% (20) | 0.034* |
| Enhancement | |||
| Significant (> 15 HU) | 94.4% (17) | 81.8% (27) | 0.398 |
| Heterogeneous enhancement | 83.3% (15) | 51.5% (17) | 0.025* |
| Washout pattern | 83.3% (15) | 33.3% (11) | < 0.001* |
| Prolonged pattern | 16.7% (3) | 66.7% (22) | < 0.001* |
| Secondary Features | |||
| Tumor-feeding vessels | 33.3% (6) | 3.0% (1) | 0.006* |
| Necrosis area | 44.4% (8) | 21.2% (7) | 0.082 |
| Calcification | 5.6% (1) | 9.1% (3) | 1.000 |
Specificity, sensitivity, accuracy, positive likelihood ratio, and positive predictive value for selected imaging parameters
| Imaging feature | Sensitivity | Specificity | Accuracy | PLR | PPV |
|---|---|---|---|---|---|
| MRI parameter | |||||
| Intense CM phase enhancement | 50.0 | 53.3 | 52.4 (36.4–68.0)% | 1.1 | 30.0 |
| ADER > 0.99 | 75.0 | 53.3 | 59.5 (43.3–74.4)% | 1.6 | 39.1 |
| T1 SI ratio < 0.73 | 41.7 | 96.7 | 81.0 (65.9–91.4)% | 12.5 | 83.3 |
| ccLS = 5 | 25.0 | 100.0 | 78.6 (63.2–89.7)% | - | 100.0 |
| ccLS = 4/5 | 50.0 | 63.3 | 59.5 (43.3–74.4)% | 1.4 | 35.3 |
| CECT parameter | |||||
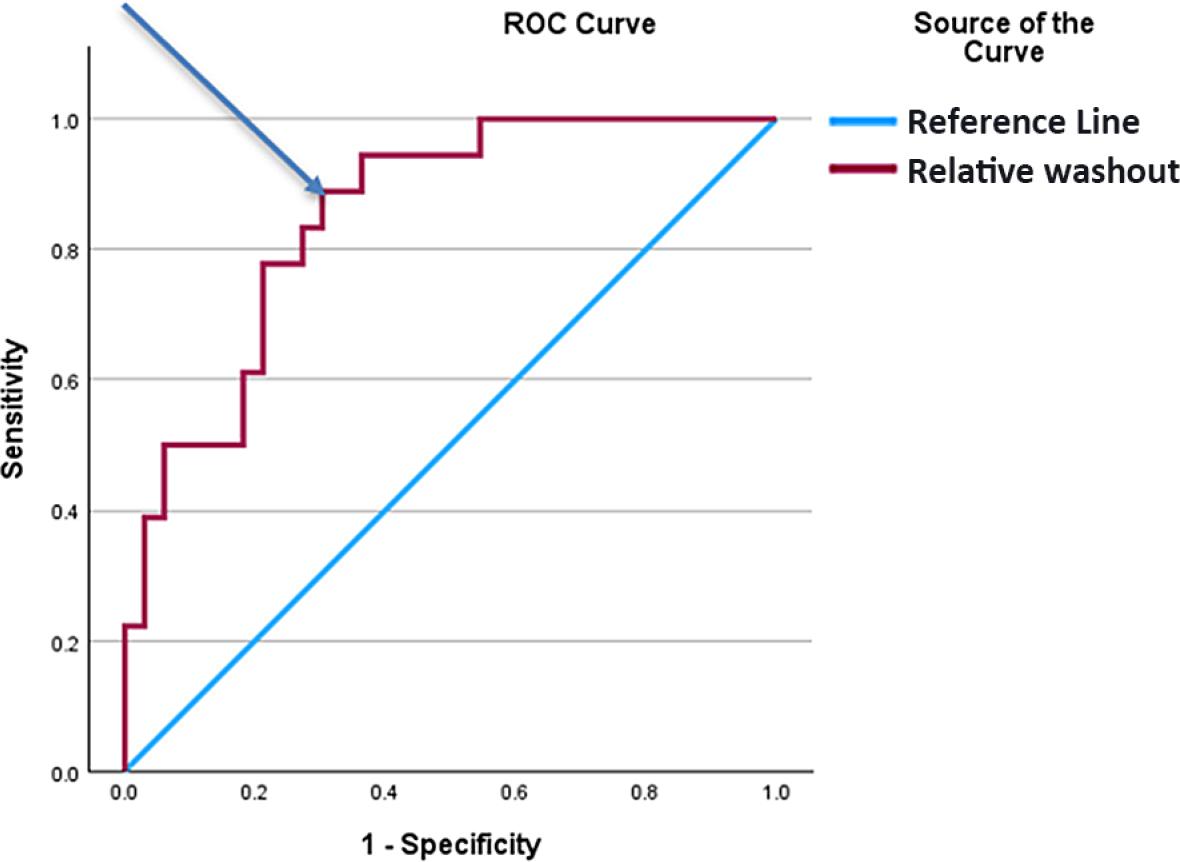
| Relative washout > 11.5 | 100.0 | 66.7 | 76.2 (60.6–88.0)% | 3.0 | 54.6 |
Difference in selected novel MRI and CECT parameters between ccRCC and non-ccRCC
| Imaging features | ccRCC group (n = 12) | non-ccRCC group (n = 30) | p-value |
|---|---|---|---|
| MRI parameters | |||
| Intense corticomedullary enhancement | 6 (50.0%) | 14 (46.7%) | 0.529 |
| ADER > 0.99 | 9 (75.0%) | 14 (46.7%) | 0.291 |
| T1 SI ratio <0.73 | 5 (41.7%) | 1 (3.3%) | 0.007 |
| ccLS = 5 | 3 (25.0%) | 0 (0.0%) | 0.024 |
| ccLS = 4/5 | 6 (50.0%) | 11 (36.7%) | 0.590 |
| CECT parameter | |||
| Relative washout > 11.5 | 12 (100.0%) | 10 (33.3%) | < 0.001 |
Area under the curve analyses according to selected CECT parameters in the prediction of ccRCC occurrence
| CECT features | AUC | p-value |
|---|---|---|
| Enhancement in corticomedullary phase | 0.752 | 0.003 |
| Difference in enhancement between corticomedullary and native phase | 0.751 | 0.003 |
| Difference in enhancement between corticomedullary and nephrographic phase | 0.828 | < 0.001 |
| Absolute washout - (difference in enhancement between corticomedullary and nephrographic phase/difference in enhancement between corticomedullary and native phase)*100 | 0.842 | < 0.001 |
| Relative washout - (difference in enhancement between corticomedullary and nephrographic phase/enhancement in corticomedullary phase)*100 | 0.850 | < 0.001 |
| Difference in enhancement between nephrographic and native phase | 0.552 | 0.541 |
| Enhancement in nephrographic phase | 0.535 | 0.679 |
Clinical features and CECT parameters in the prediction of ccRCC occurrence in univariate and multivariate logistic regression analysis
| Tested features | Univariate OR (CI: 95%), p-value | Multivariate OR (CI: 95%), p-value |
|---|---|---|
| Clinical parameter | ||
| Smoking | 4.19 (1.24–14.17), p = 0.02 | 7.50 (1.13–49.88), p = 0.04 |
| Hypertension | 2.92 (0.79–10.76), p = 0.11 | - |
| CECT parameter | ||
| Heterogeneous mass | 5.2 (1.02–26.47), p = 0.05 | - |
| Heterogeneous enhancement | 4.71 (1.14–19.34), p = 0.03 | 4.51 (0.47–43.59), p = 0.19 |
| Washout pattern (at least 20 HU between corticomedullary and nephrographic phases) | 10.0 (2.38–42.01), p = 0.002 | 0.13 (0.01–3.28), p = 0.22 |
| Relative washout - (difference in enhancement between corticomedullary and nephrographic phase/enhancement in corticomedullary phase)*100 | 1.08 (1.03–1.14), p = 0.001 | 1.19 (1.01–1.41), p = 0.04 |
| Enhancement in corticomedullary phase | 1.02 (1.00–1.03), p = 0.014 | 1.03 (0.95–1.12), p = 0.46 |
| Difference in enhancement between corticomedullary and native phase | 1.02 (1.00–1.03), p = 0.019 | 0.98 (0.91–1.06), p = 0.62 |
| Difference in enhancement between nephrographic and corticomedullary phase | 0.95 (0.92–0.98), p = 0.002 | 1.05 (0.95–1.16), p = 0.35 |