
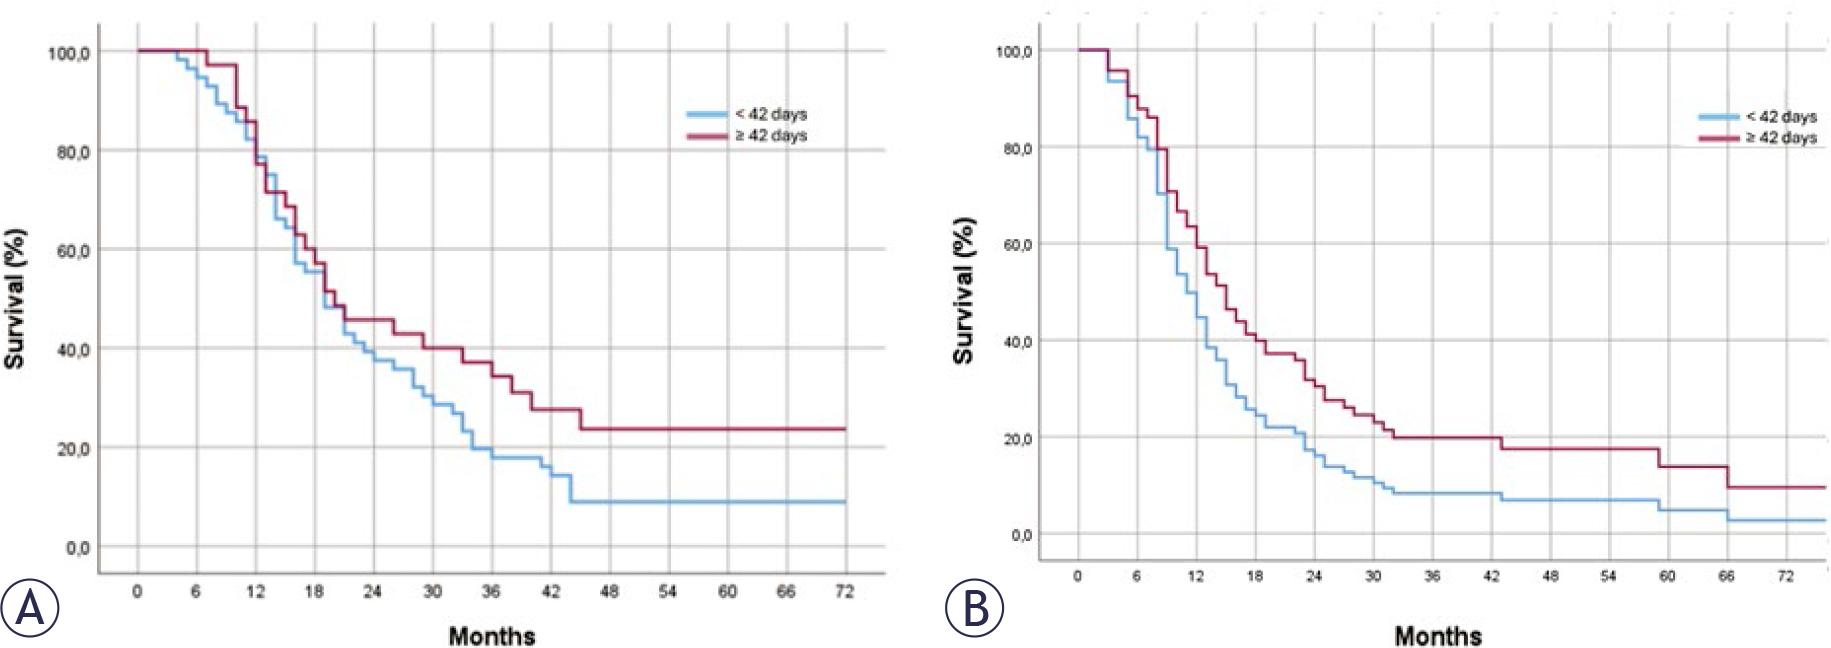
FIGURE 1.
Univariate and multivariate Cox regression analysis for progression free survival
| Univariate Analyse | Multivariate Analyse | |||
|---|---|---|---|---|
| HR (95% CI) | p value | HR (95% CI) | p value | |
| Age | ||||
| ≤ 55 | REF 0.700 (0.445–1.101) | 0.122 | REF 0.701 (0.437–1.125) | 0.141 |
| > 55 | ||||
| Gender | ||||
| Male | REF 0.915 (0.638–1.611) | 0.915 | REF 0.952 (0.591–1.534) | 0.839 |
| Female | ||||
| ECOG Score | ||||
| 0 | REF 1. 805 (1.026–2.846) | 0.023 | REF 1.765 (1.032–3.019) | 0.038 |
| 1 | ||||
| Extent of Surgery | ||||
| GTR | REF 2.017 (1.219–3.337) | 0.007 | REF 1.793 (1.063–3.025) | 0.029 |
| STR | ||||
| Surgery to CRT | ||||
| < 42 days | REF 0.652 (0.406–1.046) | 0.076 | REF 0.643 (0.398–1.039) | 0.071 |
| ≥ 42 days | ||||
Literature review of clinical impact of radiation delay following surgical resection
| Study | Year | Patients | Cutoff points | TMZ | Median survival | Results |
|---|---|---|---|---|---|---|
| Irwin et al.10 | 2007 | 172 | 2 wks | - | 7.8 mos in GB 14.9 mos for astrocytoma | Increased risk of death by 8.9% for each additional week |
| Noel et al.18 | 2012 | 400 | 6 wks | 67% | 13.4 mos | No differences in OS |
| Loureiro et al.19 | 2015 | 115 | 6 wks | 60% | 13.5 vs. 14.2 mos | No differences in OS |
| Sun et al.16 | 2015 | 218 | 6 wks | + | 15.2 vs. 12.9 mos | Worse OS in > 6 wks |
| Wang et al.20 | 2016 | 447 | 3 wks | 92% | 12.3 vs. 15.3 mos | Worse OS in < 3 wks |
| Nathan et al.12 | 2017 | 2535 | 4–6 wks | + | 21.3 vs. 26.6 vs. 27.6 mos | < 4 is associated with a 31% increased risk of death, no difference between > 4 vs. > 6 |
| Blumenthal et al.2 | 2018 | 1395 | 4 wks | + | 16 vs. 15.9 mos | No differences in OS and PFS |
| Katsigiannis et al.21 | 2019 | 151 | 28–33 days | + | 15 vs. 17.4 vs. 18.2 mos | No difference in OS and PFS among 3 group, but worse OS with > 48 days |
| Buszek et al.4 | 2020 | 45,942 | 4–8 wks | 67% | 13.9 vs. 15.2 vs. 14.6 mos | 4–8 wks has better OS, In GTR, > 8 wks has worse OS, In STR < 4 wks has worse OS |
| Ahn et al.22 | 2020 | 138 | 4 wks | + | 15.5 vs. 14.5 mos | No differences in OS and PFS, In STR > 4 week has worse OS |
| Press et al.17 | 2020 | 30,414 | 0-8 wks | N.A. | 12.8 to 16.2 mos | Worse OS in < 3 weeks No difference beyond 5 wks |
| Zhang et al.15 | 2020 | 66 | 6 wks | + | 26.6 vs. 15.7 mos | Worse OS and PFS > 6 wks |
| Current study | 2025 | 91 | 6 wks | + | 18 vs. 19 mos | No differences in OS and PFS |
Univariate and multivariate Cox regression analysis for overall survival
| Univariate analyse | Multivariate analyse | |||
|---|---|---|---|---|
| HR (95% CI) | p value | HR (95% CI) | p value | |
| Age | ||||
| ≤ 55 | REF 1.284 (0.812–2.031) | 0.284 | REF 1.535 (0.957–2.462) | 0.076 |
| > 55 | ||||
| Gender | ||||
| Male | REF 0.874 (0.555–1.375 | 0.560 | REF 0.819 (0.498–1.345 | 0.430 |
| Female | ||||
| ECOG score | ||||
| 0 | REF 1.783 (1.103–2.881 | 0.018 | REF 1.791 (1.056–3.037) | 0.031 |
| 1 | ||||
| Extent of Surgery | ||||
| GTR | REF 2.304 (1.422–3.733) | < 0.001 | REF 2.921 (1.702–5.014) | < 0.001 |
| STR | ||||
| Surgery to CRT | ||||
| < 42 days | REF 0.714 (0.446–1.143) | 0.161 | REF 0.610 (0.368–1.013) | 0.060 |
| ≥ 42 days | ||||
Patient characteristics
| All patients (n = 91) | < 42 days (n = 56) | ≥ 42 days (n = 35) | ||
|---|---|---|---|---|
| Surgery to CRT, median (range), days | 39 (18–98) days | 34 (18–41) days | 48 (42–98) days | |
| Age, median (range), years | 58 (22–79) | 59 (22–77) | 58 (27–79) | p = 0.798 |
| Gender | ||||
| Male | 54 (59.3%) | 31 (55.4%) | 23 (65.7%) | p = 0.328 |
| Female | 37 (40.7%) | 25 (44.6%) | 12 (34.3%) | |
| ECOG Score | ||||
| 0 | 63 (69.2%) | 36 (64.3%) | 27 (77.1%) | p = 0.246 |
| 1 | 28 (31.8%) | 20 (35.7%) | 8 (12.9%) | |
| Extent of Surgery | ||||
| GTR | 64 (70.3%) | 40 (71.4%) | 24 (68.5%) | p = 0.816 |
| STR | 27 (29.7%) | 16 (28.6%) | 11 (31.5%) | |
| Adjuvant temozolomide cycles, median | 7 (2–18) cycles | 7 (2–18) cycles | 7 (3–15) cycles | p = 0.385 |
| PTV volumes, mean | 186.7 cm3 | 187.8 cm3 | 185.2 cm3 | p = 0.888 |