
TABLE 1.
Pulse parameters for different gene electrotransfer (GET) protocols for in vitro cell transfection
| Experimental groups (protocol name) | Voltage (V) | Pulse duration (μs) | No. of pulses | Pulse direction | Frequency (Hz) |
|---|---|---|---|---|---|
| GET1 | 250 | 100 | 8 | unipolar | 1 |
| GET2 | 300 | 100 | 8 | unipolar | 1 |
| GET3 | 300 | 100 | 3 | bipolar | 1 |
| GET4 | 300 | 100 | 8 | unipolar | 5000 |
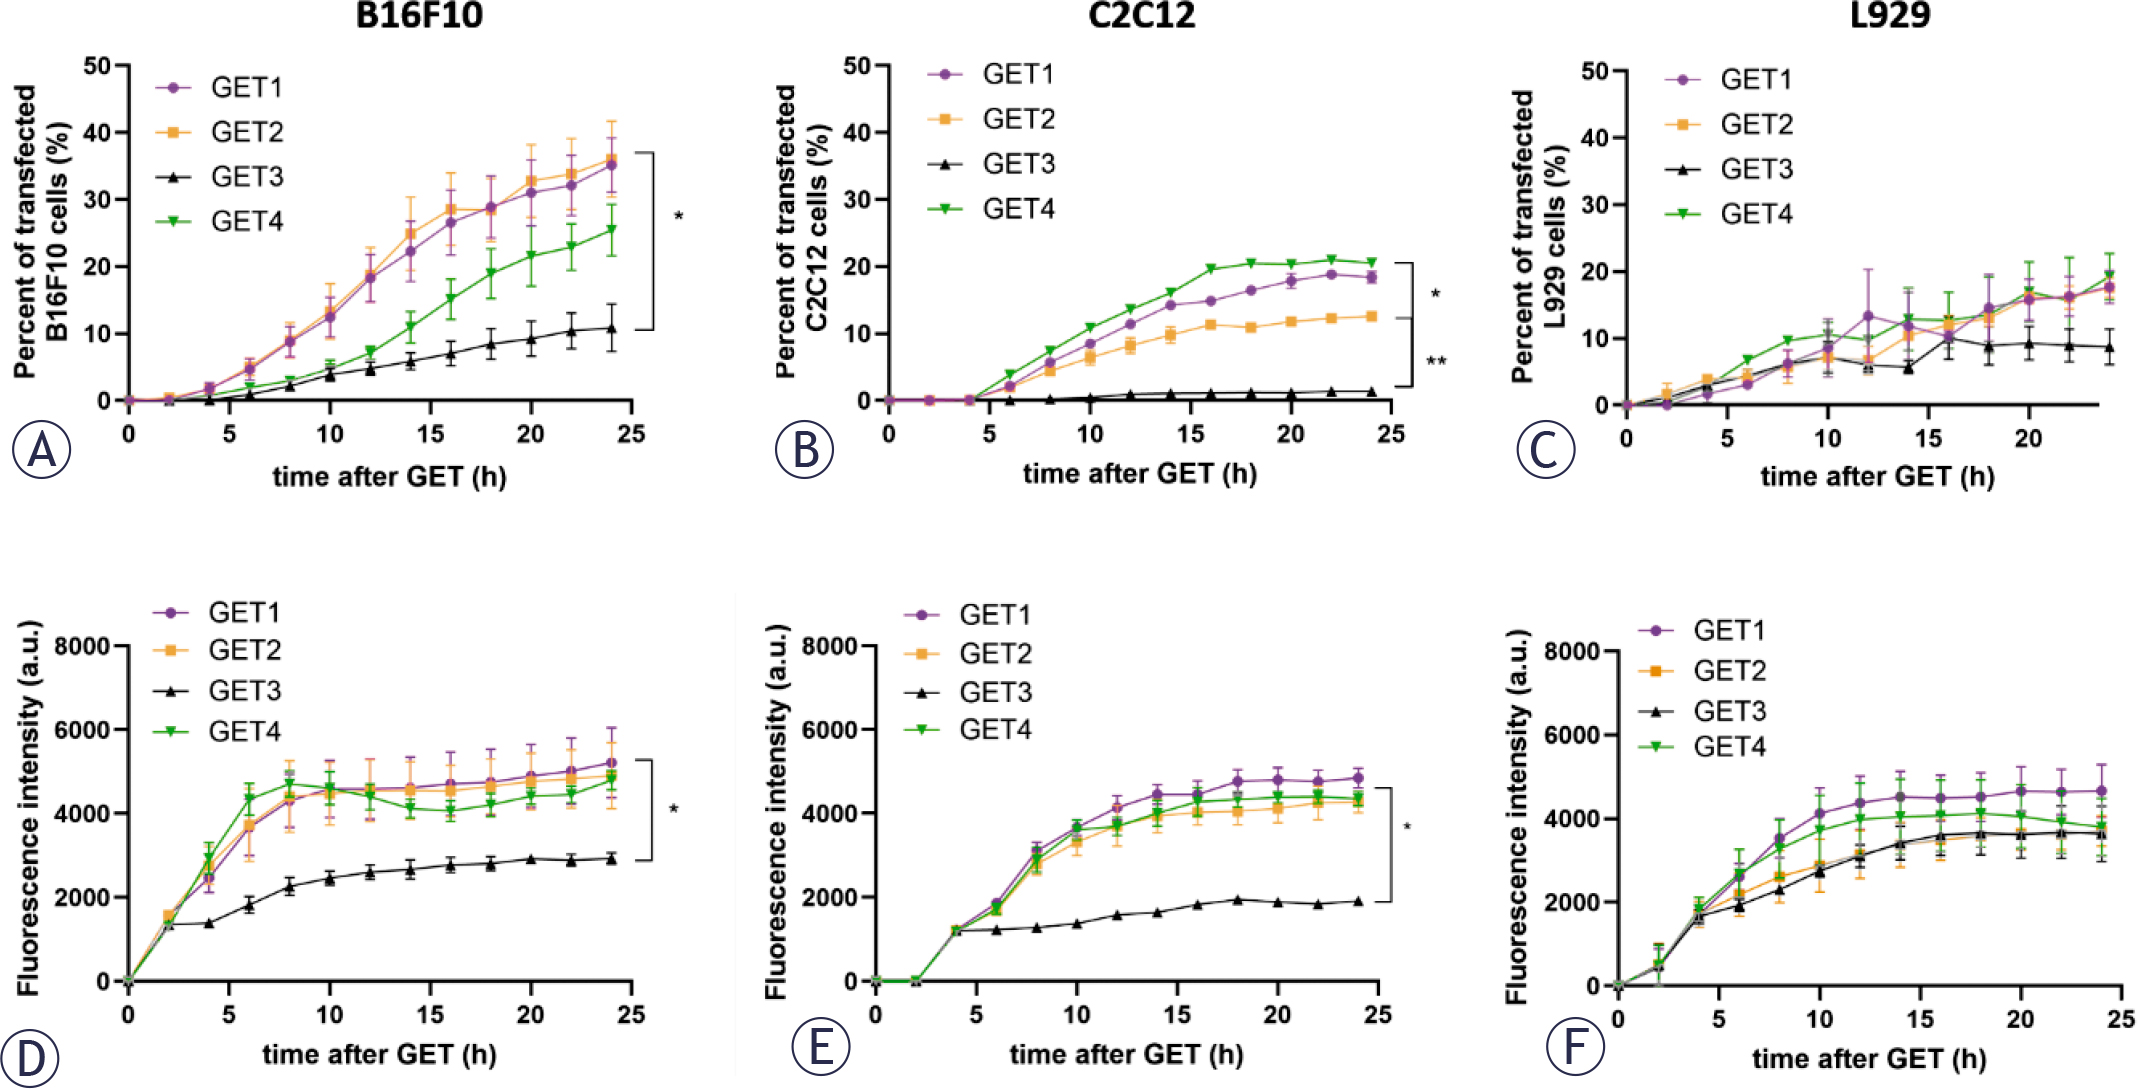
FIGURE 1.
The transfection efficiency timeline of different cell lines according to the gene electrotransfer (GET) protocol. Percent of transfected B16F10 (A), C2C12 (B) and L929 (C) cells and fluorescence intensity of B16F10 (D), C2C12 (E) and L929 (F) cells.
*p < 0.05, statistically significant difference in GET1/GET2 compared with GET4 (A); *p < 0.05, statistically significant difference in GET1/GET4 compared with GET3 and GET2 (B); **p < 0.05, statistically significant difference in GET2 compared with GET3 (B); *p < 0.05, statistically significant difference in GET1/GET2/GET4 compared with GET4 (D and E)
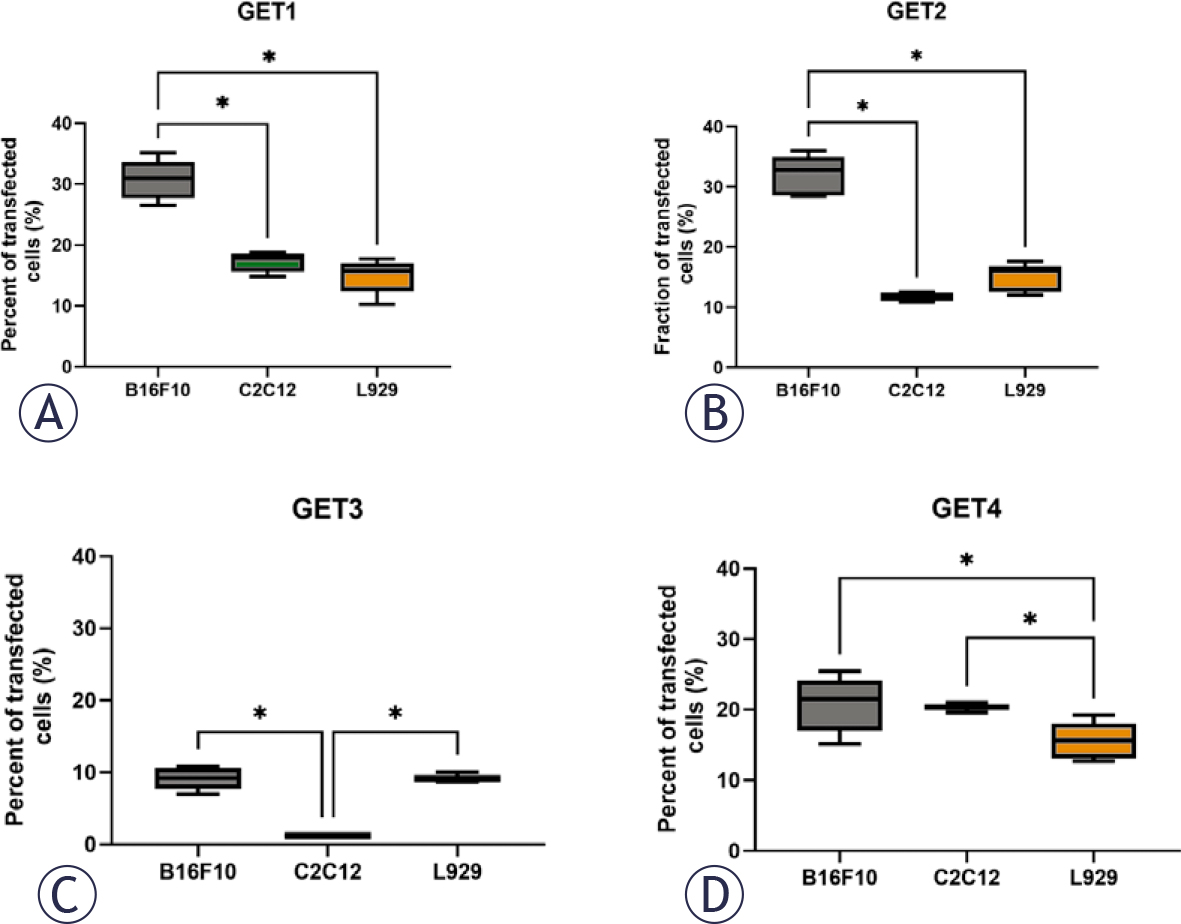
FIGURE 2.
Transfection efficiency of different pulse parameter protocols in three different cell lines. Percent of transfected tumor (B16F10) and normal (C2C12, L929) cells after GET1 (A), GET2 (B), GET3 (C) and GET4 (D) treatment.
*p < 0.05 indicates a statistically significant difference; GET = gene electrotransfer
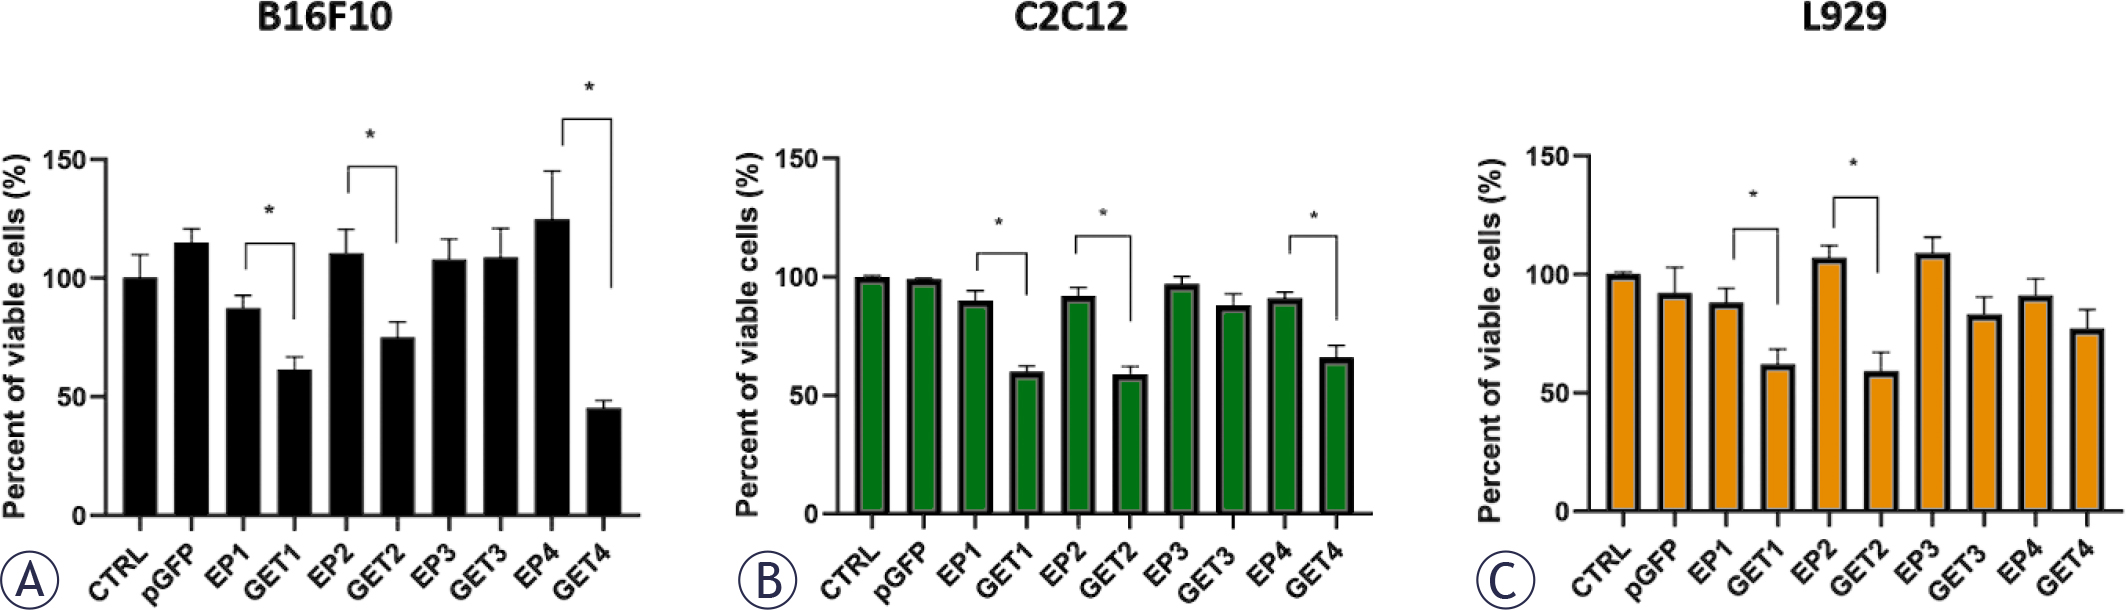
FIGURE 3.
Cell survival after different pulse parameters and gene electrotransfer (GET) in B16F10 (A), C2C12 (B) and L929 (C) cells.
* = p < 0.05 indicates a statistically significant difference; EP = electroporation only; pGFP = plasmid only, which encodes the green fluorescent protein
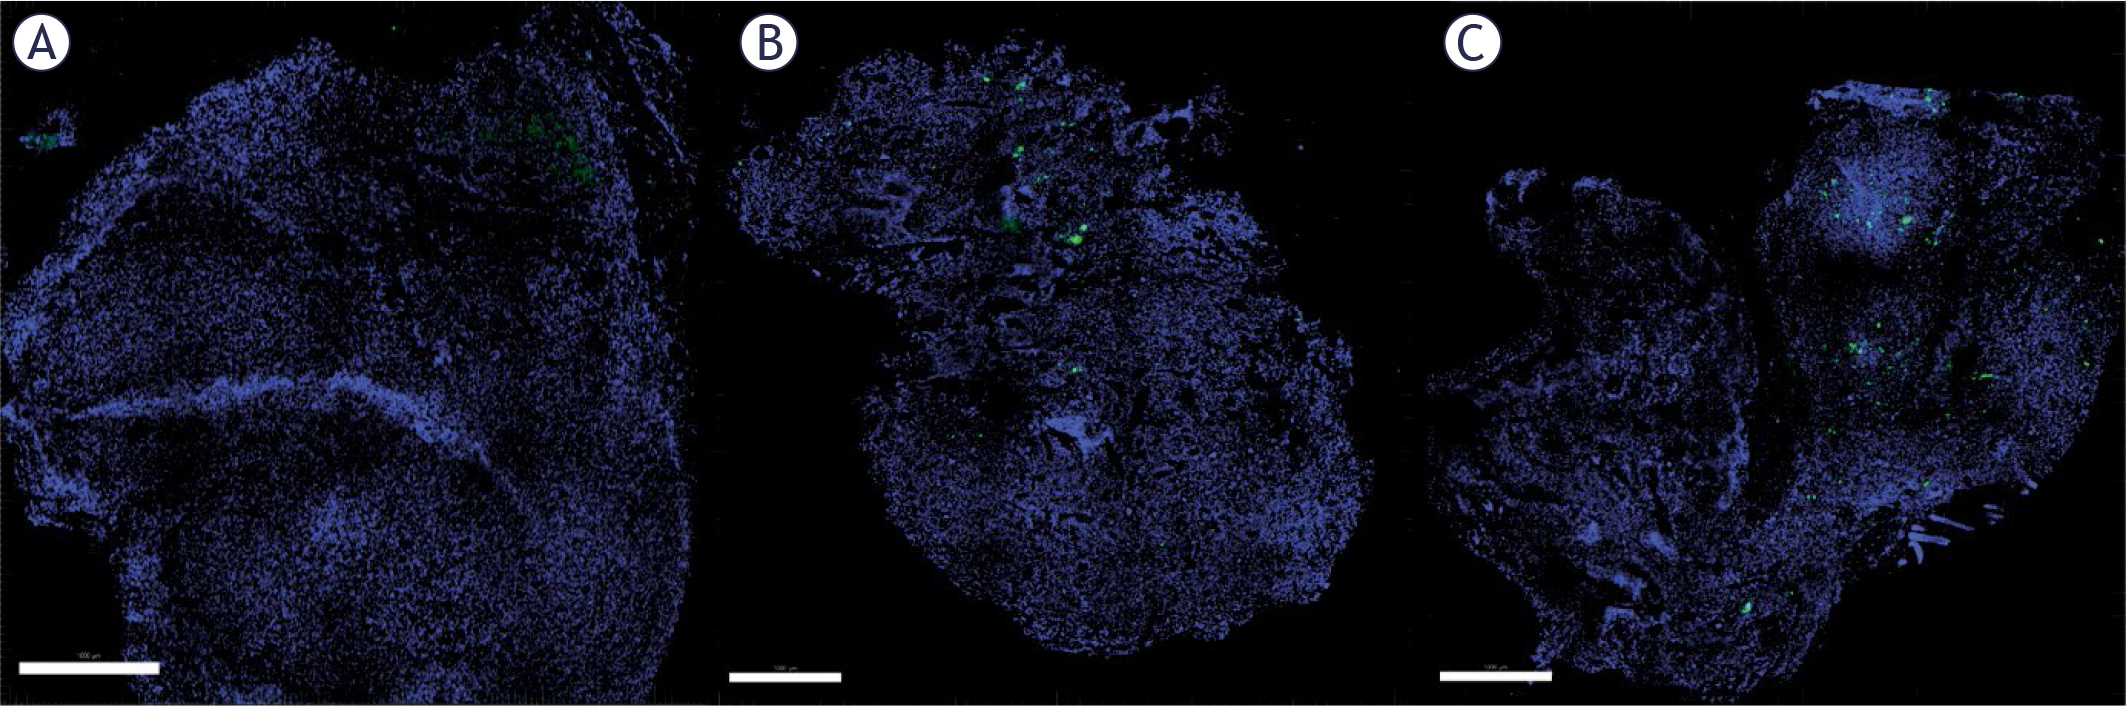
FIGURE 4.
Transfection of B16F10 tumors. Untreated control tumors (A), GET2 (B) and GET4 (C) tumors. Nuclei are stained blue with Hoechst. The transfected cells are presented in green, indicating transfection with the GFP plasmid.
Scale bar = 1000 μm
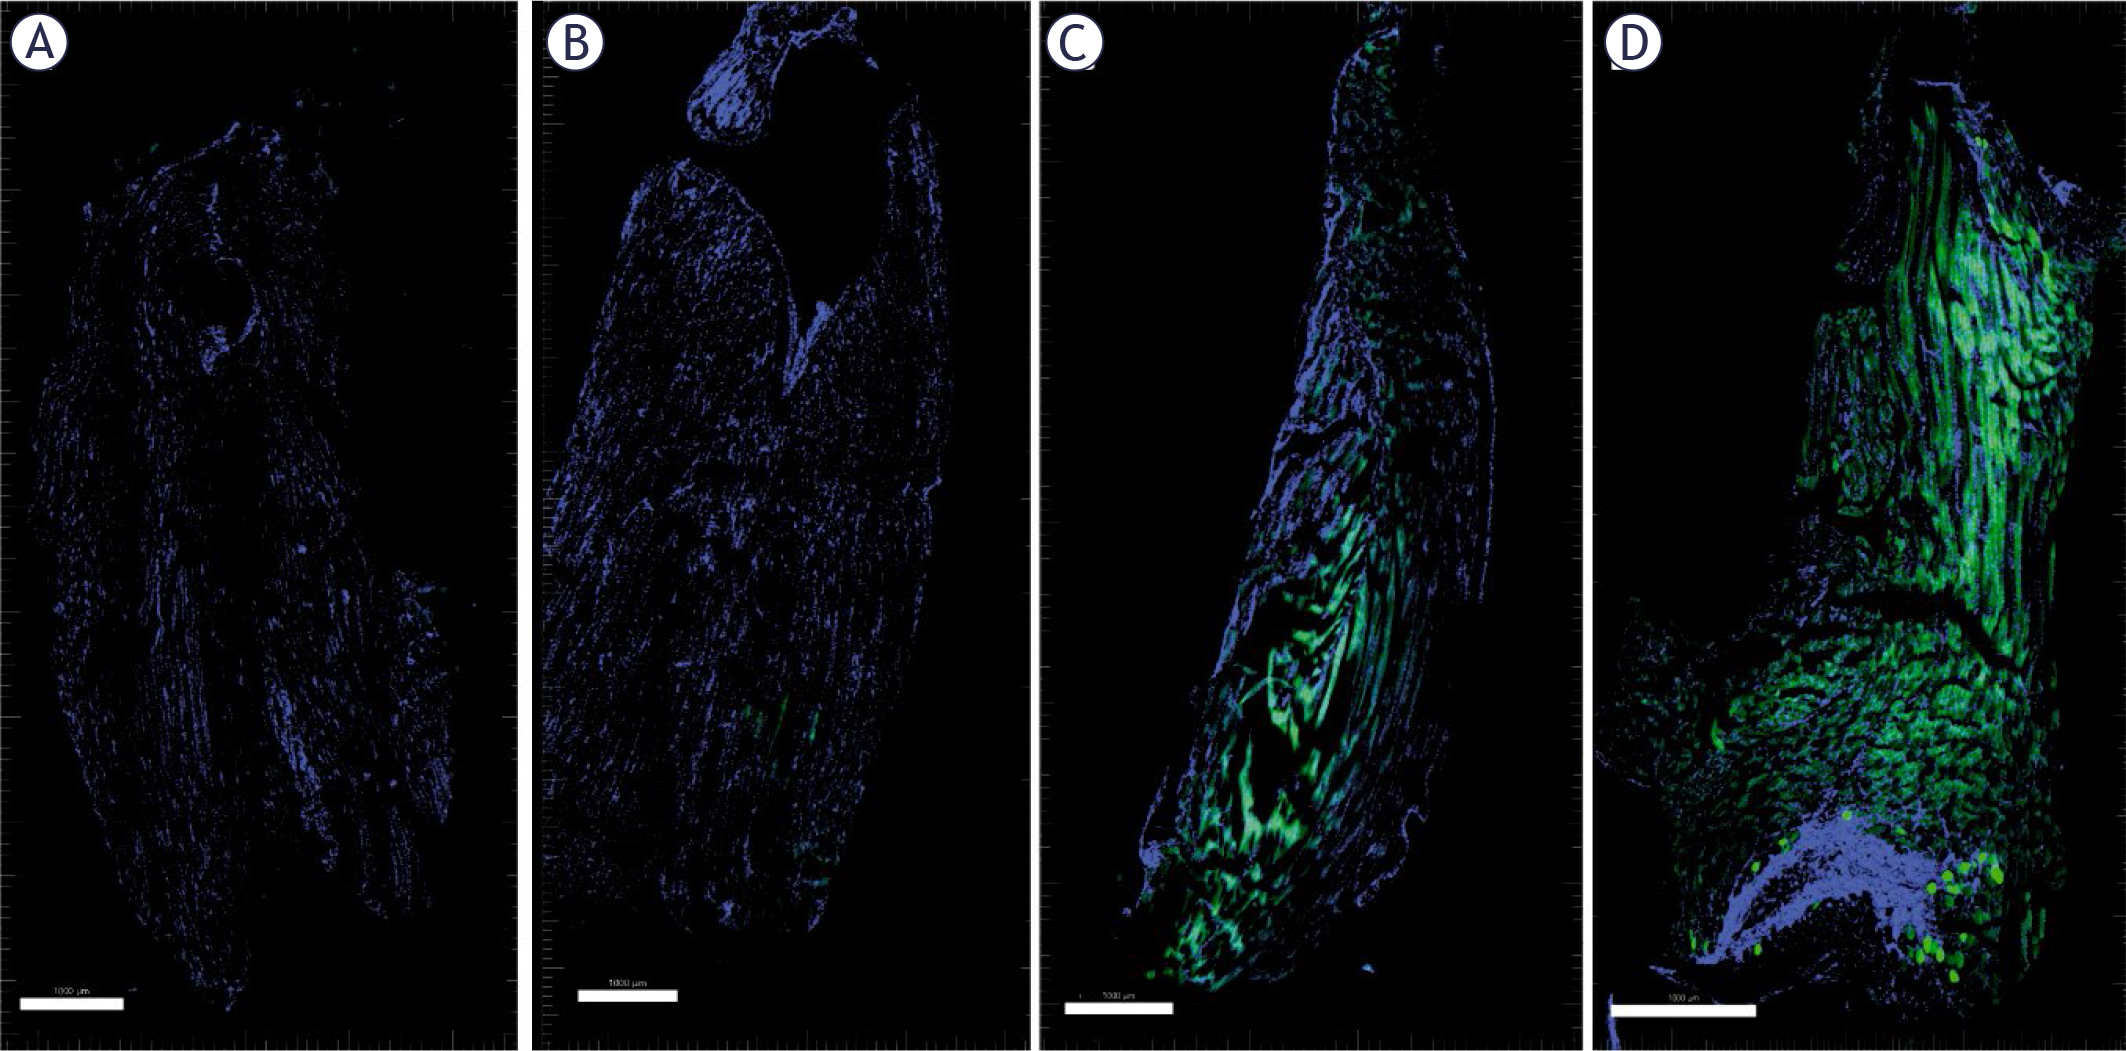
FIGURE 5.
Transfection of muscle. Control (A), GET2 (B), GET4 (C) and 1HV-4LV (D). The nuclei are stained blue with Hoechst. The transfected cells are presented in green, indicating transfection with the GFP plasmid.
Scale bar = 1000 μm.