
Figure 1.
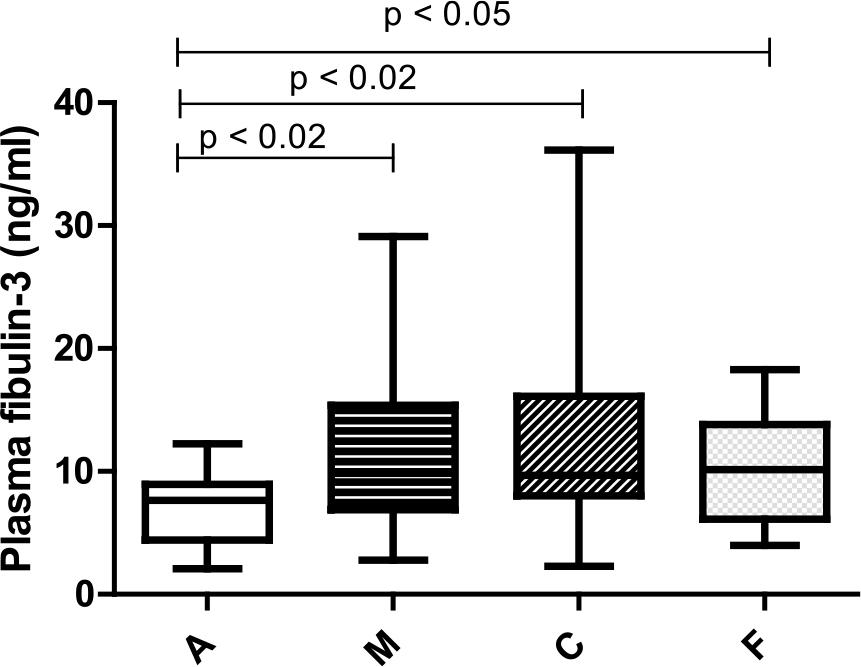
Figure 2.

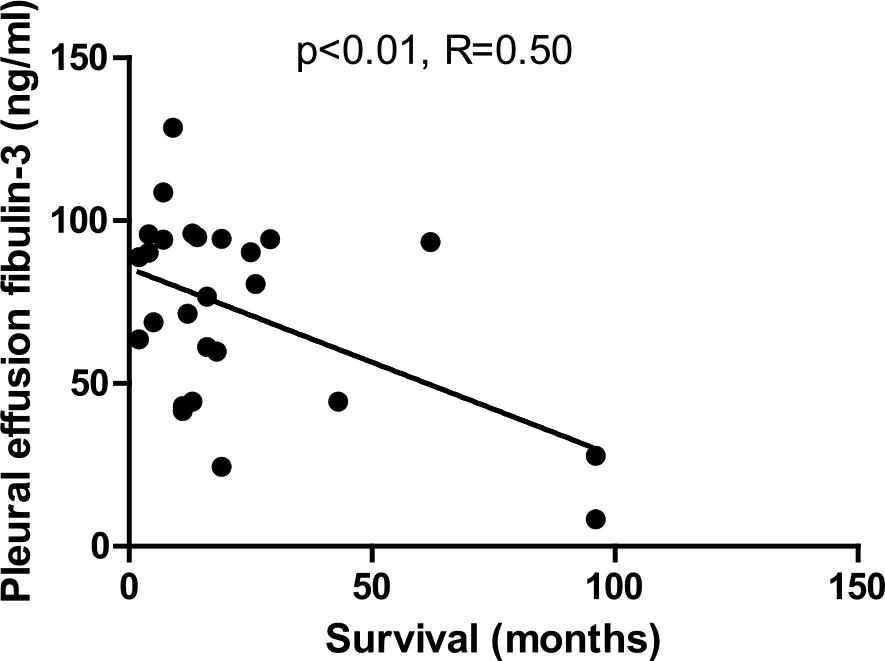
Figure 3.
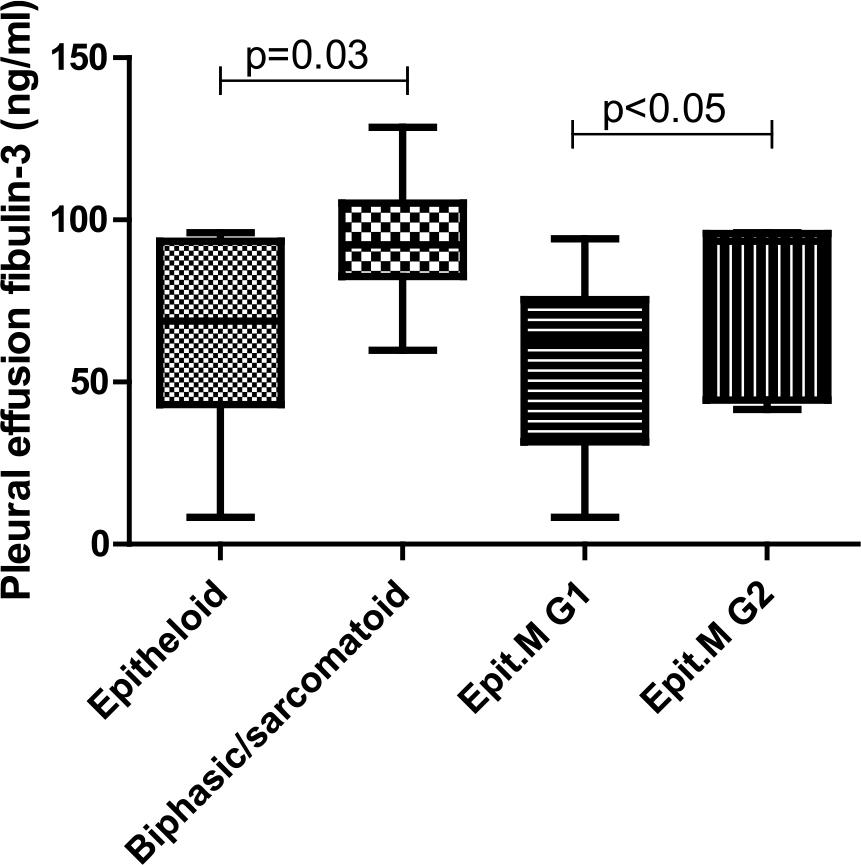
Figure 4.
Characteristics of patients
| A (n = 13) | M (n = 32) | C (n = 24) | F (n = 21) | |
|---|---|---|---|---|
| Age (mean, SE) | 68.1 (2.4) | 63.7 (1.9) | 63.1 (1.9) | 63.8 (3.0) |
| Male gender – n (%) | 12 (92.3) | 24 (75.0) | 14 (58.3) | 20 (95.2) |
| Smoking status – n (%) | ||||
| Active smoker | 1 (7.6) | 7 (21.9) | 2 (8.3) | 3 (14.3) |
| Former smoker | 5 (38.5) | 6 (18.8) | 11 (45.8) | 11 (52.4) |
| Non-smoker | 7 (53.8) | 17 (53.1) | 8 (33.3) | 4 (19.0) |
| Asbestos exposure – n (%) | 13 (100.0) | 19 (59.4) | 2 (8.3) | 4 (19.0) |
Fibulin-3 values, presented with the median and interquartile range (IQR)
| A (n = 13) | M (n = 32) | C (n = 24) | F (n = 21) | |
|---|---|---|---|---|
| Fibulin-3 value (ng/mL) | ||||
| Plasma | 7.66 (4.43–8.96) | 9.91 (6.08–15.83) | 9.21 (7.97–15.93) | 10.15 (6.125–13.83) |
| Pleural effusion | 83.67 (15.71–87.21) | 78.61 (44.4–94.37) | 81.25 (35.86–95.45) | 79.64 (41.43–86.99) |
Fibulin-3 levels by mesothelioma type, shown with median and interquartile range
| Epitheloid type | Biphasic and sarcomatoid type | |
|---|---|---|
| Fibulin-3 value (ng/mL) | ||
| Plasma | 9.96 (7.66-16.65) | 8.62 (5.91–13.26) |
| Pleural effusion | 66.15 (42.72-93.64) | 92.3 (82.6–105.2) |