
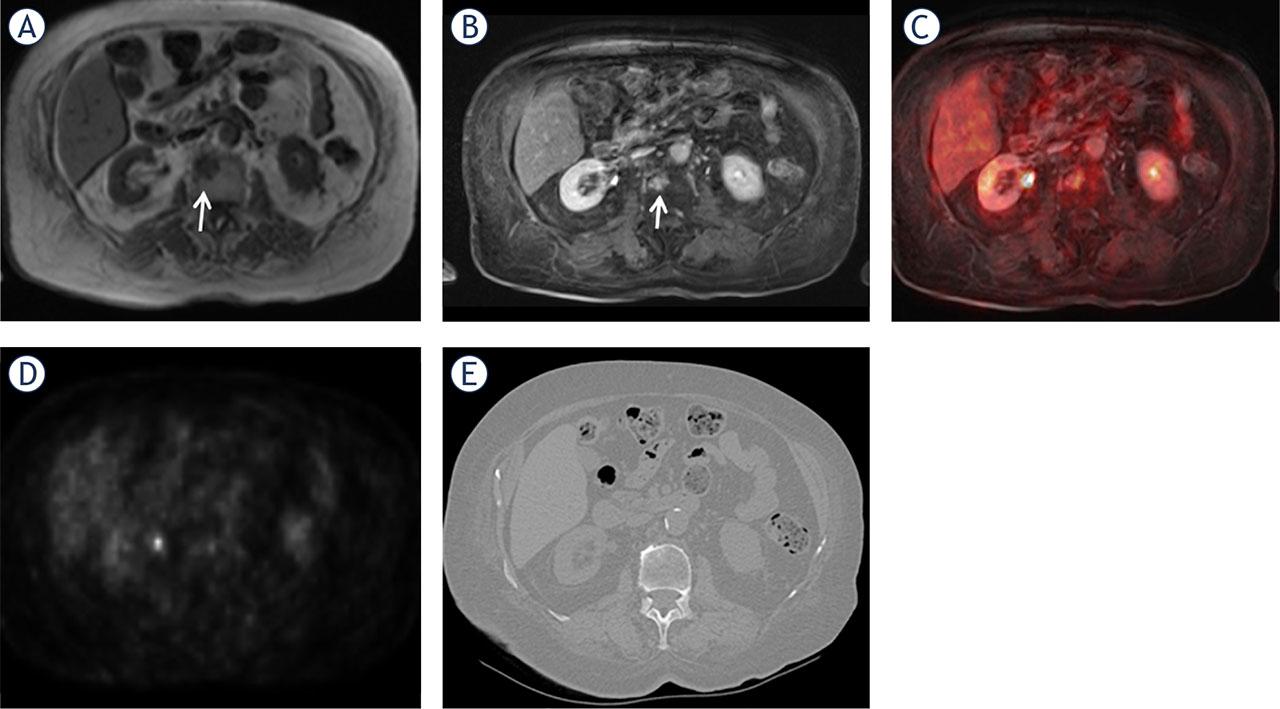
FIGURE 1.
Diagnostic performance of sequences
| Sequences | Sensitivity (%) | Specificity (%) | 95%CI | AUC | P | PPV (%) | NPV (%) |
|---|---|---|---|---|---|---|---|
| Precontrast T1W | 78 | 50 | 63.2–78.3 | 0.587 ± 0.064 | 0.191 | 75 | 54 |
| CE T1W VIBE | 82 | 58 | 67.3–88.9 | 0.751 ± 0.065 | 0.024 | 79 | 63 |
| AC PET | 80 | 54 | 67.9–79.4 | 0.667 ± 0.065 | 0.013 | 78 | 58 |
| T1W-PET | 84 | 61.5 | 72.2–91.9 | 0.796 ± 0.063 | 0.003 | 81 | 67 |
| CE T1W-PET | 100 | 92 | 74.0–99.8 | 0.952 ± 0.067 | 0.001 | 96 | 100 |
Inter-observer variability for the detection of bone metastases on all sequences
| Sequences | kappa | 95 %CI |
|---|---|---|
| Precontrast T1W | 0.86 | 0.69–0.92 |
| CE T1W VIBE | 0.87 | 0.77–0.94 |
| AC PET | 0.83 | 0.76–0.90 |
| T1W-PET | 0.86 | 0.78–0.91 |
| CE T1W-PET | 0.88 | 0.82–0.94 |
Tumor histopathologic features
| Primary malignant tumors | n |
|---|---|
| Hepatobiliary | 12 |
| Gastrointestinal | 7 |
| Genitourinary | 8 |
| Breast | 23 |
| Lung | 26 |