
TABLE 1.
Patient and lesion characteristics
| min | max | mean ± SD | median | |
|---|---|---|---|---|
| Age (years) | 35 | 91 | 69.0 ± 7.9 | 70.0 |
| *Total PSA concentration (ng/mL) | 0.45 | 115.4 | 9.7 ± 11.7 | 7.0 |
| Prostate volume (ml) | 15 | 313 | 52.8 ± 32.3 | 45 |
| No. lesions biopsied in a patient | 1 | 3 | 1.4 ± 0.6 | 1.0 |
| Largest diameter of lesion (mm) | 3.0 | 41.0 | 12.8 ± 6.6 | 11.5 |
| No. of cores per lesion targeted BX | 1 | 8 | 4.26 ± 1.2 | 4.0 |
| No. of cores systematic BX | 0 | 14 | 6.9 ± 1.8 | 6.0 |
| No. of MRI-TRUS fusion targeted BX performed by urologist before | 1 | 65 | 22.5 ± 19.7 | 20.0 |
TABLE 2.
Comparison of time-based patient groups for learning curve estimation on institution level
| Targeted BX | Systematic BX | Overall BX | |||||||
|---|---|---|---|---|---|---|---|---|---|
| Pearson χ2 | df | sig | Pearson χ2 | df | sig | Pearson χ2 | df | sig | |
| 2 patient groups | 0.458 | 1 | 0.498 | 0.658 | 1 | 0.417 | 0.291 | 1 | 0.590 |
| 3 patient groups | 2.145 | 2 | 0.342 | 2.265 | 2 | 0.322 | 1.373 | 2 | 0.503 |
| 6 patient groups | 4.807 | 5 | 0.440 | 2.872 | 5 | 0.720 | 2.322 | 5 | 0.803 |
TABLE 3.
Proportion of positive targeted biopsy (BX) lesions categorised by Prostate Imaging-Reporting and Data System (PIRADS) score
| Negative BX | Positive BX | Total | |
|---|---|---|---|
| PIRADS 3 (%) | 104 (81.9%) | 23 (18.1%) | 127 |
| PIRADS 4 (%) | 108 (52.9%) | 96 (47.1%) | 204 |
| PIRADS 5 (%) | 13 (16.0%) | 68 (84.0%) | 81 |
TABLE 4.
Results of multiple logistic regression of positive histopathologic result
| Lower | Upper | |||
|---|---|---|---|---|
| Max lesion diameter | 0.945 | 0.998 | 0.955 | 1.044 |
| Prostate volume | < 0.001 | 0.978 | 0.968 | 0.988 |
| *Total PSA concentration | 0.050 | 1.050 | 1.000 | 1.103 |
| PIRADS 3 | < 0.001 | |||
| PIRADS 4 | < 0.001 | 3.208 | 1.848 | 5.567 |
| PIRADS 5 | < 0.001 | 16.222 | 6.475 | 40.645 |
| Number of cores per lesion | 0.034 | 1.238 | 1.016 | 1.508 |
| Number of previous patients with targeted BX performed by urologist | 0.113 | 1.013 | 0.997 | 1.028 |
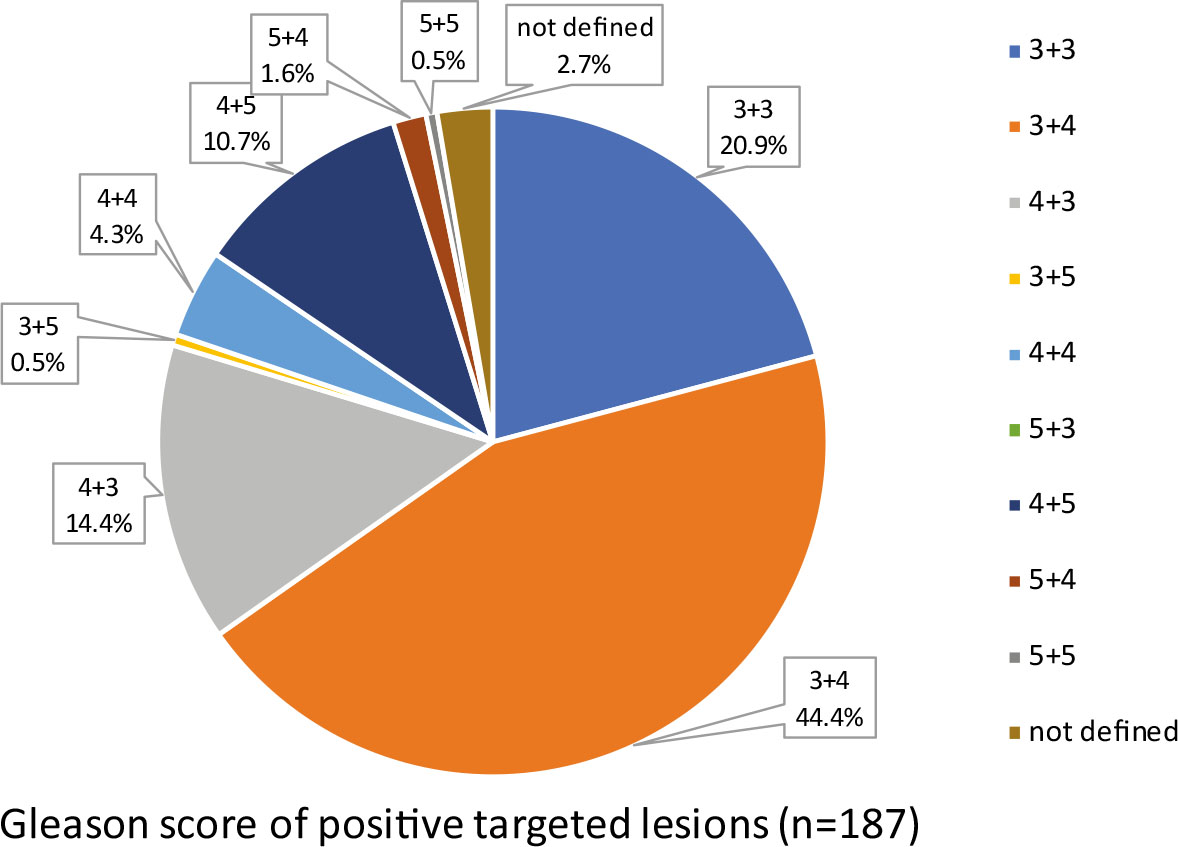
FIGURE 1.
Gleason score of all positive biopsy (BX) lesions. Category »not defined« includes lesions with suspect cores for carcinoma, undefined Gleason score in invasive carcinoma and atypical small acinar proliferation (ASAP).
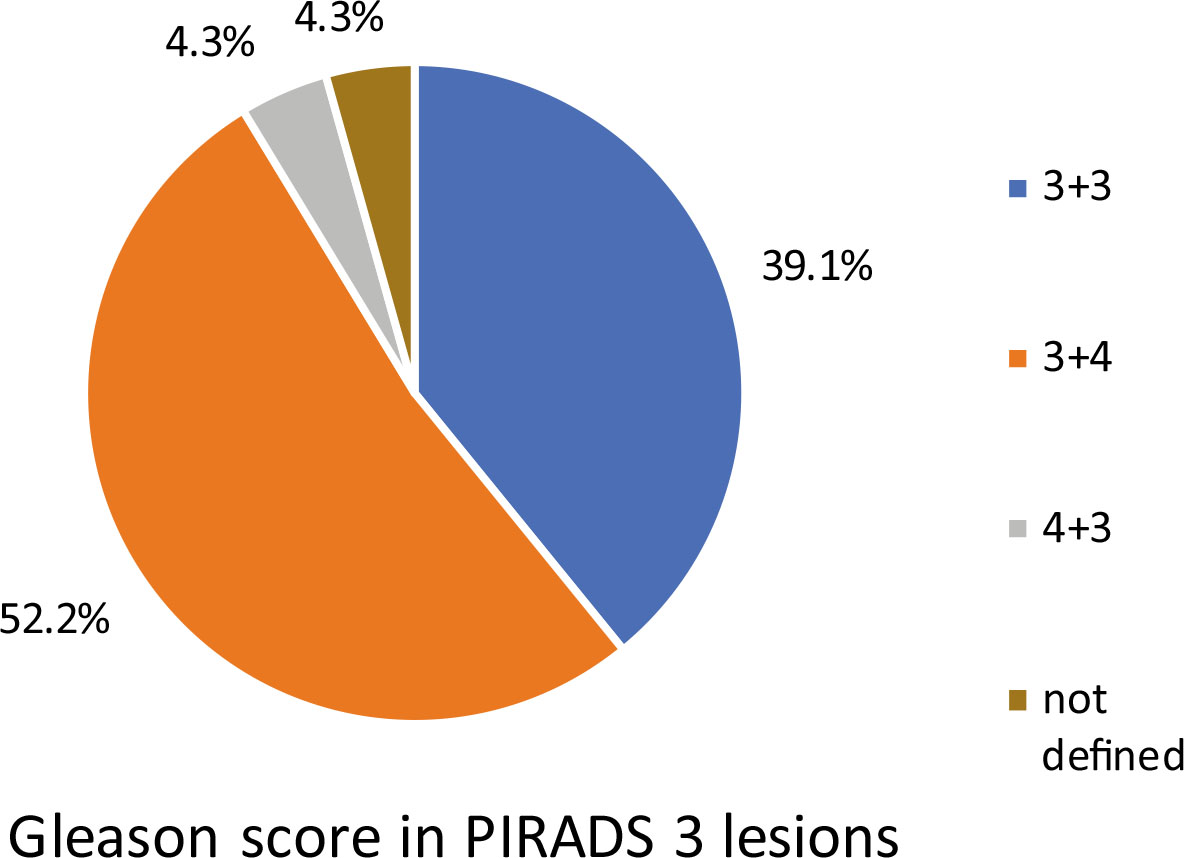
FIGURE 2.
Gleason score of Prostate Imaging-Reporting and Data System (PIRADS) 3 positive biopsy (BX) lesions.