FIGURE 1.
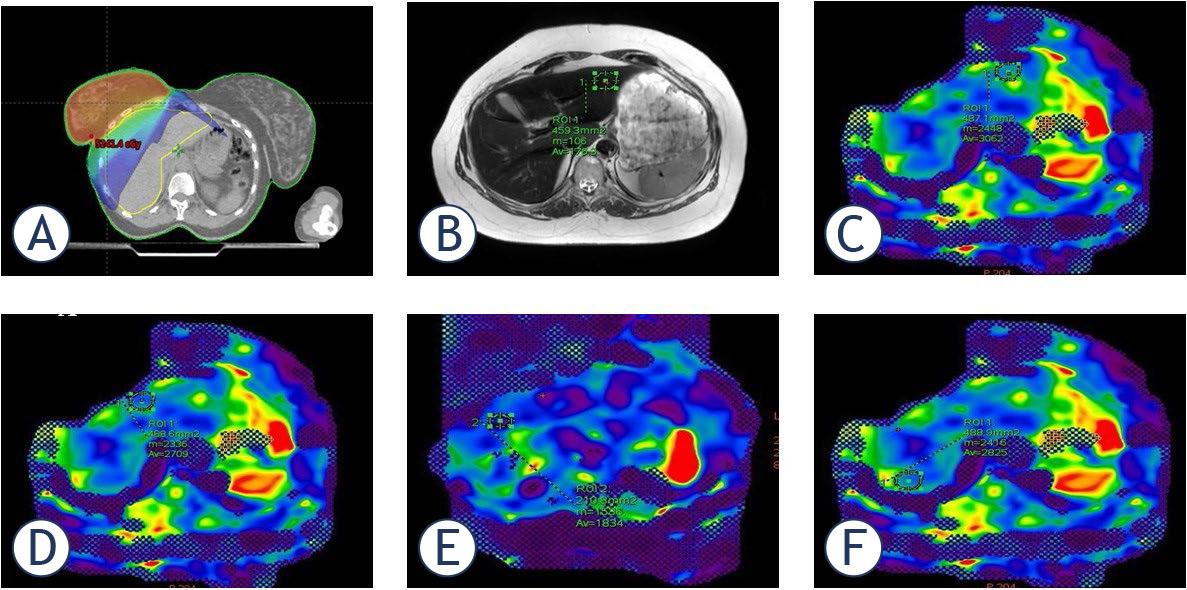
FIGURE 2.
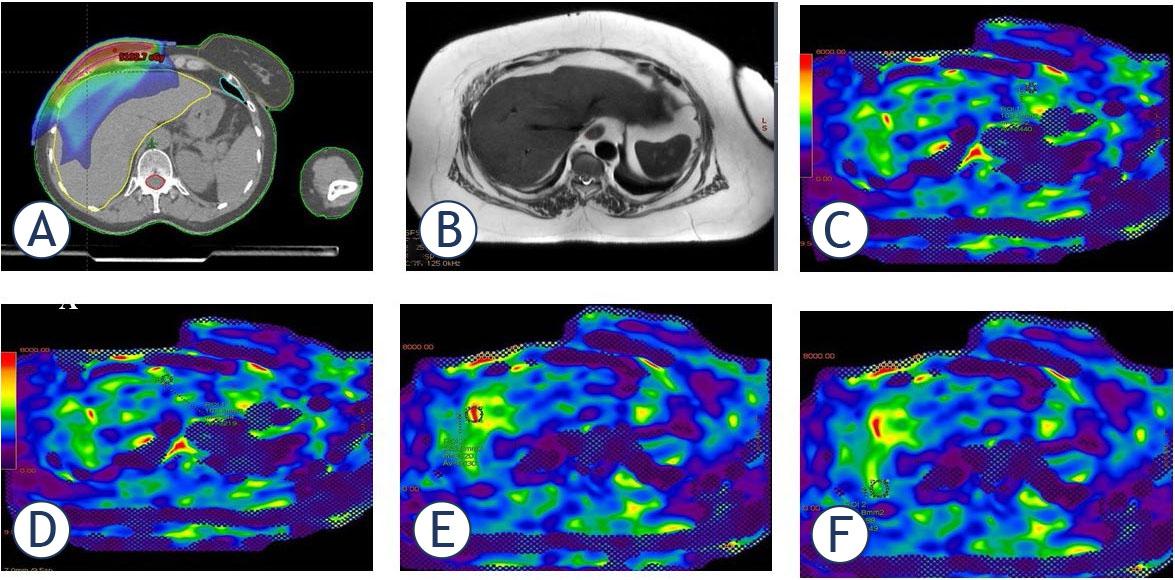
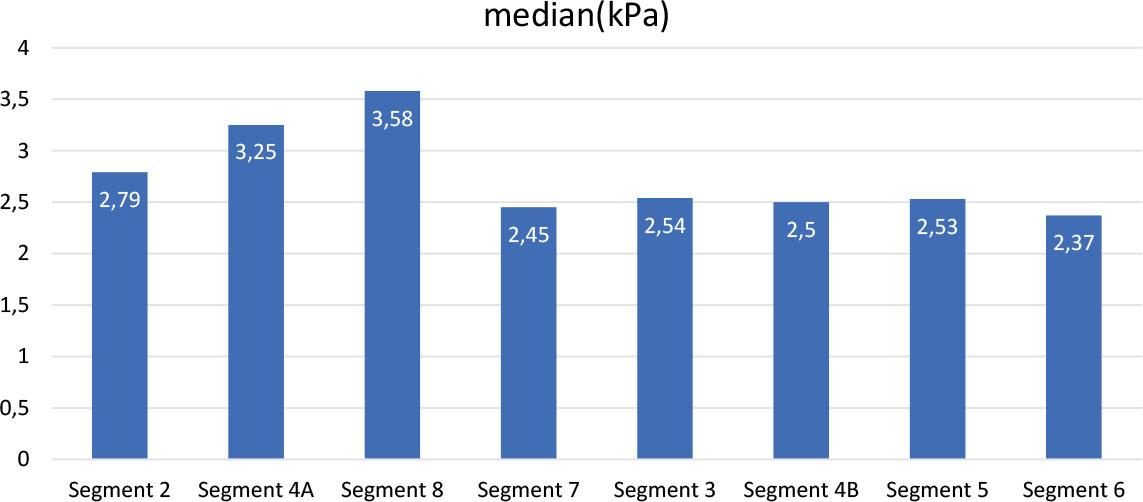
FIGURE 3.
Dosimetric date
| Characteristics | Value (range) |
|---|---|
| RT dose (Gy) | 60.0 (50–67) |
| PTV volume (cc) | 1063.35 (372.6–2389.6) |
| PTV max (cGy) | 6282.4 (5323.8–7050.9) |
| Liver volüme (cc) | 1436.1 (843.8–2298.1) |
| Liver V30Gy (%) | 1.7 (0–12.03) |
| Liver mean (cGy) | 759.6 (133.8–1699.8) |
Patients characteristics (N = 34)
| Characteristics | |
|---|---|
| Age, years | Mean ± SD (min-max) |
| 52.53± 9.38 (32–68) | |
| N(%) | |
| Smoking | |
| No | 10 (29.4) |
| Yes | 24 (70.6) |
| Alcohol | |
| No | 34 (100) |
| NAC | |
| Yes | 15(44.1) |
| No | 19(55.9) |
| Surgery | |
| BCS | 21(61.8) |
| MRM | 13(38.2) |
| Stage | |
| 1A | 10(29.4) |
| 2A | 14(41.2) |
| 2B | 3(8.8) |
| 3A | 7(20.6) |
| Histopathological | |
| IDC | 31(91.2) |
| ILC | 1(2.9) |
| IMC | 1(2.9) |
| ITC | 1(2.9) |
Relationship between kPa values and liver volume in liver segments
| Liver segments (kPA values) | Liver volüme (cc) | Liver V 30Gy | Liver mean (Gy) |
|---|---|---|---|
| Segment 2 | r = 0.109; p = 0.539 | r = 0.089; p = 0.616 | r = 0.171; p = 0.332 |
| Segment 4A | r = 0.239; p = 0.173* | r = 0.088; p = 0.619 | r = −0.014; p = 0.938* |
| Segment 8 | r = 0.107; p = 0.548* | r = −0.043; p = 0.809 | r = −0.144; p = 0.417* |
| Segment 7 | r = 0.266; p = 0.129 | r = −0.139; p = 0.432 | r = −0.115; p = 0.517 |
| Segment 3 | r = −0.068; p = 0.701* | r = −0.057; p = 0.749 | r = −0.188; p = 0.286* |
| Segment 4B | r = 0.284; p = 0.103* | r = 0.224; p = 0.203 | r = 0.186; p = 0.293* |
| Segment 5 | r = 0.355; p = 0.039 | r = −0.074; p = 0.679 | r = −0.074; p = 0.677 |
| Segment 6 | r = 0.062; p = 0.729* | r = 0.073; p = 0.683 | r = 0.017; p = 0.926* |
Relationship between after-RT segment values and liver RT dose and biochemical variables
| Segment 2 | Segment 4A | Segment 8 | Segment 7 | Segment 3 | Segment 4B | Segment 5 | Segment 6 | |
|---|---|---|---|---|---|---|---|---|
| Liver Volüm | r=0,109; p=0.539 | r=0.239; p=0.173* | r=0.107; p=0.548* | r=0.266; p=0.129 | r=−0.068; p=0.701* | r=0.284; p=0.103* | r=0.355; p=0.039 | r=0,062; p=0,729* |
| Lıver V 30Gy | r=0,089;p=0.616 | r=0,088; p=0,619 | r=−0,043; p=0,809 | r=−0,139; p=0,432 | r=−0,057; p=0,749 | r=0,224; p=0,203 | r=−0,074; p=0,679 | r=0,073; p=0,683 |
| ALP | r=0,102;p=0.565 | r=0,398; p=0,020 | r=0,175; p=0,323 | r=0,298; p=0,087 | r=0,149; p=0,401 | r=0,227; p=0,198 | r=0,002; p=0,993 | r=0,500; p=0,003 |
| ALT | r=0,145;p=0.413 | r=0,165; p=0,351 | r=0,246; p=0,16 | r=0,259; p=0,139 | r=0,172; p=0,331 | r=0,163; p=0,357 | r=0,107; p=0,546 | r=0,294; p=0,092 |
| T.PRO | r=−0,129; p=0,469 | r=0,1; p=0,575* | r=−0,37; p=0,031* | r=−0,148; p=0,404 | r=0,145; p=0,412* | r=0,016; p=0,929* | r=0,041; p=0,818 | r=0,17; p=0,337* |
| ALB | r=0,026; p=0,882 | r=0,235; p=0,18* | r=−0,113; p=0,526* | r=0,11; p=0,535 | r=0,036; p=0,839* | r=0,227; p=0,196* | r=0,013; p=0,943 | r=0,074; p=0,679* |
Comparison of liver values according to surgery
| Surgery | Test Statistics | p-value | ||||
|---|---|---|---|---|---|---|
| BCS | MRM | |||||
| Mean ± SD | Median (min-max) | Mean ± SD | Median (min-max) | |||
| Liver Volume (cc) | 1552.46 ± 320.52 | 1566.6 (1014–2123.5) | 1408.3 ± 361.23 | 1290. (843.8–2298.1) | t = 1.214 | 0.233 |
| Liver V 30Gy (%) | 3.1 ± 3.03 | 1.9 (0–9.1) | 2.8 ± 3.93 | 1.4 (0–12.03) | U = 111.5 | 0.381 |
| Liver mean (Gy) | 765.46 ± 339.81 | 756.7 (257.2–1564.2) | 729.81 ± 451.29 | 762.5 (133.8–1699.8) | t = 0.262 | 0.795 |
Comparison of before and after radiotherapy (RT) blood parameters
| Before RT | After RT | Test statistics | p-value | |||
|---|---|---|---|---|---|---|
| Mean ± SD | Median (min - max) | Mean ± SD | Median (min - max) | |||
| ALP | 79.44 ± 34.28 | 71,5 (33–202) | 90.5 ± 53.19 | 82.0 (39–357) | Z = −2.232 | 0.026 |
| ALT | 24.84 ± 12.95 | 21.0 (8–62) | 20.26 ± 1.,89 | 17.0 (8–63) | Z = −2.423 | 0.015 |
| AST | 23.21 ± 7.88 | 21.0 (13–48) | 24.32 ± 12.51 | 21.0 (13–74) | Z = −0.089 | 0.929 |
| GGT | 35.42 ± 34.08 | 23.0 (7–160) | 33.56 ± 30.68 | 24.0 (12–170) | Z = −0.241 | 0.809 |
| LDH | 228.14 ± 64.71 | 224.5 (108–401) | 216.85 ± 45.95 | 210.5 (140–310) | t = 0.968 | 0.340 |
| Total protein | 71.15 ± 4.88 | 71.0 (51–80) | 72.94 ± 3.25 | 72.65 (64.8–79) | Z = −2.082 | 0.037 |
| Albumin | 41.91 ± 2.21 | 42.0 (38–45) | 43.36 ± 2.87 | 43.05 (35.6–48.7) | t = −3.12 | 0.004 |
| Total bilirubin | 0.52 ± 0.26 | 0.48 (0.11–1.3) | 0.51 ± 0.29 | 0.46 (0.19–1.9) | Z= −0.128 | 0.898 |
Distribution of kPa values in liver segments and stages (distribution of each response)
| Segment (Grade) | n(%) |
|---|---|
| Segment-2 | |
| 1 | 13 (38.2) |
| 2 | 14 (41.1) |
| 3 | 1 (2.9) |
| N | 6 (17.6) |
| N~ or Chronic Inflammation | 14 (41.1) |
| Segment 4a | |
| 1 | 13 (38.2) |
| 2 | 20 (58.8) |
| 3 | 11 (32.3) |
| 4 | 2 (5.8) |
| N | 6 (17.6) |
| N~ or Chronic Inflammation | 3 (8.8) |
| Segment 8 | |
| 1 | 9 (26.4) |
| 2 | 14 (41.1) |
| 3 | 12 (35.2) |
| 4 | 7 (20.5) |
| N | 4 (11.7) |
| N~ or Chronic Inflammation | 4 (11.7) |
| Segment 7 | |
| 1 | 2 (5.8) |
| 2 | 2 (5.8) |
| N | 19 (55.8) |
| N~ or Chronic Inflammation | 13 (38.2) |
| Segment 3 | |
| 1 | 4 (11.7) |
| 2 | 4 (11.7) |
| N | 16 (47.0) |
| N~ or Chronic Inflammation | 14 (41.1) |
| Segment 4b | |
| 1 | 8 (23.5) |
| 2 | 9 (26.4) |
| 3 | 1 (2.9) |
| N | 17 (50.0) |
| N~ or Chronic Inflammation | 8 (23.5) |
| Segment 5 | |
| 1 | 7 (20.5) |
| 2 | 7 (20.5) |
| N | 15 (44.1) |
| N~ or Chronic Inflammation | 12 (35.2) |
| Segment 6 | |
| 1 | 1 (2.9) |
| 2 | 1 (2.9) |
| N | 19 (55.8) |
| N~ or Chronic Inflammation | 14 (41.1) |