
FIGURE 1.
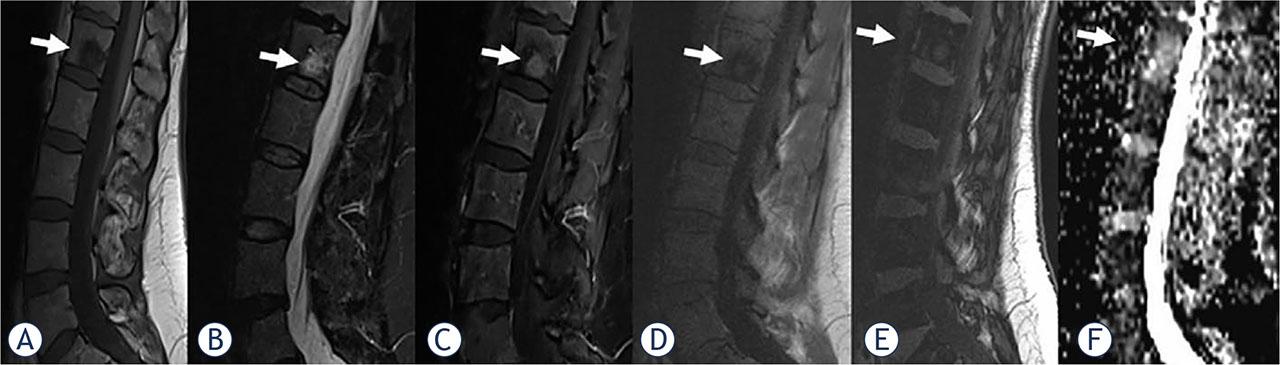
FIGURE 2.
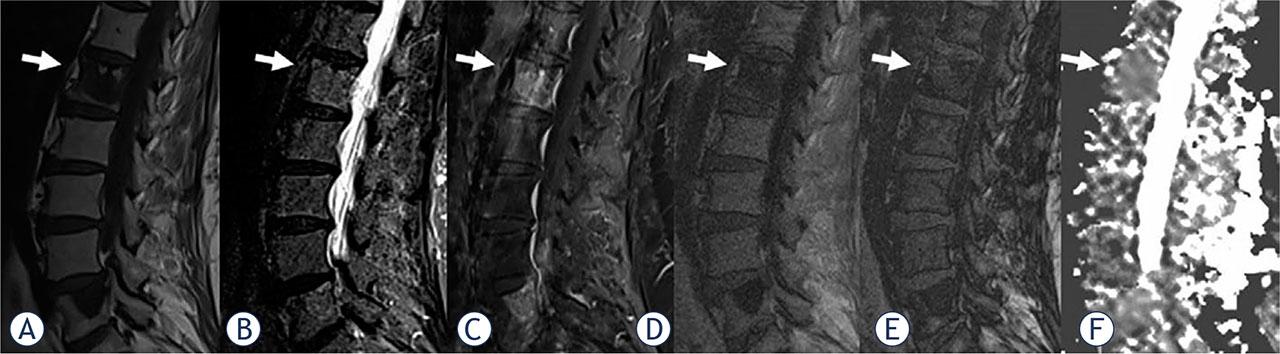
FIGURE 3.
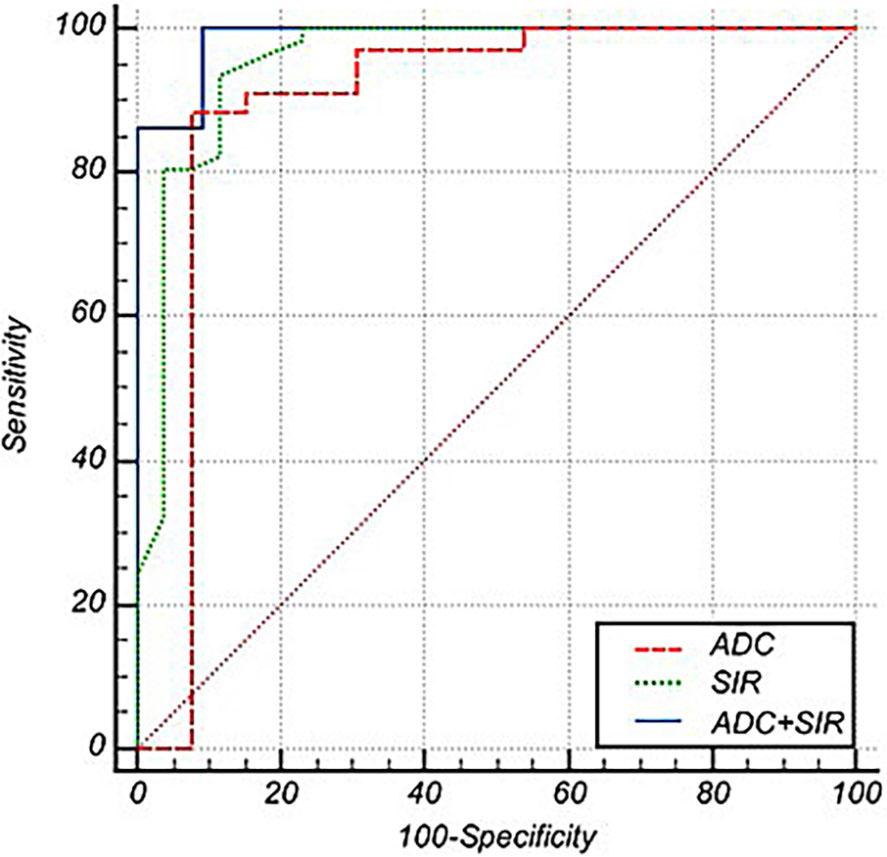
Diagnostic performance of the signal intensity ratio (SIR), apparent diffusion coefficient (ADC), and combination (SIR, ADC) for differentiating benign from malignant vertebral bone marrow lesions (VBMLs)
| Parameters | AUC (95% CI) | Standard error | p | Cut-off | Sensitivity (%) | Specificity (%) |
|---|---|---|---|---|---|---|
| SIR | 0.953 (0.886–0.987) | 0.029 | < 0.001 | > 0.82 | 93.6 | 88.5 |
| ADC | 0.894 (0.769–0.965) | 0.077 | < 0.001 | ≤ 1.57 | 88.2 | 92.3 |
| Combination (SIR, ADC) | 0.988 (0.872–1.000) | 0.014 | < 0.001 | > 0.19 | 100.0 | 90.9 |
The studies of diffusion-weighted imaging in the differentiation of bone marrow lesions
| Authors | No. of lesions | Clinical features | Technical parameters No. of image planes | Technical parameters b values (s/mm2) | ADC cut-off values (× 10−3 mm2/s) |
|---|---|---|---|---|---|
| Park et al.9 | 86 | Traumatic CFs vs. tumor infiltration with/without malignant CFs | Single shot SE EPI | 0, 400, 1000 | 1.14 |
| Kwack et al.10 | 126 | Focal benign lesion vs. metastases | Single-shot echo-planar | 0, 800 | 0.995 |
| Geith et al.12 | 46 | Osteoporotic vs. malignant CFs | Single shot TSE | 100, 250, 400 | 1.7 |
| Park et al.23 | 58 | Hyperplastic hematopoietic BM vs. malignant BM lesions | Single shot SE EPI | 0, 800 | 0.695 |
| Schmeel et al.27 | 89 | Benign (traumatic, inflammatory, and primary) vs. malignant (metastatic and hematologic) | Single-shot spin-echo echo-planar with multislice short TI inversion recovery fat suppression | 0, 800 | 1.08 |
| Pozzi et al.29 | 116 | Benign primary tumors vs. bone metastases vs. malignant primary tumors | Spin-echo echo-planar technique | 0, 1000 | 0.952 (benign vs. malignant tumors) |
| Hajalioghli et al.30 | 23 | Atypical hemangiomas and metastases | Spin-echo single-shot echo-planar with fat suppression | 50, 400 | 0.958 |
| Lee et al.31 | 51 | Schmorl nodes vs. bone metastases | Single-shot (FOCUS, GE Healthcare) | 0, 400, 1000 | 1.028 |