
FIGURE 1.
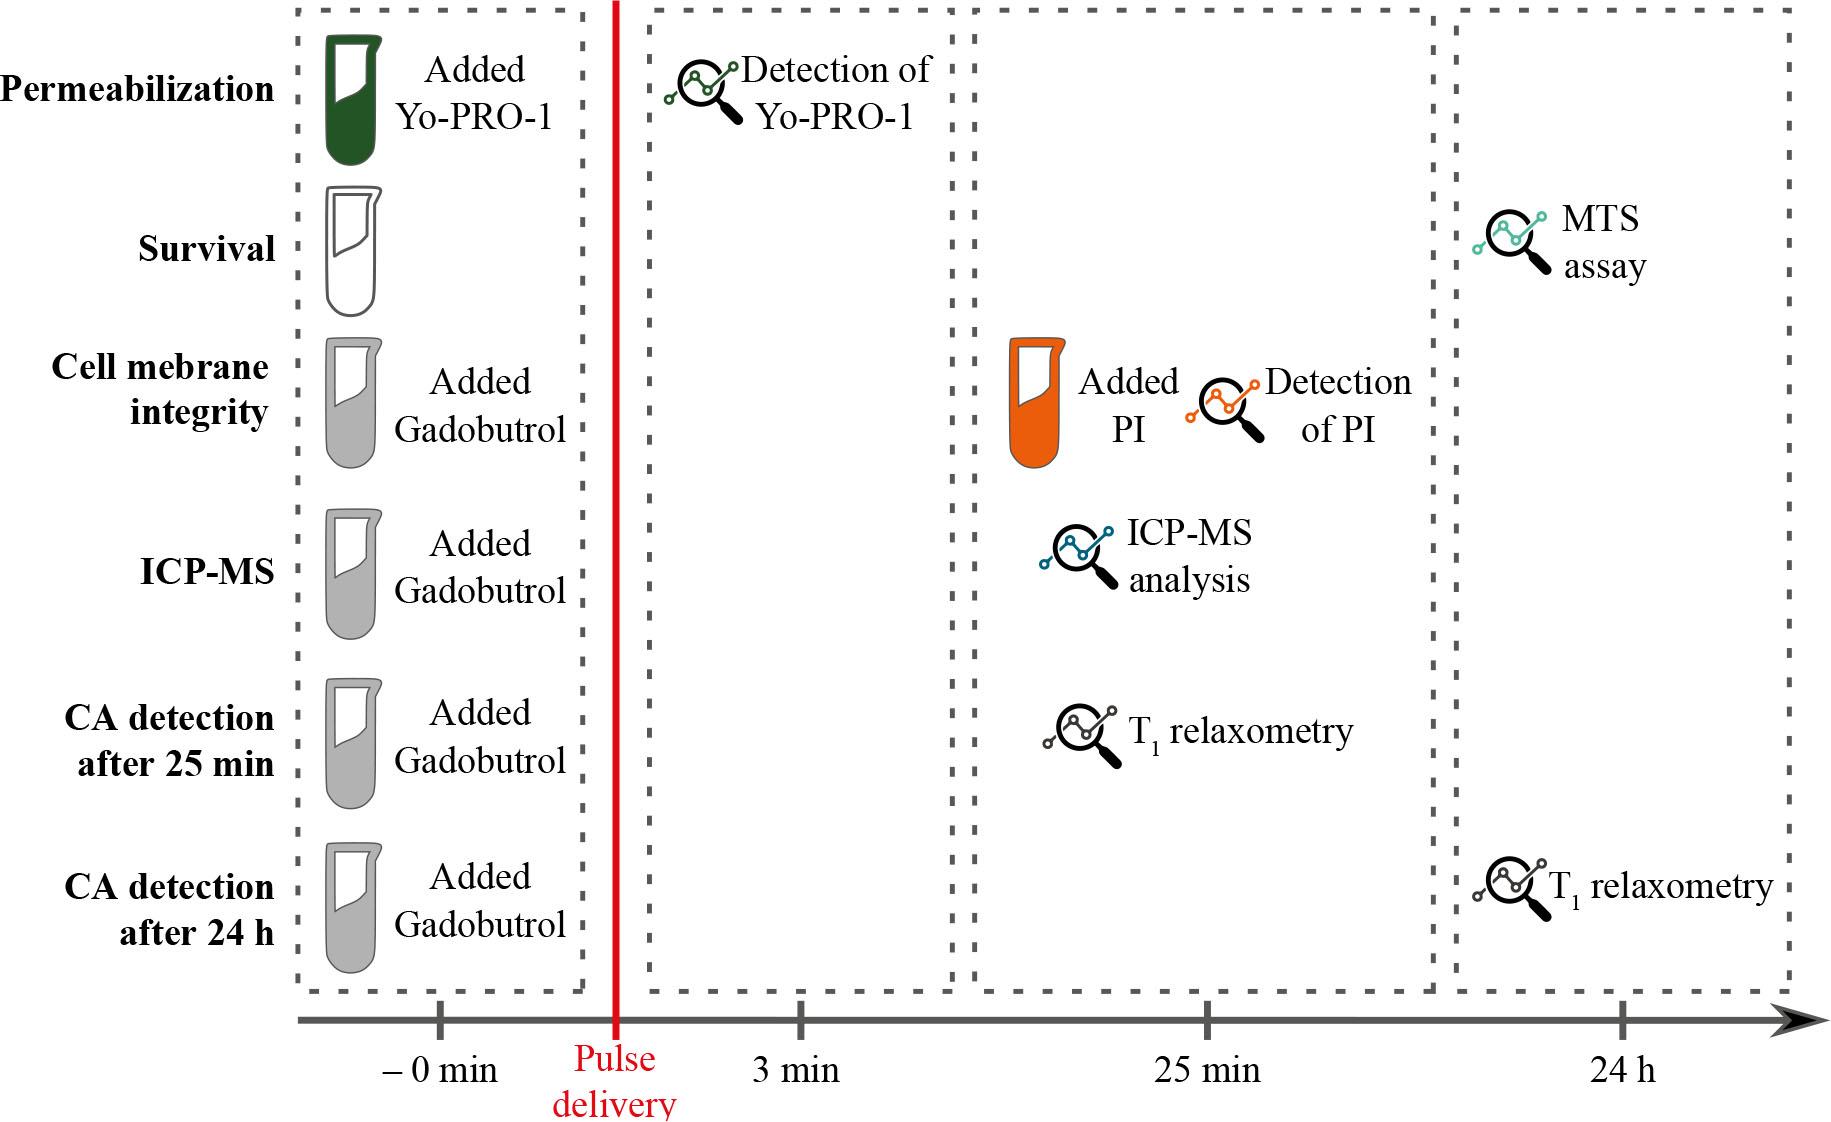
FIGURE 2.
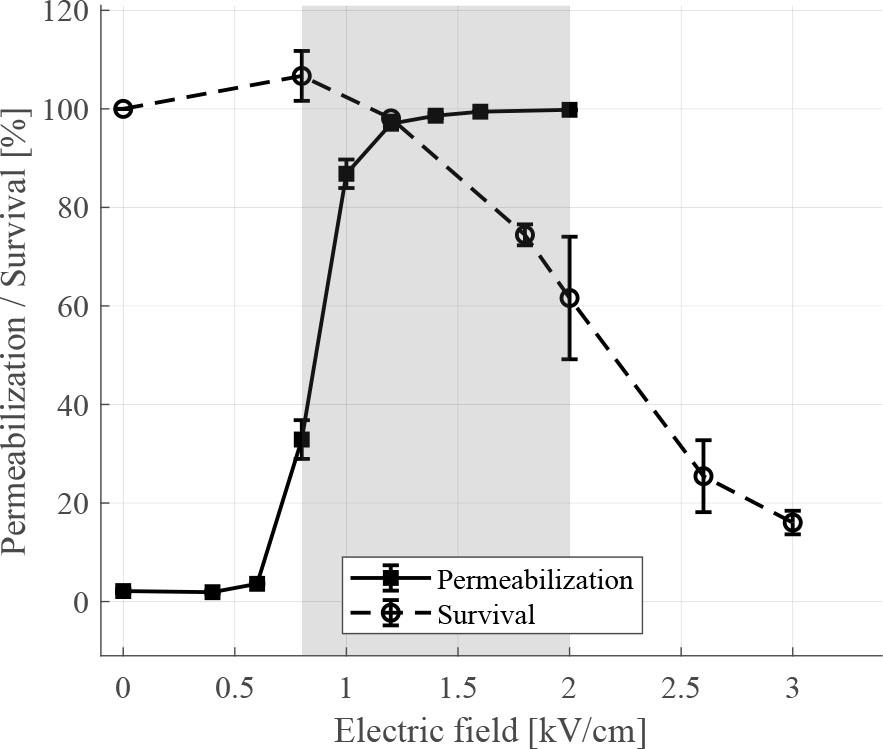
FIGURE 3.
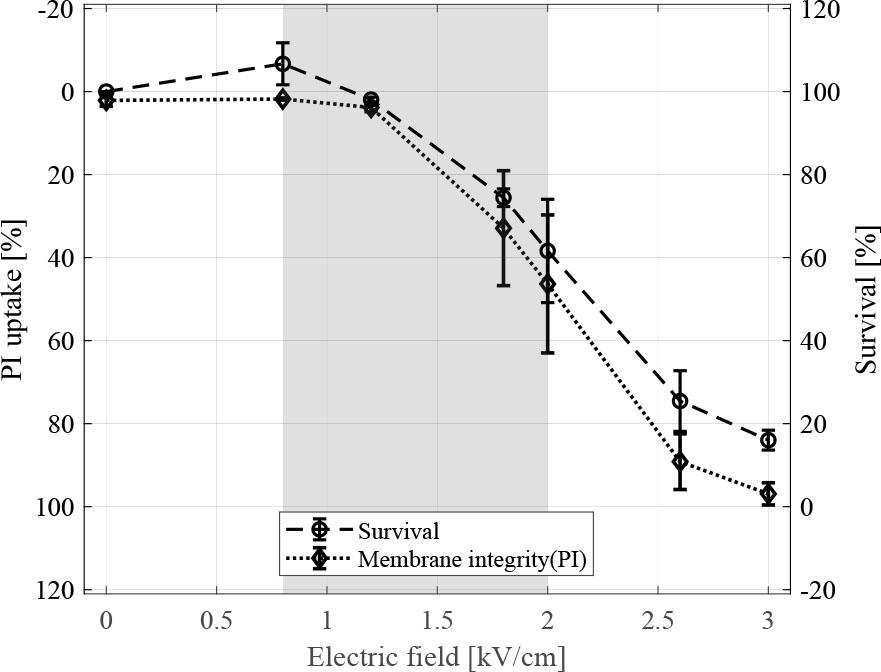
FIGURE 4.
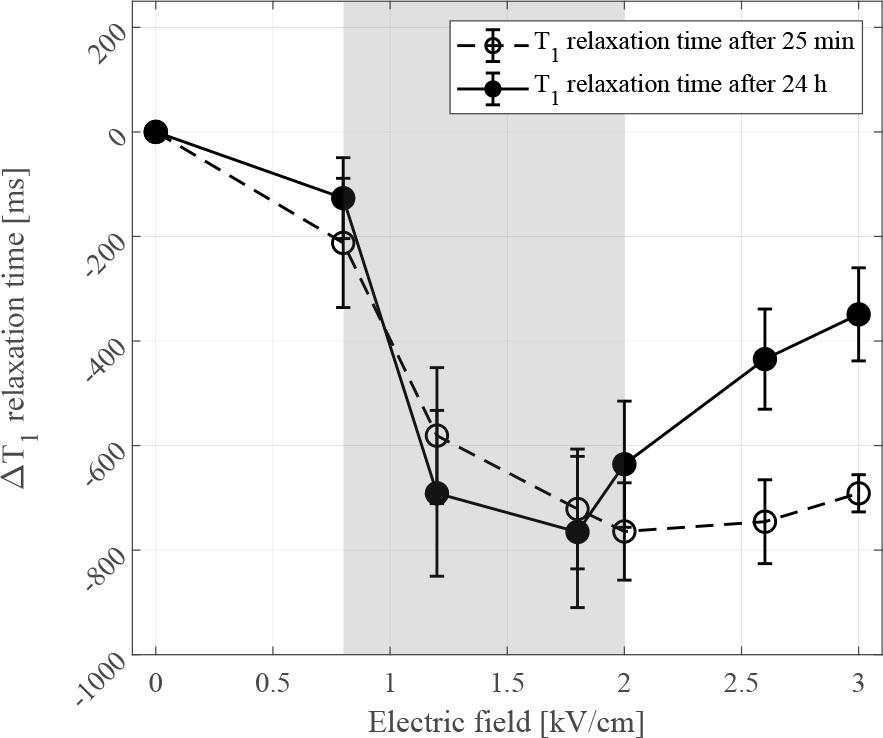
FIGURE 5.
Parameters of electric pulses used in experiments
| Experiment | U [V] | E [kV/cm] | Single pulse duration [μs] | Pulse repetition rate [1/s] | Number of pulses [/] |
|---|---|---|---|---|---|
| Permeabilization | 120–400 | 0.6–2.0 | 100 | 1 | 8 |
| ICP-MS | 120–280 | 0.6–1.4 | 100 | 1 | 8 |
| Cell survival | 160–600 | 0.8–3.0 | 100 | 1 | 8 |
| Cell membrane integrity | 160–600 | 0.8–3.0 | 100 | 1 | 8 |
| CA detection experiments | 160–600 | 0.8–3.0 | 100 | 1 | 8 |