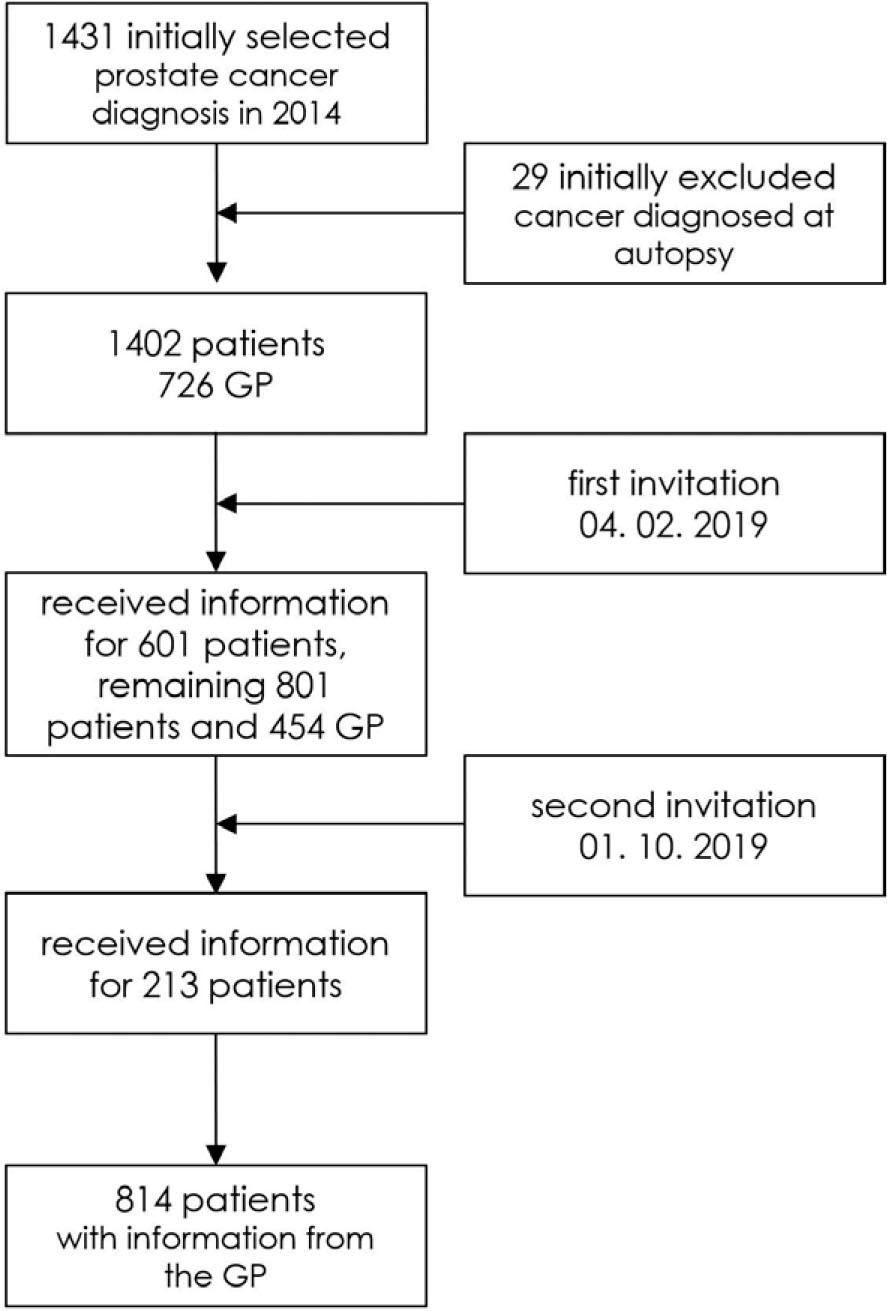
FIGURE 1.
Sociodemographic and clinical characteristics of prostate cancer patients (N = 814)
| Characteristics | Sample of prostate cancer patients, n (%) |
|---|---|
| Age (mean ± SD), range: 44–97 | 69.0 ± 8.5 |
| Age, groups | |
| < 65 | 265 (32.5) |
| 65–75 | 357 (43.9) |
| > 75 | 192 (23.6) |
| Cancer stage | |
| Localized | 572 (70.3) |
| Spread | 191 (23.4) |
| Metastatic | 51 (6.3) |
| Education | |
| Primary/Elementary education | 280 (34.4) |
| Secondary/High school education | 386 (47.4) |
| Higher education | 148 (18.2) |
| Comorbidities | |
| No. of comorbidities (mean ± SD), range: 0–6 | 1.2 ± 1.2 |
| None | 290 (35.6) |
| 1–2 | 410 (50.4) |
| > 2 | 114 (14) |
| Number of patients by region of the primary health care centre's location | |
| Pomurska | 106 (13) |
| Podravska | 114 (14) |
| Koroška | 31 (3.8) |
| Savinjska | 85 (10.4) |
| Zasavska | 3 (0.4) |
| Spodnjeposavska | 25 (3.1) |
| JV Slovenija | 53 (6.5) |
| Osrednjeslovenska | 204 (25.1) |
| Gorenjska | 69 (8.5) |
| Notranjsko-kraška | 27 (3.3) |
| Goriška | 56 (6.9) |
| Obalno-kraška | 41 (5.0) |
| Symptoms and signs at first presentation (multiple options possible) | |
| Dysuria | 111 (13.6) |
| LUTS | 307 (37.7) |
| Pain in the abdomen | 63 (7.7) |
| Family history of cancer | 17 (2.1) |
| Elevated PSA | 246 (30.2) |
| Other | 130 (16) |
| Alive 5-years after diagnosis | 610 (74.9) |
Duration of doctor and primary care interval
| mean (± SD) | range | |
|---|---|---|
| Doctor interval, days | 37.5 (92.8) | 0–365 |
| Primary care interval, days | 67.4 (123.8) | 0–365 |
5-year survival in relation to sociodemographic and organizational variables
| Variables | Dead n (%) | Alive n (%) | P value |
|---|---|---|---|
| Age groups | < 0.001 | ||
| < 65 | 32 (12) | 233 (88) | |
| 65–75 | 72 (20.2) | 285 (79.8) | |
| >75 | 100 (52) | 92 (48) | |
| Education | < 0.001 | ||
| Primary/Elementary education | 91 (32.5) | 189 (67.5) | |
| Secondary/High school education | 84 (21.8) | 302 (78.2) | |
| Higher education | 29 (19.6) | 119 (80.4) | |
| Region of the location of primary health care centre | NS | ||
| Pomurska | 32 (30.2) | 74 (69.8) | |
| Podravska | 34 (29.8) | 80 (70.2) | |
| Koroška | 9 (29) | 22 (71) | |
| Savinjska | 18 (21.2) | 67 (78.8) | |
| Spodnjeposavska | 5 (20) | 20 (80) | |
| JV Slovenija | 15 (28.3) | 38 (71.7) | |
| Osrednjeslovenska | 44 (21.6) | 160 (78.4) | |
| Gorenjska | 17 (24.6) | 52 (75.4) | |
| Notranjo-kraška | 6 (22.2) | 21 (77.8) | |
| Goriška | 14 (25) | 42 (75) | |
| Obalno-kraška | 10 (24.4) | 31 (75.6) | |
| Cancer stage | < 0.001 | ||
| Localized | 124 (21.7) | 448 (78.3) | |
| Spread | 36 (18.8) | 155 (81.2) | |
| Metastatic | 44 (86.3) | 7 (13.7) | |
| Comorbidities | < 0.001 | ||
| None | 72 (24.8) | 218 (75.2) | |
| 1–2 | 86 (21) | 324 (79) | |
| >2 | 46 (40.4) | 68 (59.6) | |
| GP access to laboratory (CBC, CRP, urine) | < 0.001 | ||
| Yes | 159 (21.7) | 575 (78.3) | |
| No | 45 (56.2) | 35 (43.8) | |
| GP access to laboratory (PSA) | < 0.001 | ||
| Yes | 136 (20.8) | 517 (79.2) | |
| No | 68 (42.2) | 93 (57.8) | |
| GP access to US | < 0.05 | ||
| Yes | 62 (20.3) | 244 (79.7) | |
| No | 142 (28) | 366 (72) | |
| Symptomatic patient | < 0.001 | ||
| Yes | 103 (25.8) | 296 (74.2) | |
| No | 29 (13.2) | 190 (86.8) |
Diagnostic procedures performed by the general practitioner (GP) and their access to laboratory and abdominal ultrasound within the primary health care centre, overall and by region (N = 811)
| Diagnostic procedures performed by GPs | Sample of prostate cancer patients, n (%) | ||||
|---|---|---|---|---|---|
| CBC, CRP | 497 (61.1) | ||||
| PSA | 664 (81.6) | ||||
| Urine | 471 (57.9) | ||||
| US | 434 (53.3) | ||||
| DRE | 255 (31.3) | ||||
| Diagnostic procedures performed by GPs by region | CBC, CRP | PSA | urine | US | DRE |
| Pomurska (N = 106) | 48 (45.3) | 77 (72.6) | 52 (49.1) | 39 (36.8) | 34 (32.1) |
| Podravska (N = 114) | 77 (67.5) | 95 (83.3) | 60 (52.6) | 68 (59.6) | 23 (20.2) |
| Koroška (N = 31) | 15 (48.4) | 24 (77.4) | 13 (41.9) | 4 (12.9) | 11 (35.5) |
| Savinjska (N = 85) | 55 (64.7) | 64 (75.3) | 61 (71.8) | 50 (58.8) | 26 (30.6) |
| Spodnjeposavska (N = 25) | 14 (56) | 20 (80) | 16 (64) | 11 (44) | 13 (52) |
| JV Slovenija (N = 53) | 35 (66) | 39 (73.6) | 25 (47.2) | 19 (35.8) | 11 (20.8) |
| Osrednjeslovenska (N = 204) | 135 (66.2) | 180 (88.2) | 131 (64.2) | 140 (68.6) | 46 (22.5) |
| Gorenjska (N = 69) | 48 (69.6) | 63 (91.3) | 44 (63.8) | 39 (56.5) | 22 (31.9) |
| Notranjsko-kraška (N = 27) | 21 (77.8) | 23 (85.2) | 19 (70.4) | 20 (74.1) | 15 (55.6) |
| Goriška (N = 56) | 28 (50) | 45 (80.4) | 29 (51.8) | 22 (39.3) | 33 (58.9) |
| Obalno-kraška (N = 41) | 19 (46.3) | 32 (78) | 19 (46.3) | 20 (48.8) | 19 (46.3) |
| Accessibility to diagnostic tests in the primary health care centre | Sample of prostate cancer patients, n (%) | ||||
| Laboratory (CBC, CRP, urine) | 734 (90.2) | ||||
| Laboratory (PSA) | 653 (80.2) | ||||
| US | 306 (37.6) | ||||
| Accessibility to diagnostic tests in the primary health care centre by region | CBC, CRP, urine | PSA | US | ||
| Pomurska (N = 106) | 96 (90.6) | 79 (74.5) | 34 (32.1) | ||
| Podravska (N = 114) | 98 (86) | 89 (78.1) | 42 (36.8) | ||
| Koroška (N = 31) | 28 (90.3) | 26 (83.9) | 22 (71) | ||
| Savinjska (N = 85) | 78 (91.8) | 63 (74.1) | 36 (42.4) | ||
| Spodnjeposavska (N = 25) | 23 (92) | 16 (64) | 10 (40) | ||
| JV Slovenija (N = 53) | 46 (86.8) | 42 (79.2) | 15 (28.3) | ||
| Osrednjeslovenska (N = 204) | 187 (91.7) | 173 (84.8) | 74 (36.3) | ||
| Gorenjska (N = 69) | 63 (91.3) | 60 (87) | 31 (44.9) | ||
| Notranjsko-kraška (N = 27) | 24 (88.9) | 20 (74.1) | 7 (25.9) | ||
| Goriška (N = 56) | 53 (94.6) | 52 (92.9) | 23 (41.1) | ||
| Obalno-kraška (N = 41) | 36 (87.8) | 31 (75.6) | 12 (29.3) | ||
The distribution and association of selected characteristics with doctor and primary care interval_ (N = 811)
| N | % | Doctor Interval | Primary care interval | |||||
|---|---|---|---|---|---|---|---|---|
| Median | Interquartile range | P | Median | Interquartile range | P | |||
| Age groups | 0.131 | 0.382 | ||||||
| < 65 | 264 | 32.55 | 0 | 0–4 | 5 | 0–65 | ||
| 65–75 | 355 | 43.77 | 0 | 0–5 | 4 | 0–51 | ||
| > 75 | 192 | 23.67 | 0 | 0–20 | 7 | 0–73 | ||
| Education | 0.437 | 0.204 | ||||||
| Primary/Elementary education | 278 | 34.28 | 0 | 0–6 | 7 | 0–38 | ||
| Secondary/High school education | 385 | 47.47 | 0 | 0–5 | 3 | 0–53 | ||
| Higher education | 148 | 18.25 | 0 | 0–18 | 7 | 0–127 | ||
| Region of the location of primary health care centre | 0.863 | 0.021 | ||||||
| Pomurska | 106 | 13.07 | 0 | 0–18 | 3 | 0–62 | ||
| Podravska | 114 | 14.06 | 0 | 0–20 | 8 | 0–50 | ||
| Koroška | 31 | 3.82 | 0 | 0–20 | 0 | 0–42 | ||
| Savinjska | 85 | 10.48 | 0 | 0–3 | 0 | 0–28 | ||
| Spodnjeposavska | 25 | 3.08 | 0 | 0–10 | 3 | 0–91 | ||
| JV Slovenija | 53 | 6.54 | 0 | 0–7 | 1 | 0–62 | ||
| Osrednjeslovenska | 204 | 25.15 | 0 | 0–5 | 10 | 0–88 | ||
| Gorenjska | 69 | 8.51 | 0 | 0–2 | 4 | 0–54 | ||
| Notranjo-kraška | 27 | 3.33 | 0 | 0–7 | 6 | 0–127 | ||
| Goriška | 56 | 6.90 | 0 | 0–5 | 4 | 0–34 | ||
| Obalno–kraška | 41 | 5.06 | 0 | 0–20 | 4 | 0–48 | ||
| Cancer stage | 0.037 | 0.058 | ||||||
| Localized | 569 | 70.16 | 0 | 0–8 | 6 | 0–65 | ||
| Spread | 191 | 23.55 | 0 | 0–1 | 1 | 0–28 | ||
| Metastatic | 51 | 6.29 | 0 | 0–38 | 3 | 0–336 | ||
| Comorbidities | 0.001 | 0.026 | ||||||
| None | 288 | 35.51 | 0 | 0–31 | 7 | 0–101 | ||
| 1–2 | 409 | 50.43 | 0 | 0–4 | 5 | 5–44 | ||
| > 2 | 114 | 14.06 | 0 | 0–1 | 0 | 0–33 | ||
| GP access to laboratory (CBC, CRP, urine) | < 0.001 | < 0.001 | ||||||
| Yes | 732 | 90.26 | 0 | 0–4 | 3 | 0–37 | ||
| No | 79 | 9.74 | 40 | 0–330 | 365 | 0–365 | ||
| GP access to laboratory (PSA) | < 0.001 | < 0.001 | ||||||
| Yes | 651 | 80.27 | 0 | 0–2 | 3 | 0–37 | ||
| No | 160 | 19.73 | 0 | 0–177 | 21 | 0–365 | ||
| GP access to US | 0.781 | 0.124 | ||||||
| Yes | 306 | 37.73 | 0 | 0–5 | 4 | 0–31 | ||
| No | 505 | 62.27 | 0 | 0–7 | 5 | 0–78 | ||
| Symptomatic patient | < 0.001 | 0.001 | ||||||
| Yes | 399 | 49.20 | 0 | 0–12 | 5 | 0–42 | ||
| No | 219 | 27.00 | 0 | 0–0 | 0 | 0–18 | ||
Logistic regression model on predicting primary care interval
| Variables in the Equation | B | Wald | Exp(B) (95% CI) |
|---|---|---|---|
| Age | −0.004 | 0.144 | 0.996 (0.979, 1.015) |
| Education primary vs secondary | −0.359 | 4.223 | 0.698 (0.496, 0.984)* |
| Education primary vs higher | 0.145 | 0.452 | 1.156 (0.757, 1.765) |
| Cancer stage localized vs spread | −0.336 | 3.315 | 0.714 (0.497, 1.026) |
| Cancer stage localized vs metastatic | −0.316 | 0.955 | 0.729 (0.387, 1.374) |
| No comorbidities | −0.070 | 1.051 | 0.932 (0.815, 1.066) |
| First symptom - dysuria | −0.175 | 0.592 | 0.840 (0.538, 1.310) |
| First symptom – LUTS | −0.084 | 0.228 | 0.919 (0.650, 1.300) |
| First symptom – abdominal pain | 0.132 | 0.222 | 1.141 (0.659, 1.977) |
| First symptom – family history of cancer | 0.257 | 0.249 | 1.293 (0.471, 0.913) |
| First symptom – elevated PSA | −0.486 | 5.804 | 0.615 (0.414, 0.913)* |
| Accessible US diagnostics | −0.160 | 0.940 | 0.852 (0.616, 1.178) |
| Accessible laboratory diagnostics (PSA) | −0.196 | 0.660 | 0.822 (0.512, 1.319) |
| Accessible laboratory diagnostics (CBC, CRP, urine) | −1.139 | 11.375 | 0.320 (0.165, 0.620)*** |
| Constant | 1.483 | 4.119 | 4.405* |