Figure 1.
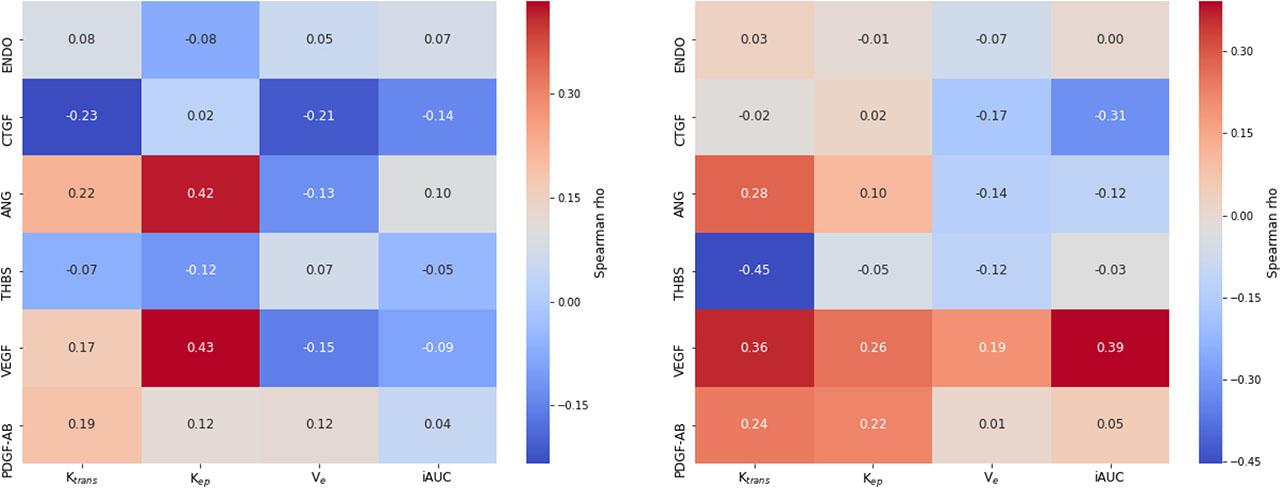
Figure 2.
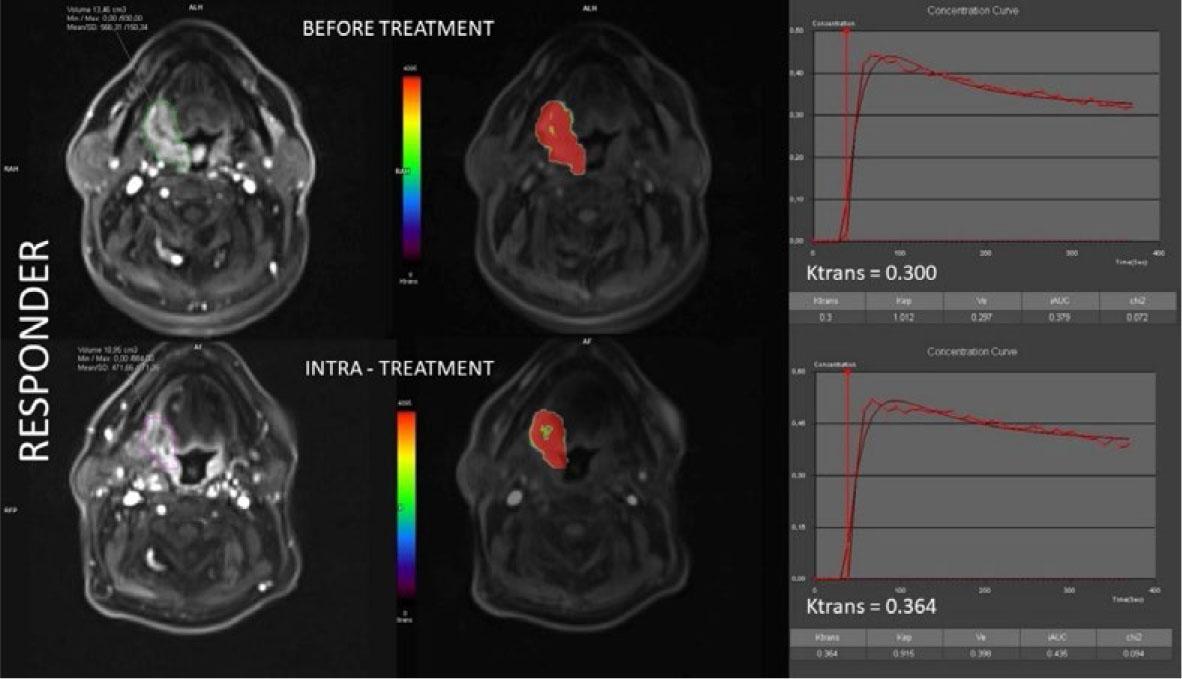
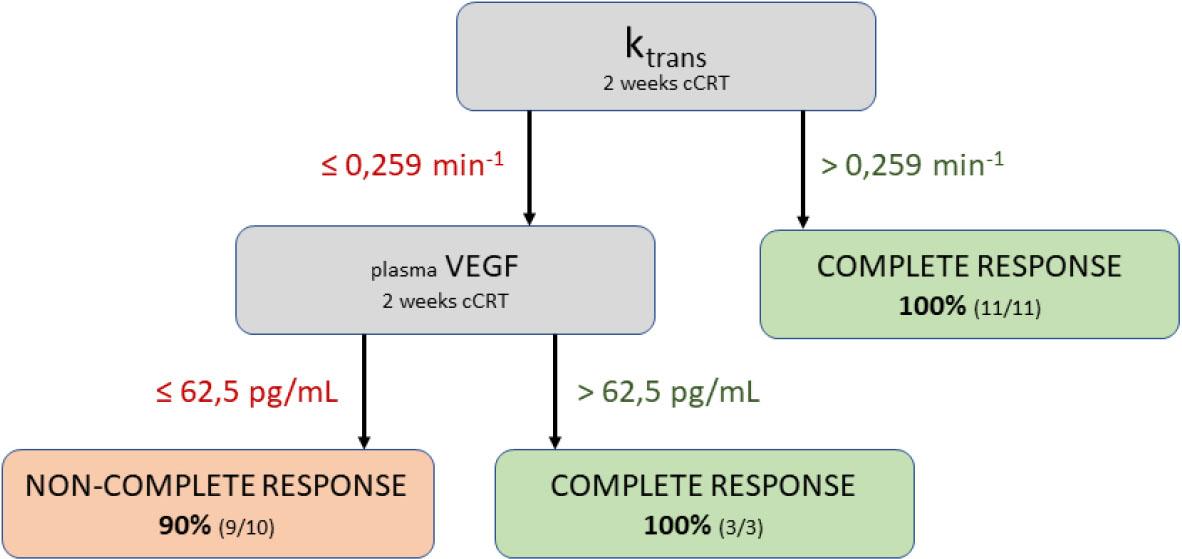
Figure 3.
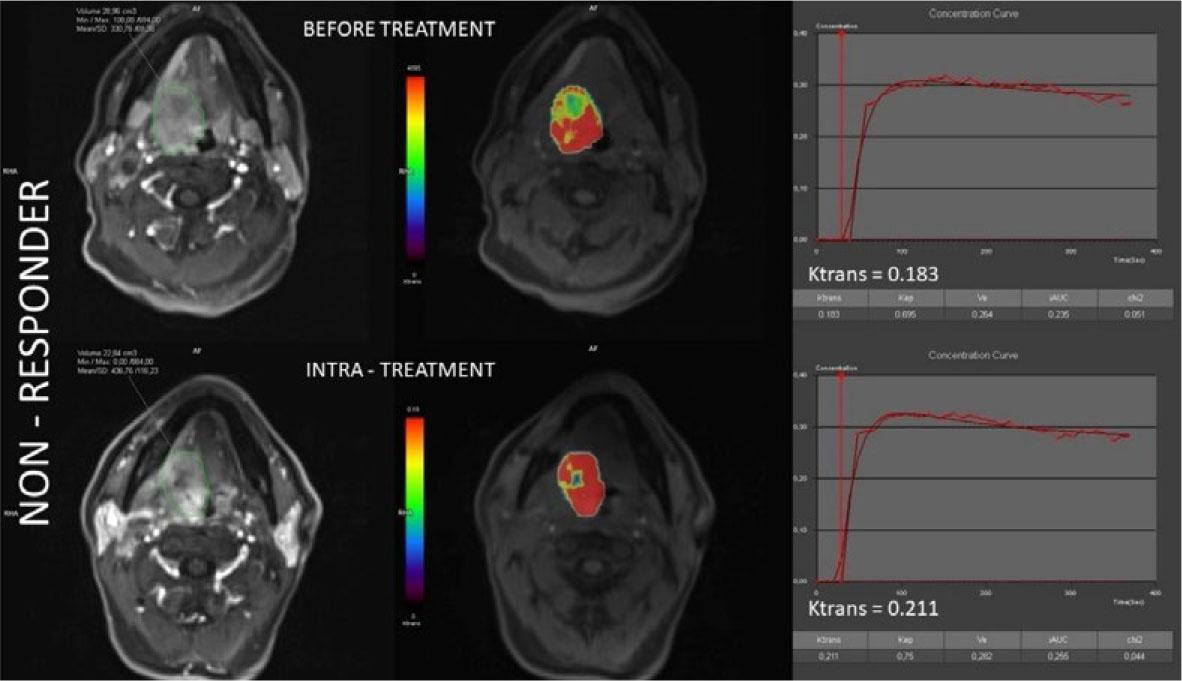
Figure 4.
Expression of plasma angiogenic factors for responders and non-responders: mean values, 95% confidence interval (CI) and corresponding p-values
| Plasma Angiogenic Factor | Responders (n = 15) | Non-responders (n = 9) | p |
|---|---|---|---|
| VEGF (95% CI) pg/mL | |||
| Before treatment | 66.9 (58.1–75.7) | 50.2 (41.8–58.5) | 0.011* |
| After 20 Gy | 68.4 (61.0 –75.7) | 48.0 (40.4–55.5) | 0.0006** |
| 10–12 weeks after cCRT completion | 74.7 (50.8–98.6) | 49.0 (38.5–59.5) | 0.010* |
| PDGF-AB (95% CI) pg/mL | |||
| Before treatment | 2826.6 (1909.3–3743.9) | 2430.6 (1179.1–3682.1) | 0.431 |
| After 20 Gy | 2496.0 (2105.8–2886.2) | 1799.1 (1319.3–22789) | 0.021* |
| 10–12 weeks after cCRT completion | 1513.5 (902.7–2124.3) | 1468.5 (779.1–2157.9) | 0.919 |
| ANG (95% CI) pg/mL | |||
| Before treatment | 2140.8 (1588.2–2693.4) | 1218.0 (223.0 –2213.0) | 0.060 |
| After 20 Gy | 2124.1 (1653.4–2594.9) | 1438.0 (405.6–2470.4) | 0.131 |
| 10–12 weeks after cCRT completion | 1898.1 (1248.7–2547.6) | 1384.8 (255.7–2513.9) | 0.347 |
| THBS1 (95% CI) ng/mL | |||
| Before treatment | 1113.2 (1069.3–1157.2) | 1115.6 (1055.8–1175.5) | 0.943 |
| After 20 Gy | 1112.3 (1051.5–1173.1) | 1162.7 (1064.2–1261.2) | 0.257 |
| 10–12 weeks after cCRT completion | 1061.2 (1008.8–1113.8) | 1136.8 (1002.9–1270.7) | 0.210 |
| END (95% CI) pg/mL | |||
| Before treatment | 64792.6 (52731.7–76853.4) | 59350.6 (47299.1–71402.1) | 0.521 |
| After 20 Gy | 71269.2 (55039.7–87498.7) | 59636.7 (48124.0 –71149.5) | 0.283 |
| 10–12 weeks after cCRT completion | 84744.3 (65061.5–104427.2) | 74754.7 (54514.5–94994.9) | 0.475 |
| CTGF (95% CI) pg/mL | |||
| Before treatment | 32.6 (13.9–51.2) | 24.4 (14.4–34.5) | 0.976 |
| After 20 Gy | 31.2 (24.1–122.8) | 23.5 (12.3–34.8) | 0.721 |
| 10–12 weeks after cCRT completion | 26.1 (15.7–36.6) | 23.2 (15.1–31.3) | 1 |
Summary of patient, tumour and treatment characteristics
| Number of patients | 25 |
| Age, median (range) | 60 (45–70) |
| Male gender (%) | 25 (100) |
| Primary location (%) | |
| Oropharynx | 25 (100) |
| Stage (%) | |
| III | 5 (20) |
| IVa | 8 (32) |
| IVb | 12 (48) |
| Radiotherapy dose (Gy), median (range) | 70 (68–70) |
| Concomitant chemotherapy, median no. of cycles (range) | 6 (1–7) |
Correlations between dynamic contrast-enhanced magnetic resonance imaging (DCE-MRI) perfusion parameters and biochemical parameters, along with their respective Spearman's rho and p-values
| Time-point | DCE-MRI parameter | Biochemical parameter | Spearman rho | p |
|---|---|---|---|---|
| Before treatment | kep | VEGF | 0.433 | 0.034* |
| kep | ANG | 0.420 | 0.058 | |
| After 20 Gy | ktrans | THBS1 | −0.453 | 0.026* |
| ktrans | VEGF | 0.362 | 0.083 | |
| iAUC | VEGF | 0.391 | 0.056 | |
| iAUC | CTFG | −0.315 | 0.134 |
A summary of tumour perfusion characteristics for responders and nonresponders: mean values, standard deviations (SD), and corresponding p-values
| DCE-MRI parameter | Responders (n = 15) | Non-responders (n = 9) | p |
|---|---|---|---|
| ktrans (SD) | |||
| Before treatment | 0.270 (0.087) | 0.169 (0.062) | 0.006** |
| After 20 Gy | 0.289 (0.067) | 0.215 (0.027) | 0.007** |
| Δ | 0.019 (0.060) | 0.047 (0.078) | 0.326 |
| kep (SD) | |||
| Before treatment | 0.924 (0.231) | 0.817 (0.258) | 0.144 |
| After 20 Gy | 0.819 (0.229) | 0.709 (0.086) | 0.065 |
| Δ | −0.105 (0.274) | −0.108 (0.245) | 0.980 |
| Ve (SD) | |||
| Before treatment | 0.306 (0.082) | 0.237 (0.108) | 0.092 |
| After 20 Gy | 0.366 (0.086) | 0.347 (0.107) | 0.636 |
| Δ | 0.059 (0.093) | 0.109 (0.196) | 0.721 |
| iAUC (SD) | |||
| Before treatment | 0.334 (0.109) | 0.220 (0.092) | 0.015* |
| After 20 Gy | 0.361 (0.070) | 0.336 (0.099) | 0.468 |
| Δ | 0.027 (0.120) | 0.116 (0.183) | 0.676 |