
Figure 1.
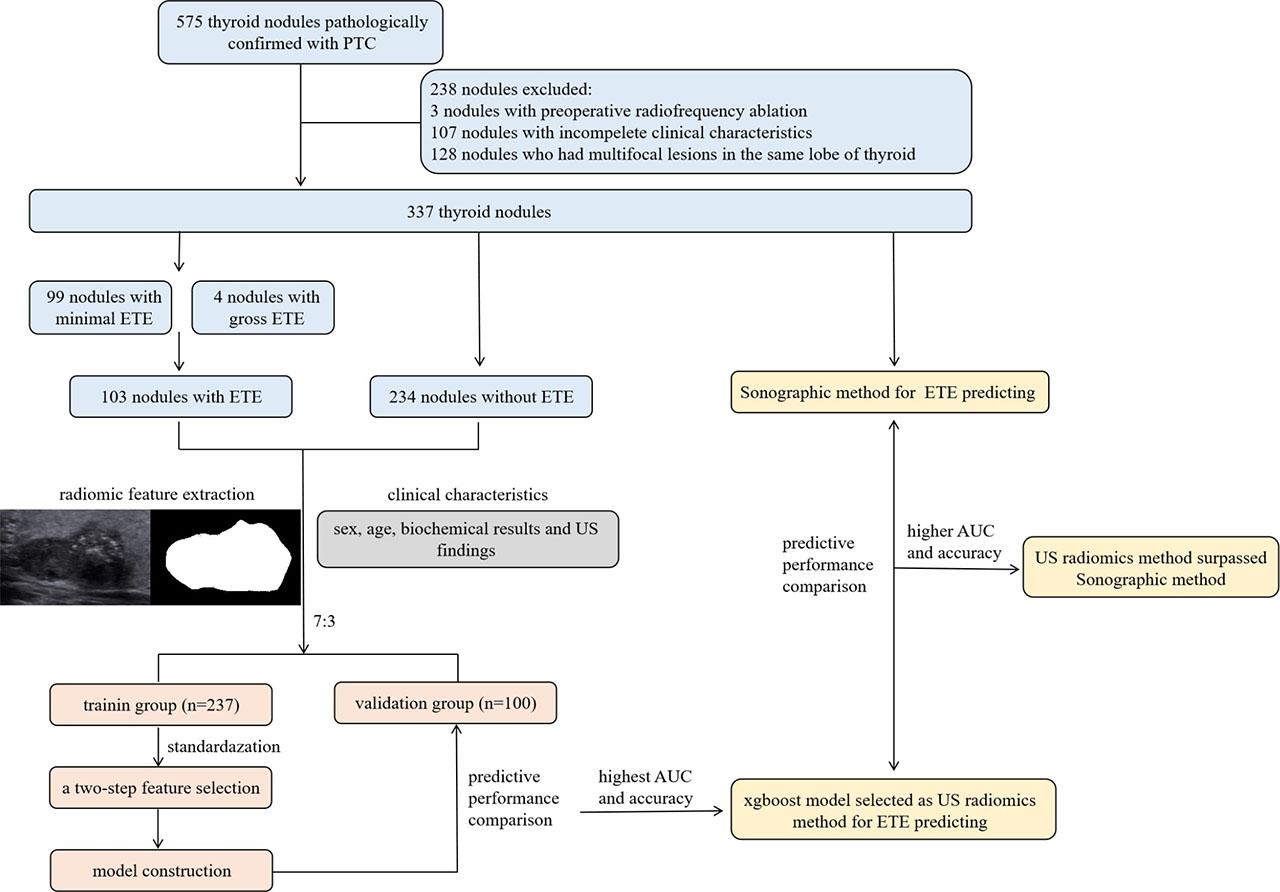
Figure 2.
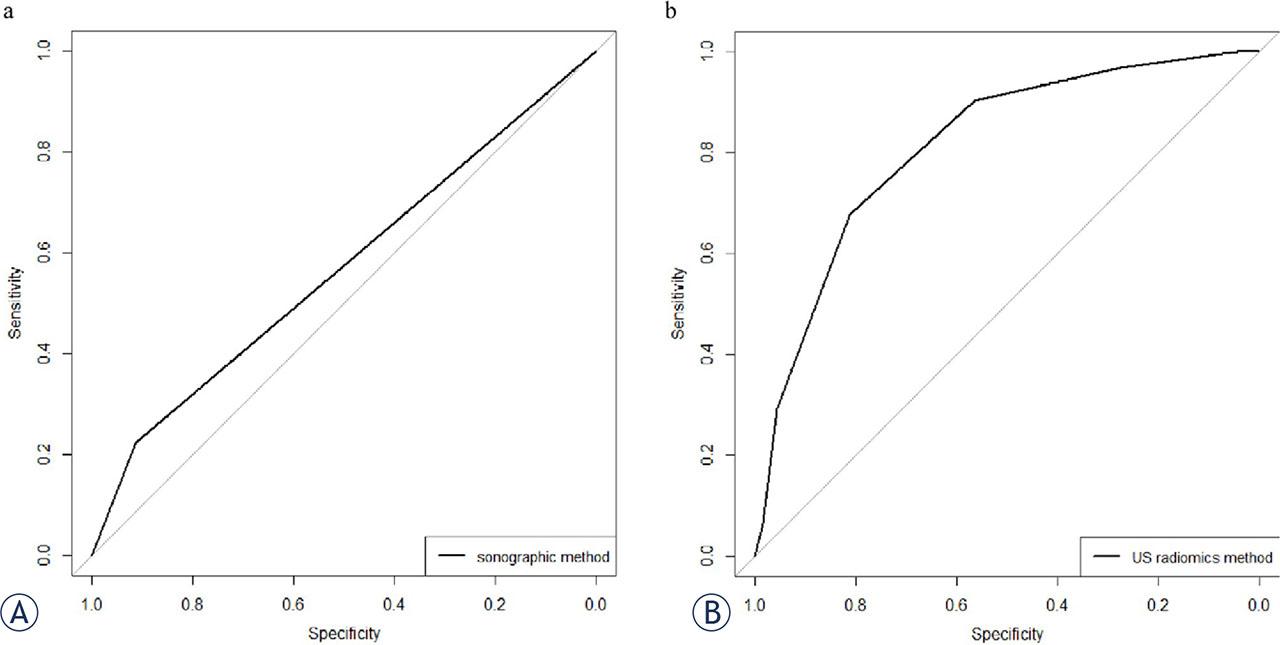
Figure 3.
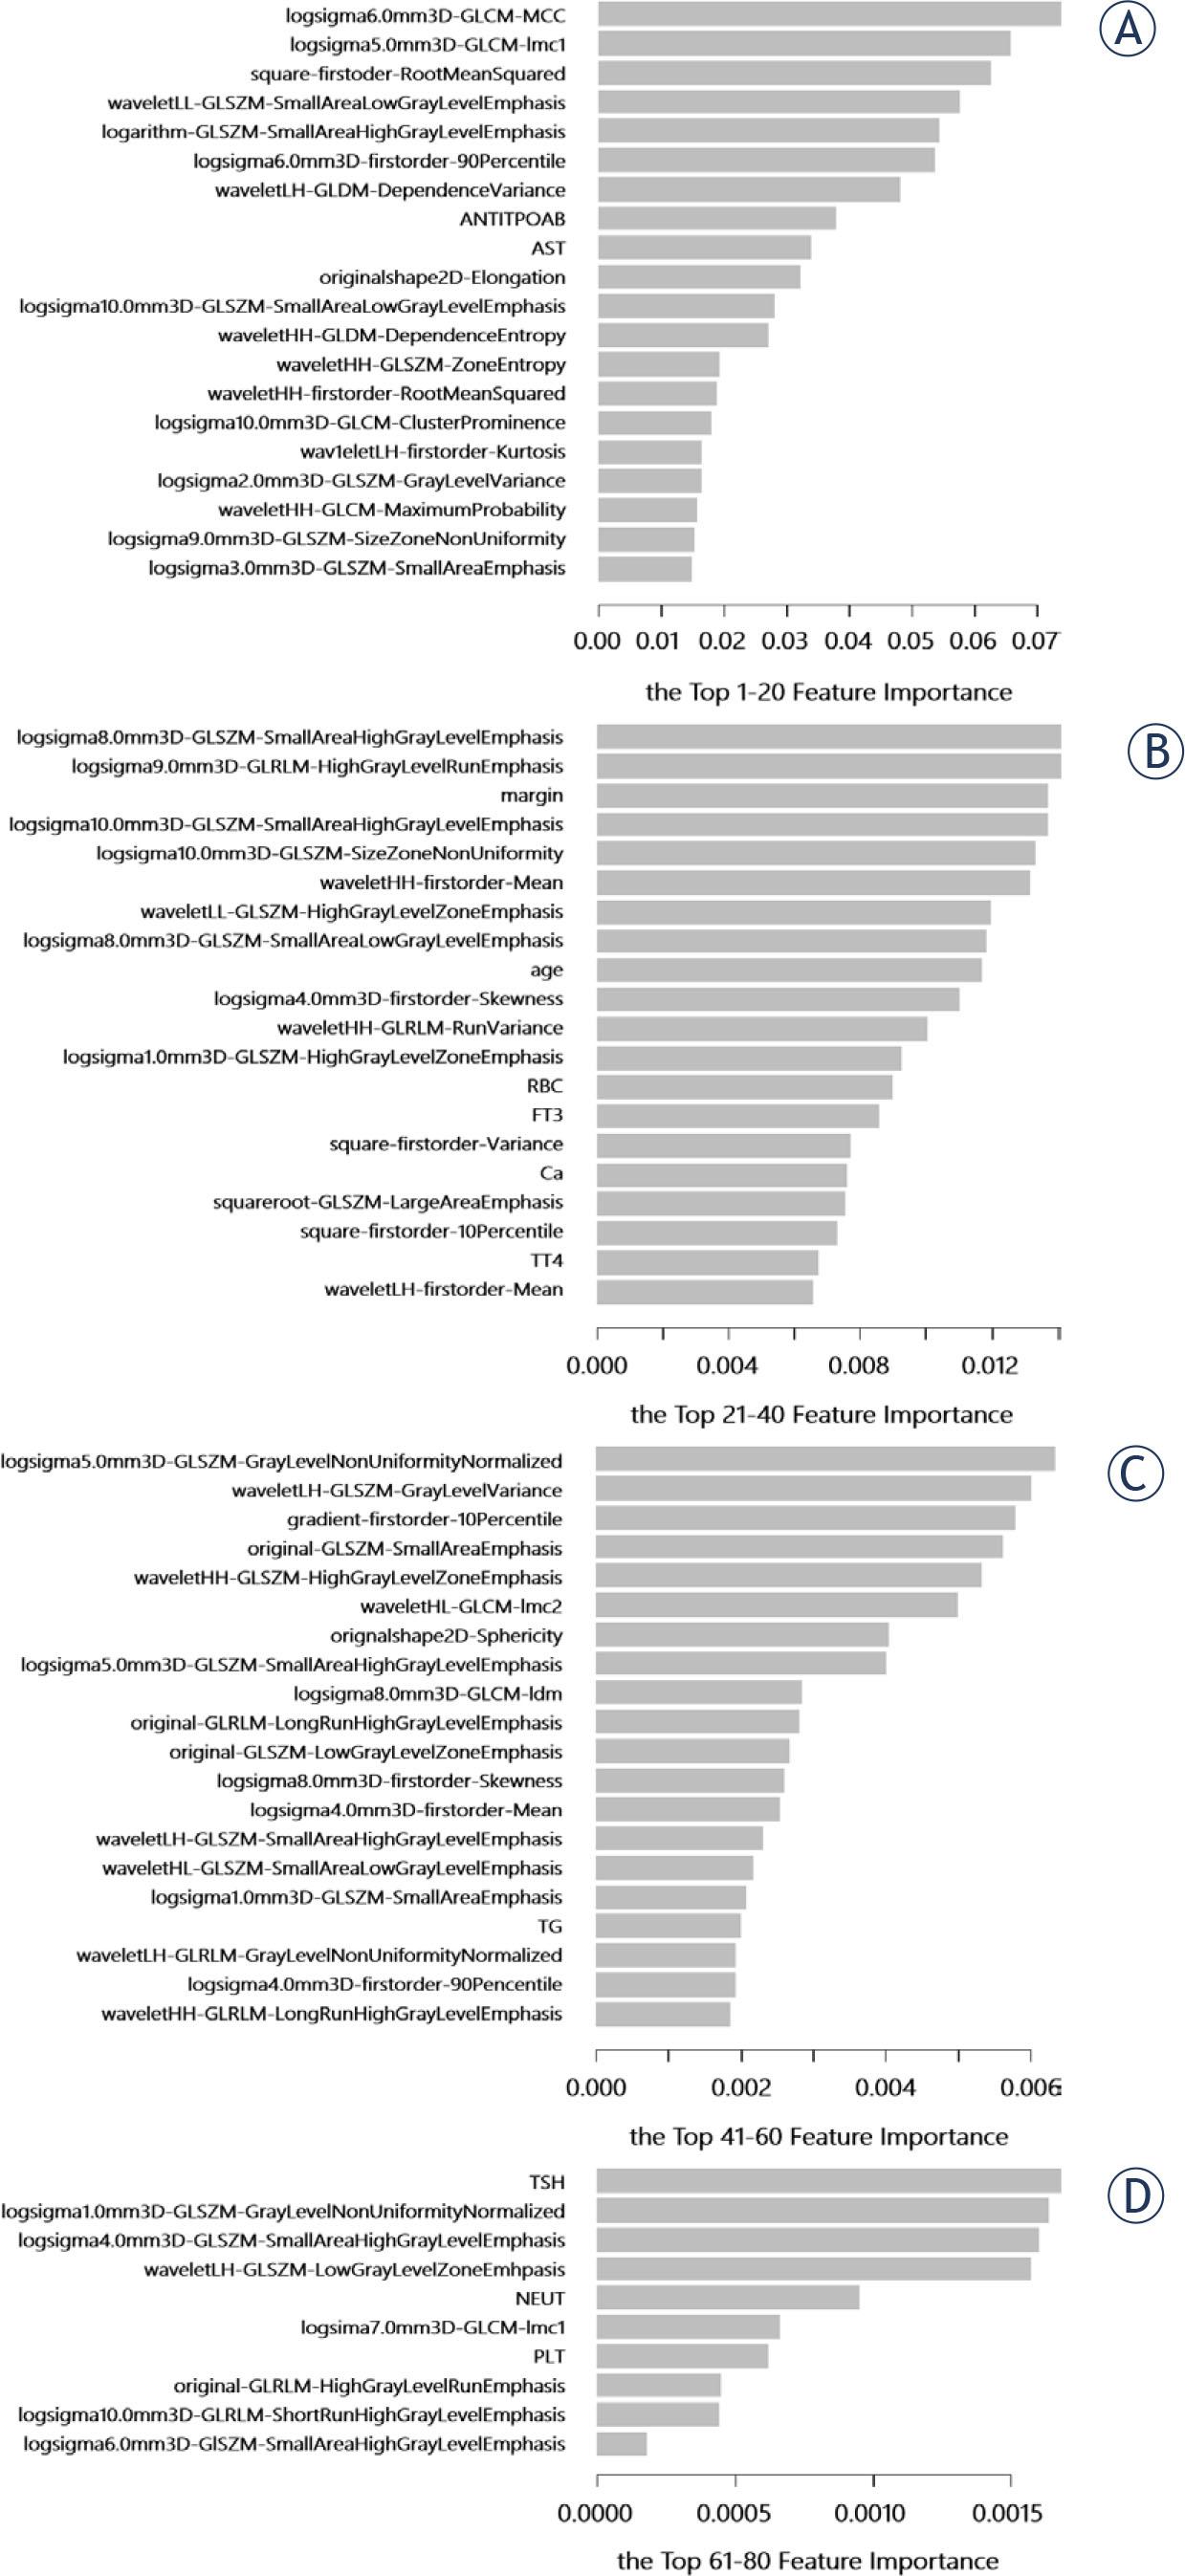
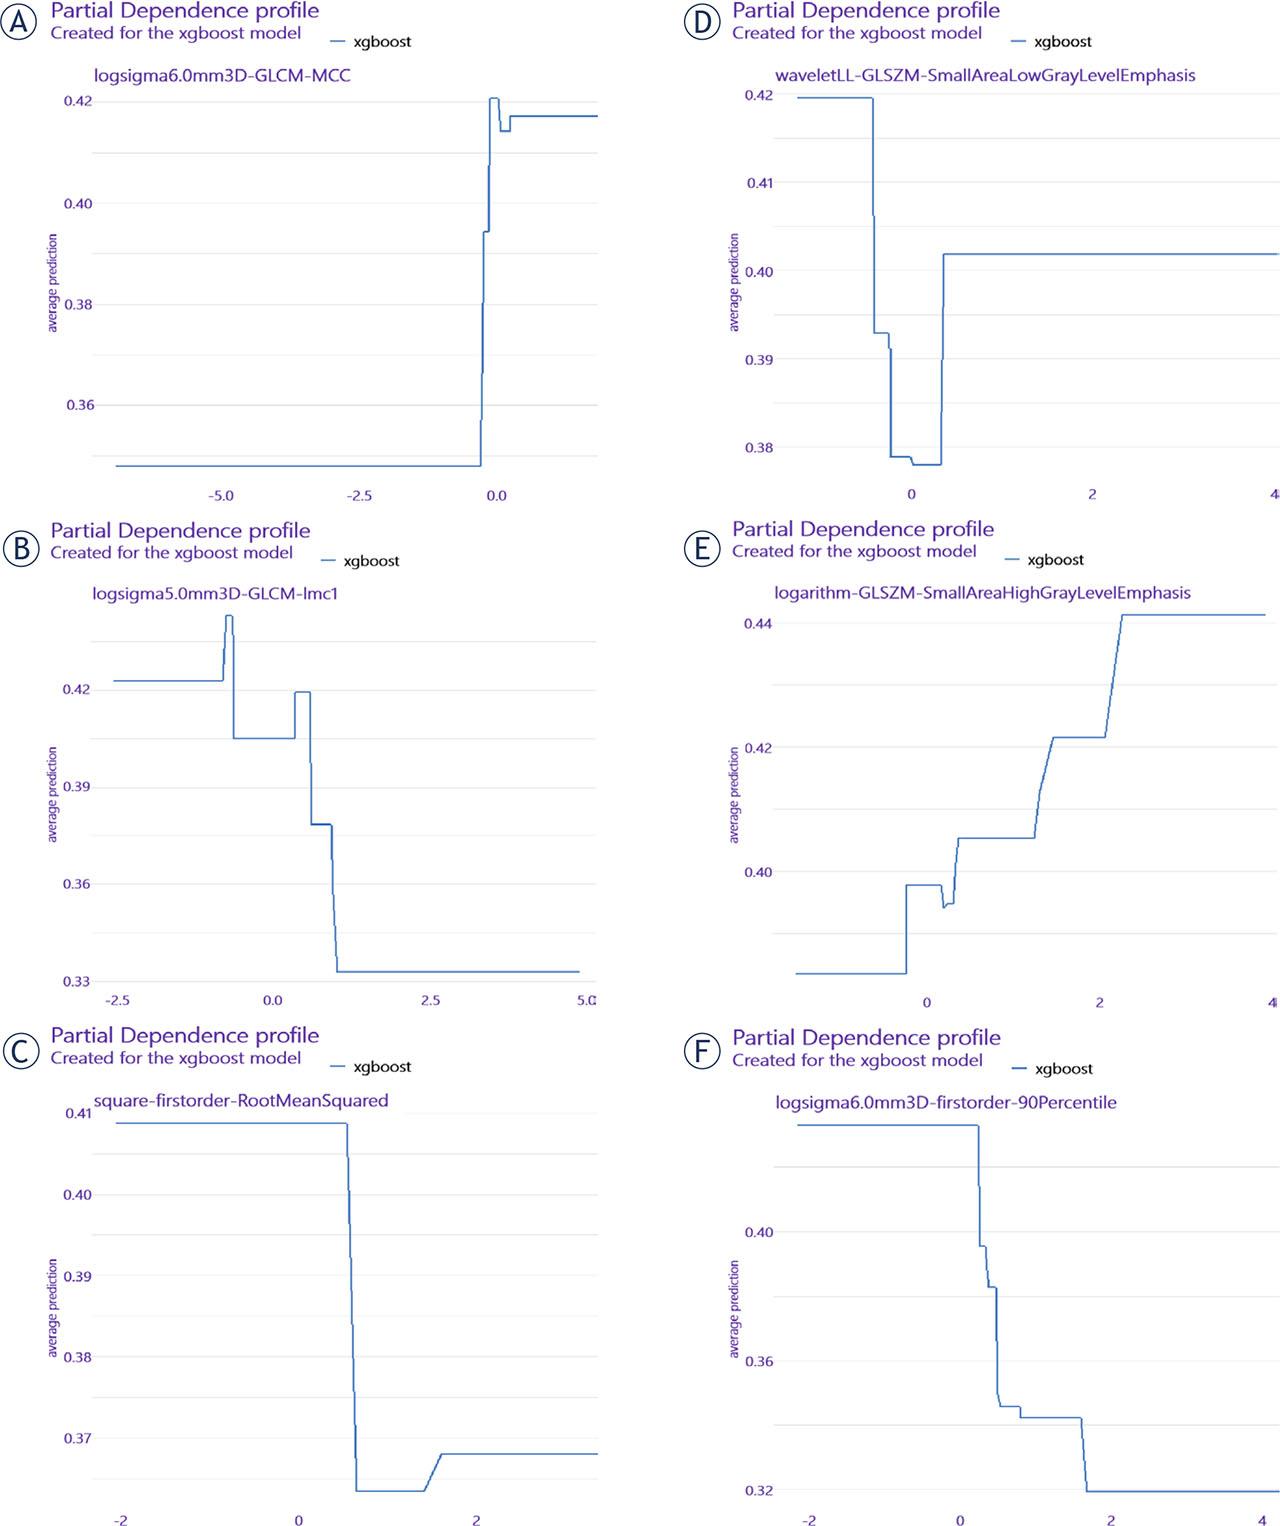
Figure 4.
Comparison of predictive performance for models and sonographic method for extrathyroidal extension predicting
| Model | Accuracy (95% CI) | Sensitivity | Specificity | PPV | NPV | AUC | p-value |
|---|---|---|---|---|---|---|---|
| xgboost | 0.77(0.6751–0.8483) | 0.6774 | 0.8116 | 0.6176 | 0.8485 | 0.813 | - |
| RF | 0.73(0.6320–0.8139) | 0.3548 | 0.8986 | 0.6111 | 0.7561 | 0.741 | 0.000006 |
| GBM | 0.75(0.6534–0.8312) | 0.5164 | 0.8551 | 0.6154 | 0.7973 | 0.737 | 0.000012 |
| binary LR | 0.74(0.6427–0.8226) | 0.6774 | 0.7681 | 0.5676 | 0.8413 | 0.730 | 0.000237 |
| NB | 0.55(0.4473–0.6497) | 0.9355 | 0.3768 | 0.4028 | 0.9286 | 0.656 | 0.000000 |
| DT | 0.68(0.5792–0.7698) | 0.3871 | 0.8116 | 0.4800 | 0.7467 | 0.634 | 0.000000 |
| adaboost | 0.71(0.6107–0.7964) | 0.3548 | 0.8696 | 0.5500 | 0.7500 | 0.612 | 0.000000 |
| SVM | 0.70(0.6002–0.7876) | 0.2903 | 0.8841 | 0.5294 | 0.7349 | 0.567 | 0.000000 |
| KNN | 0.69(0.5897–0.7787) | 0.1935 | 0.9130 | 0.5000 | 0.7159 | 0.553 | < 2.2x10^-16 |
| Sonographic method | 0.70(0.6514–0.7515) | 0.5349 | 0.7279 | 0.2233 | 0.9145 | 0.569 | < 2.2x10^-16 |
Characteristics of nodules in training and validation groups
| Characteristics | Training group (n = 237) | Validation group (n = 100) | p-value |
|---|---|---|---|
| Sex | 0.708 | ||
| Male | 64 (27.00) | 29 (29.00) | |
| Female | 173 (73.00) | 71 (71.00) | |
| Age (years)a | 45.97 ± 11.92 | 46.70 ± 11.64 | 0.606 |
| Size (mm) | 9.69 ± 6.08 | 10.62 ± 7.60 | 0.550 |
| WBC (×10^9/L) | 5.96 ± 1.52 | 6.12 ± 1.45 | 0.241 |
| NEUT (×10^9/L) | 3.65 ± 1.26 | 3.75 ± 1.18 | 0.326 |
| LYM (×10^9/L) | 1.89 ± 0.56 | 1.91 ± 0.62 | 0.716 |
| HB (g/L) | 138.39 ± 16.01 | 141.70 ± 15.13 | 0.094 |
| RBC (×10^12/L) | 4.69 ± 0.46 | 4.70 ± 0.45 | 0.752 |
| PLT (×10^9/L) | 252.85 ± 58.65 | 255.70 ± 64.90 | 0.656 |
| ALT (U/L) | 23.50 ± 19.98 | 24.15 ± 18.41 | 0.280 |
| AST (U/L) | 21.53 ± 7.86 | 21.48 ± 7.68 | 0.696 |
| ALB (g/L) | 45.15 ± 3.19 | 44.93 ± 3.01 | 0.473 |
| BUN (mmol/L) | 4.83 ± 1.27 | 4.93 ± 1.29 | 0.391 |
| CREA (umol/L) | 58.14 ± 13.36 | 57.54 ± 12.82 | 0.489 |
| UA (umol/L) | 315.27 ± 82.01 | 325.80 ± 86.12 | 0.261 |
| Ca (mmol/L) | 2.40 ± 0.11 | 2.41 ± 0.10 | 0.460 |
| TT3 (ng/ml) | 1.10 ± 0.31 | 1.09 ± 0.18 | 0.828 |
| TT4 (μg/dl) | 8.32 ± 1.72 | 8.09 ± 1.62 | 0.329 |
| FT3 (pg/ml) | 3.36 ± 1.16 | 3.33 ± 0.41 | 0.346 |
| FT4 (ng/dl) | 1.30 ± 0.26 | 1.29 ± 0.20 | 0.829 |
| TSH (μIU/ml) | 1.66 ± 0.99 | 1.96 ± 1.38 | 0.090 |
| ANTITGAB (IU/ml) | 122.12 ± 325.06 | 114.13 ± 349.18 | 0.335 |
| ANTITPOAB (IU/ml) | 41.11 ± 101.64 | 52.08 ± 124.91 | 0.912 |
| TG (ng/ml) | 36.10 ± 72.10 | 42.00 ± 84.61 | 0.886 |
| Urinary leukocyteb | 0.412 | ||
| Negative | 188 (79.32) | 87 (87.00) | |
| Positive 1+ | 19 (8.02) | 5 (5.00) | |
| Positive 2+ | 17 (7.17) | 3 (3.00) | |
| Positive 3+ | 10 (4.22) | 3 (3.00) | |
| Positive 4+ | 10 (4.22) | 2 (2.00) | |
| URBCb | 0.144 | ||
| Negative | 208 (87.76) | 89 (89.00) | |
| Positive 1+ | 21 (8.86) | 6 (6.00) | |
| Positive 2+ | 6 (2.53) | 1 (1.00) | |
| Positive 3+ | 0 (0) | 2 (2.00) | |
| Positive 4+ | 2 (0.84) | 2 (2.00) | |
| Urinary proteinb | 0.524 | ||
| Negative | 145 (61.18) | 64 (64.00) | |
| Positive 1+ | 63 (26.58) | 28 (28.00) | |
| Positive 2+ | 29 (12.24) | 8 (8.00) | |
| Compositionb | 1.000 | ||
| Predominately cystic | 2 (0.84) | 0 (0) | |
| Predominately solid | 235 (99.16) | 100 (100.00) | |
| Solid | 0 (0) | 0 (0) | |
| Echogenicityb | 0.966 | ||
| Hyperechoic or isoechoic | 8 (3.38) | 3 (3.00) | |
| Hypoechoic | 191 (80.59) | 82 (82.00) | |
| Markedly hypoechoic | 38 (16.03) | 15 (15.00) | |
| Shapeb | 0.974 | ||
| Wider-than-tall | 100 (42.19) | 42 (42.00) | |
| Taller-than-wide | 137 (57.81) | 58 (58.00) | |
| Marginb | 0.083 | ||
| Smooth or ill-defined | 143 (60.34) | 54 (54.00) | |
| Lobulated or irregular | 70 (29.54) | 27 (27.00) | |
| Extrathyroidal extension | 24 (10.13) | 19 (19.00) | |
| Echogenic focib | 0.465 | ||
| No calcification | 68 (28.69) | 20 (20.00) | |
| Macrocalcifications | 63 (26.58) | 23 (23.00) | |
| Peripheral calcifications | 6 (2.53) | 2 (2.00) | |
| Microcalcifications | 147 (62.03) | 72 (72.00) | |
| TI-RADS classificationb | 1.000 | ||
| III | 1 (0.42) | 0 (0) | |
| IV | 19 (8.02) | 8 (8.00) | |
| V | 216 (91.14) | 92 (92.00) | |
| ETE | 0.910 | ||
| Negative | 165 (69.62) | 69 (69.00) | |
| Positive | 72 (30.38) | 31 (31.00) |