FIGURE 1.
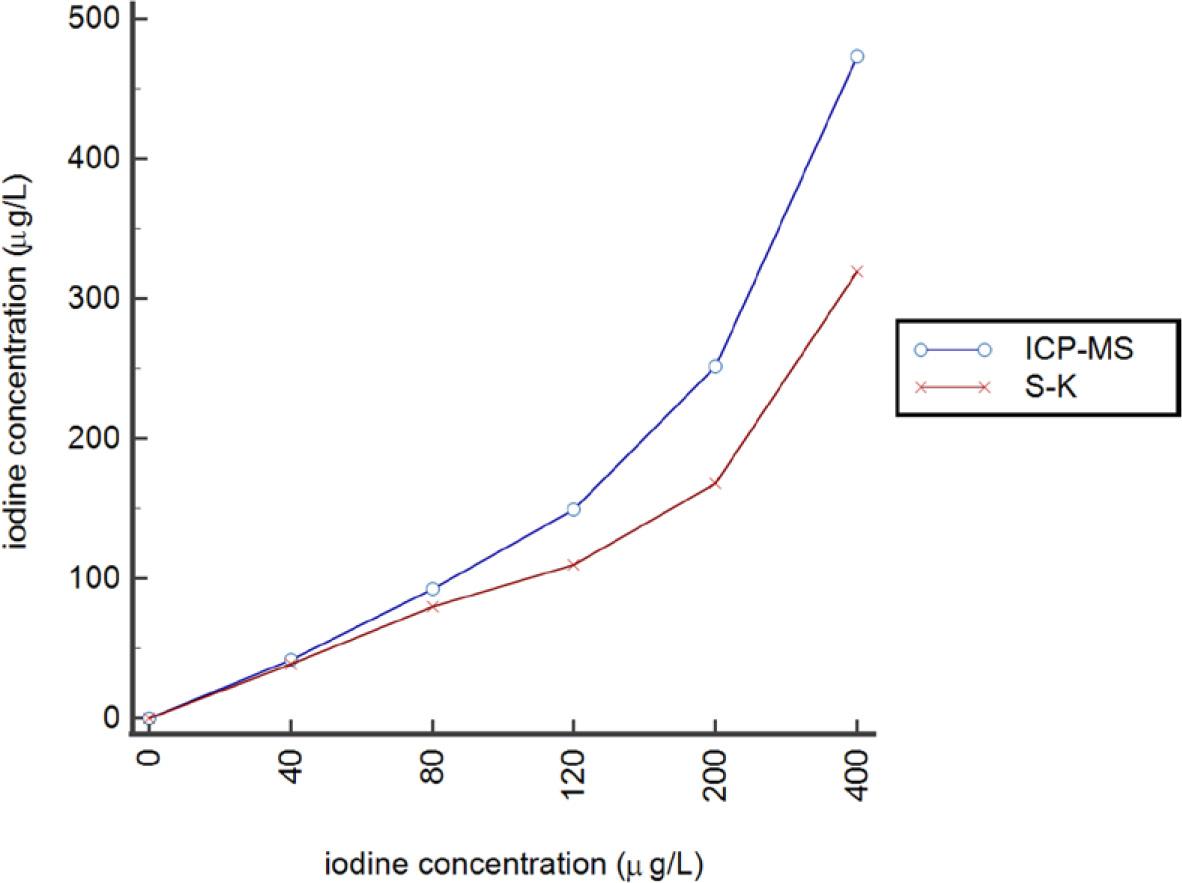
FIGURE 2.
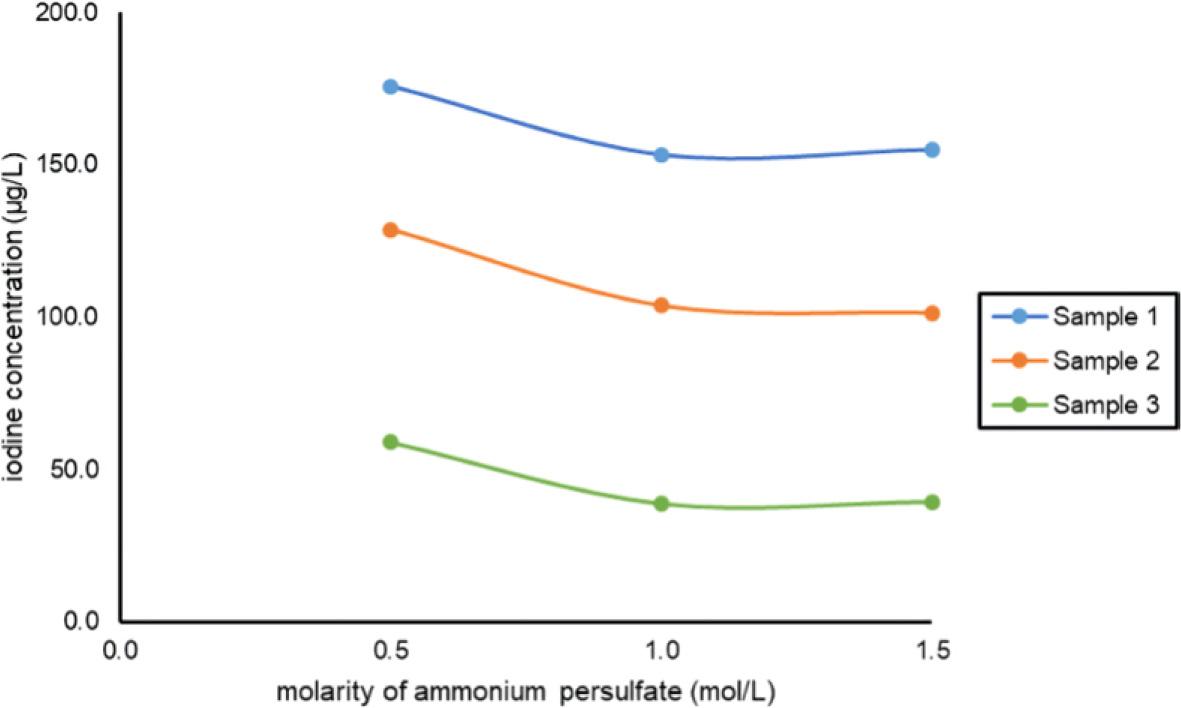
FIGURE 3.
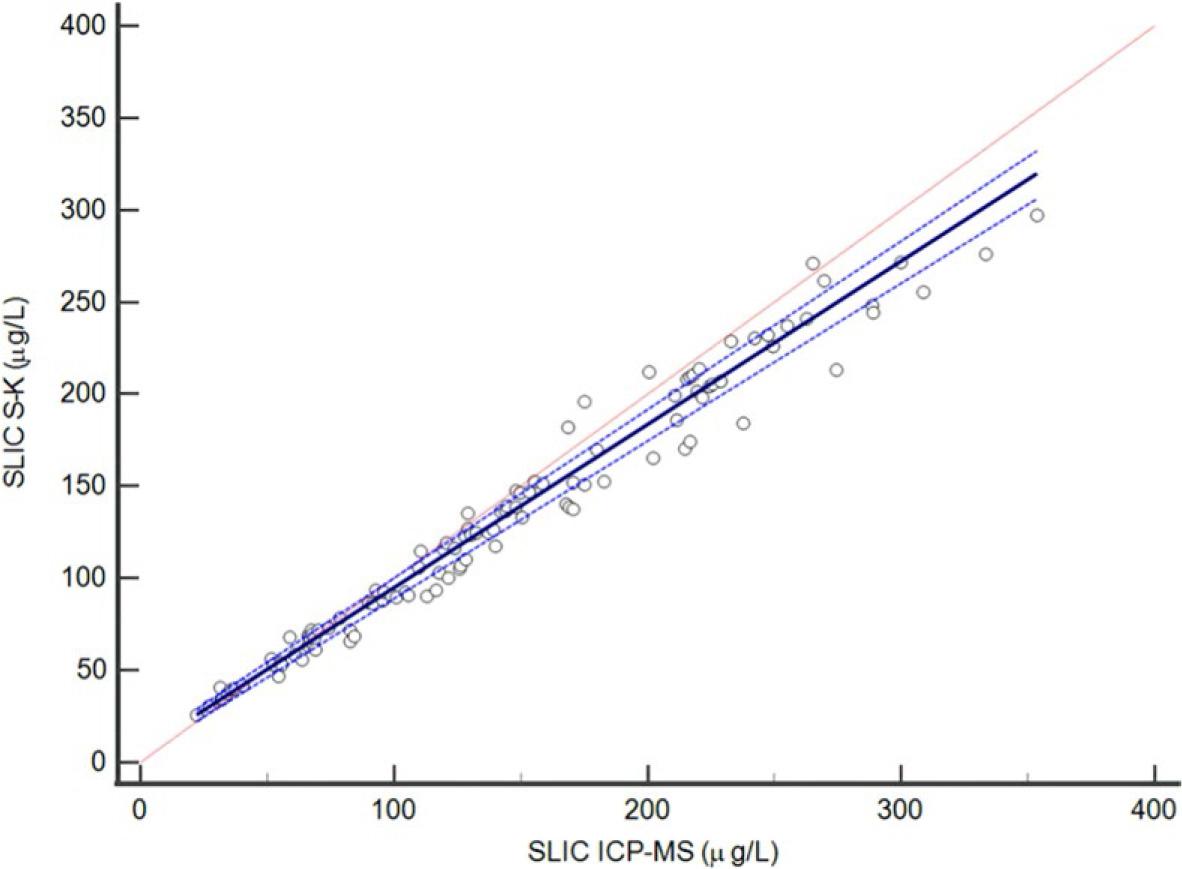
FIGURE 4.
Recoveries of 6 different saliva samples spiked with 19_6, 38_5, 74_1, and 193_5 mg/L of stock solutions of potassium thiocyanate and of caffeine to saliva samples_ Recoveries are expressed as percentages of observed amount of iodine over expected amount of iodine after thiocyanate or caffeine stock solutions added to samples_ Each sample was measured 8 times and results are presented as mean salivary iodine concentration (SLIC) (SD) and as the mean percentage recovery (range) of iodine at each concentration level
| Thiocyanate | Caffeine | |||
|---|---|---|---|---|
| SLIC, μg/L (SD) | Recovery, % (range) | SLIC, μg/L (SD) | Recovery, % (range) | |
| Sample 1 | 34.7 (3.0) | 97.9 (97.3–100.5) | 29.1 (1.0) | 93.2 (90.7–96.3) |
| Sample 2 | 86.0 (7.4) | 101.2 (99.0–102.8) | 73.0 (1.6) | 99.3 (97.0–100.9) |
| Sample 3 | 90.7 (3.7) | 102.4 (99.0–105.0) | 75.2 (1.9) | 96.1 (92.0–100.4) |
| Sample 4 | 109.0 (3.9) | 109.0 (95.9–104.9) | 101.3 (3.8) | 96.3 (94.1–99.0) |
| Sample 5 | 143.0 (2.2) | 106.2 (103.8–108.7) | 142.1 (2.5) | 98.7 (96.1–105.3) |
| Sample 6 | 150.6 (3.3) | 102.4 (98.2–107.7) | 152.8 (3.0) | 99.3 (97.3–101.3) |
Dilutions of 4 saliva samples with deionised water_ Each sample was measured 8 times and results are presented as mean measured concentration (SD)_ Recoveries are expressed as the percentages of mean measured amount of iodine over expected amount of iodine after dilution
| Dilution | Measured (M) μg/L (SD) | Expected (E) μg/L | M/E % | |
|---|---|---|---|---|
| Sample 1 | Non-diluted | 105.7 (1.3) | / | / |
| 1:2 | 56.9 (1.3) | 52.9 | 107.7 | |
| 1:4 | 28.8 (2.0) | 26.4 | 109 | |
| Sample 2 | Non-diluted | 35.6 (1.0) | / | / |
| 1:2 | 19.2 (1.4) | 17.8 | 108.2 | |
| Sample 3 | Non-diluted | 76.7 (1.3) | / | / |
| 1:2 | 40.2 (1.7) | 38.4 | 104.8 | |
| 1:4 | 17.3 (1.2) | 19.2 | 90.3 | |
| Pooled sample | Non-diluted | 165.1 (5.4) | / | / |
| 1:2 | 65.0 (3.6) | 61.9 | 105.0 | |
| 1:4 | 33.8 (1.7) | 31.0 | 109.1 | |
| 1:8 | 17.2 (1.6) | 15.5 | 111.1 |
Coefficients of variation (CV [%]) for intra- and inter-assay for 4 different iodine concentrations for salivary iodine concentration (SLIC)
| Level | Target value, μg/L | Number of measurements | Intra-assay imprecision, % | Number of measurements | Inter-assay imprecision, % |
|---|---|---|---|---|---|
| 1 | 20 | 40 | 18.4 | 198 | 20.7 |
| 2 | 100 | 40 | 5.1 | 192 | 6.7 |
| 3 | 350 | 40 | 2.8 | 121 | 4.3 |
| Pooled sample | 165 | 40 | 5.7 | 80 | 5.1 |