FIGURE 1.
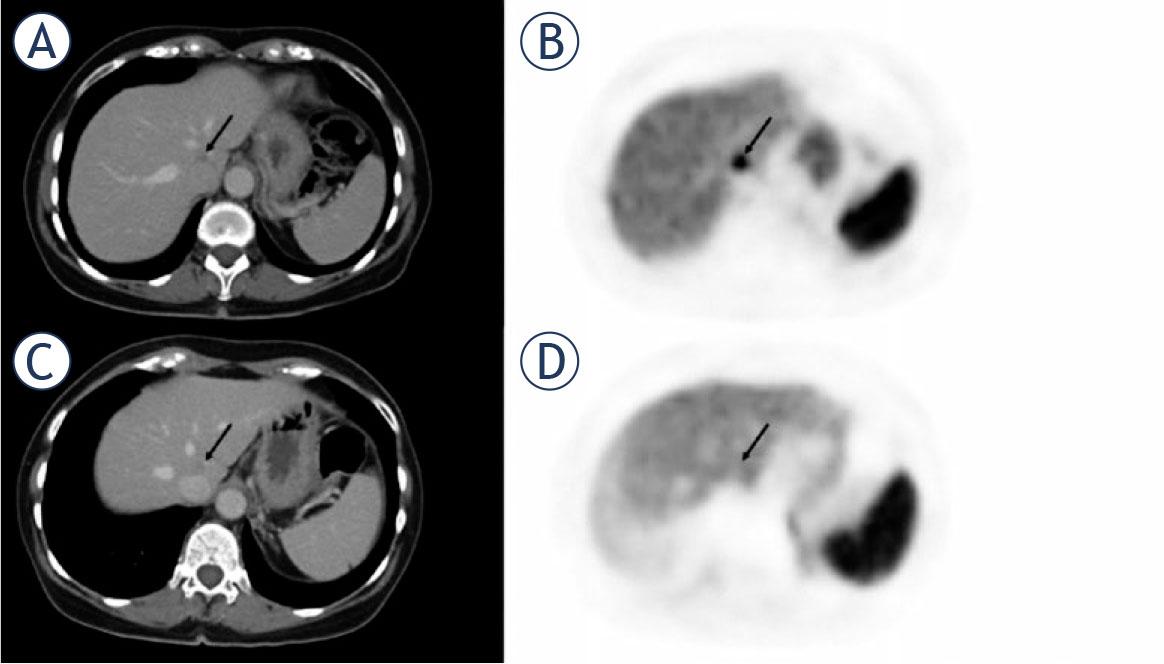
FIGURE 2.
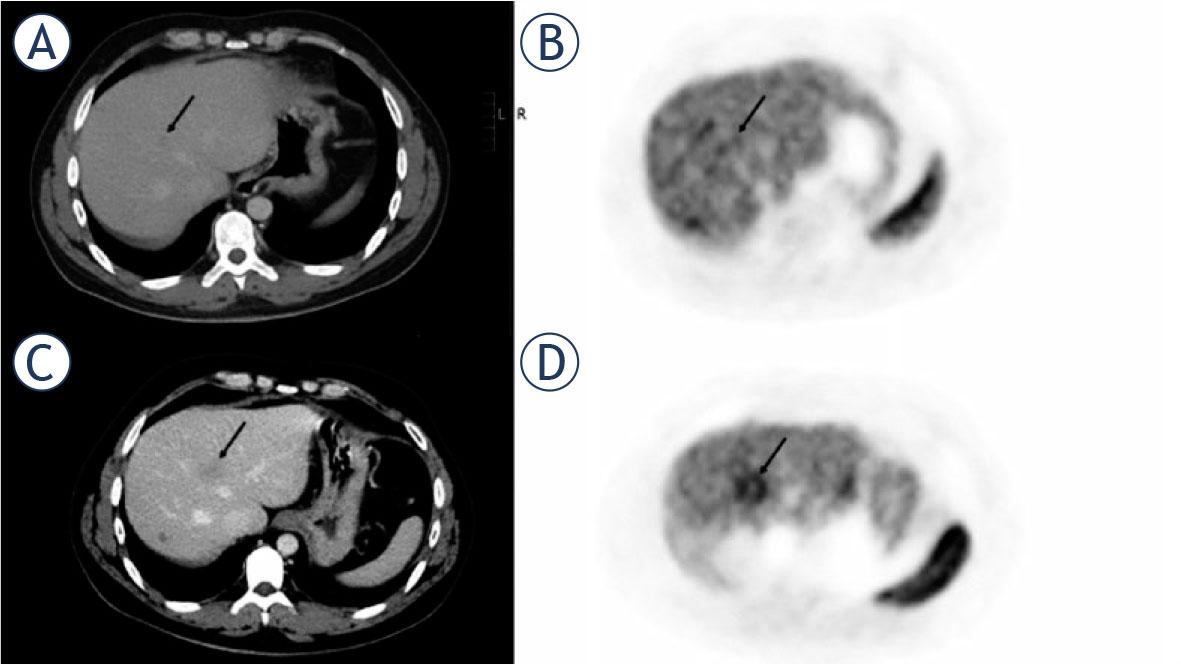
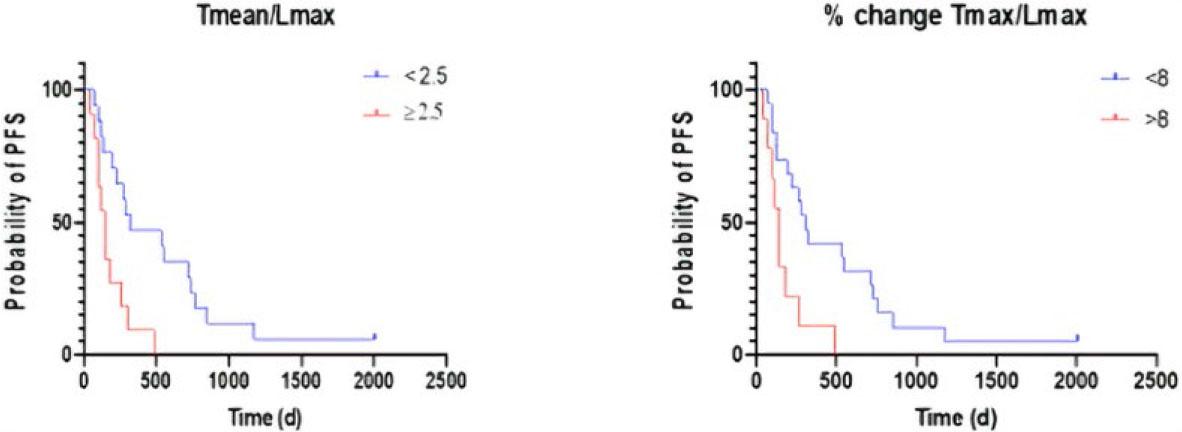
FIGURE 3.
Clinical and imaging parameters at baseline and follow-up with changes
| Responder | Pre- vs. Post-therapy | Non-responder | p-value | R vs. NR Pre-treatment | R vs. NR Post-treatment | |||
|---|---|---|---|---|---|---|---|---|
| Pre-treatment | Post-treatment | p | Pre-treatment | Post-treatment | p | p | ||
| Clinical parameters | ||||||||
| Age | 63.5 +- 12.5 | 62.4 +- 13.4 | 0.42 | |||||
| Sex (male) | 10 (45%) | 7 (37%) | 0.2 | |||||
| Ki-67 % | 7.9 (+- 7.8) | 10.5 (+-7) | 0.28 | |||||
| Pre Bilirubin | 0.6 (0.2) | 0.7 (0.3) | 0.13 | |||||
| Pre CgA | 551 (77.6–933.5) | 422 (47–1414) | 0.11 | |||||
| Imaging parameters | ||||||||
| SUVmax Liver | 8 (6–9.3) | 9.4 (5–10.9) | 0.17 | 6.9 (4.9–9.2) | 6.4 (3.5–10) | 0.05 | 0.6 | 0.1 |
| SUVmean Spleen | 12.3 (9.9–18.6) | 16.4 (9.9–20.1) | 0.02 | 13.8 (10.1–16.9) | 11 (9.8–15.1) | 0.04 | 0.3 | 0.5 |
| SUVmax LM | 28.1 (15.1–35.3) | 22.2 (14.2–31.7) | < 0.01 | 21.3 (12.7–34.7) | 22.5 (9.4–29.6) | 0.19 | 0.3 | 0.6 |
| SUVmean LM | 12.4 (10.5–19.1) | 12.9 (9.3–18.9) | 0.03 | 14.5 (9.3–18.3) | 13.5 (7.8–17.4) | 0.13 | 0.4 | 0.5 |
| Tmax/Lmax LM | 3.0 (2.4–4.3) | 2.4 (2–3.3) | 0.02 | 2.8 (2.4–3.8) | 3 (1.9–4.6) | 0.36 | 0.3 | 0.8 |
| Tmean/Lmax LM | 1.8 (1.4–2.3) | 1.6 (1.2–1.9) | 0.02 | 1.9 (1.2–2.2) | 1.6 (1.4–2.5) | 0.26 | 0.2 | 0.7 |
| Tmax/Smean LM | 1.6 (1.3–2.4) | 1.3 (0.9–1.7) | 0.25 | 1.5 (1.2–2.3) | 1.5 (0.9–3.0) | 0.3 | 0.4 | 0.8 |
| Tmean/Smean LM | 1.0 (0.8–1.1) | 0.8 (0.5–1.0) | 0.49 | 0.9 (0.6–1.6) | 0.9 (0.5–1.6) | 0.46 | 0.5 | 1.0 |
| Size LM | 21 (17–29) | 20 (15–31.2) | 0.64 | 21 (15–32) | 21 (15–32) | 0.95 | 0.7 | 0.5 |
| Density LM (HU) | 101.9 (± 19.9) | 90.5 (± 20.5) | 0.03 | 89.4 (± 22.6) | 81.7 (± 22.1) | 0.1 | 0.2 | 0.3 |
| SUVmax NET | 32.8 (6.9–39.8) | 30.4 (10.3–31.5) | 0.49 | 36.4 (28.8–47.4) | 43.1 (29.7–53.7) | 0.97 | 0.5 | 0.3 |
| SUVmean NET | 16 (4.6–16.9) | 13.4 (7.1–14.7) | 0.9 | 17.6 (14–19.4) | 22.3 (13.6–28.5) | 0.25 | 0.4 | 0.3 |
| Size NET | 18 (15-36) | 25 (11.2–37.3) | 0.48 | 43.5 (24–60.8) | 44.5 (25.3–66) | 0.37 | 0.7 | 0.5 |
| Density NET | 83.3 (± 9.1) | 81.5 (± 18) | 0.9 | 89.3 (± 17.5) | 78.2 (± 11.6) | 0.4 | 0.6 | 0.8 |
| Change (%) between pre- and post-treatment | Responder | Non-responder | R vs. NR p | |||||
| SUVmax Liver | −9.5 (−14–19.9) | −13 (−37.5–8.7) | 0.04 | |||||
| SUVmean Spleen | 13 (−6.6–29.1) | −10.7 (−26.3–2.6) | 0.01 | |||||
| SUVmax LM | −20.4 (−27–6) | −0.9 (−22.8–26.3) | 0.21 | |||||
| SUVmean LM | −10 (−28.5–12.7) | −7 (−23.4–11.1) | 0.62 | |||||
| Tmax/Lmax LM | −15.5 (−47–5.5) | 5.5 (−20.4–20.7) | 0.01 | |||||
| Tmean/Lmax LM | −16.3 (−37–9) | 7 (−22.3–31.1) | 0.03 | |||||
| Tmax/Smean LM | −16.6 (−44.2–13.6) | 4.5 (−16.8–51.4) | 0.01 | |||||
| Tmean/Smean LM | −16.3 (−39.3–8.8) | 0.9 (−17.4–50) | 0.04 | |||||
| Size LM | −7 (−27.8–6.1) | 14.3 (−17.6–28) | 0.77 | |||||
| Density LM | −5.6 (−12.3–0.2) | −7 (−16.5–4.1) | 0.8 | |||||
| SUVmax NET | −7.3 (−16.2–35.5) | −18.1 (−41.6–25.6) | 0.77 | |||||
| SUVmean NET | 15.6 (−0.6–48) | 18.4 (−7.8–40.5) | 0.65 | |||||
| Size NET | −15.9 (−37.4–11.1) | 3.6 (−2.1–13.3) | 0.72 | |||||
| Density NET | −5.2 (−20–14.5) | −18.3 (−22.9– −4.6) | 0.69 | |||||
| Bilirubin | −33 (−61.7–0) | −25 (−66.7–0) | 0.43 | |||||
| CgA | 56.4 (17.4–144.9) | 32.1 (−2.8–72.8) | 0.18 | |||||
Patients demographics
| Sex (male) | 17 (59%) |
| Age (mean + SD ) | 63 ± 13.2 |
| Grading | |
| G1 | 7 (24%) |
| G2 | 20 (69%) |
| G3 | 1 (3%) |
| n/a | 1 (3%) |
| Ki-67 (mean + SD) | 9.1 ± 7.6 |
| Primary tumor site | |
| Pancreas | 11 (38%) |
| Stomach | 1 (3%) |
| Liver | 1 (3%) |
| Lung | 1 (3%) |
| Small-intestine | 11 (38%) |
| Kidney | 1 (3%) |
| Breast | 1 (3%) |
| Retroperitoneal | 1 (3%) |
| Rectum | 1 (3%) |
| Bilirubin prior to therapy (mg/dl) | 0.6 (0.3–1.3) |
| Bilirubin after therapy (mg/dl) | 0.5 (0.2–2.6) |
| Median CgA prior to therapy (ng/ml) (range) | 487 (10 –8983) |
| Median CgA after therapy (ng/ml) (range) | 929 (43–23348) |