
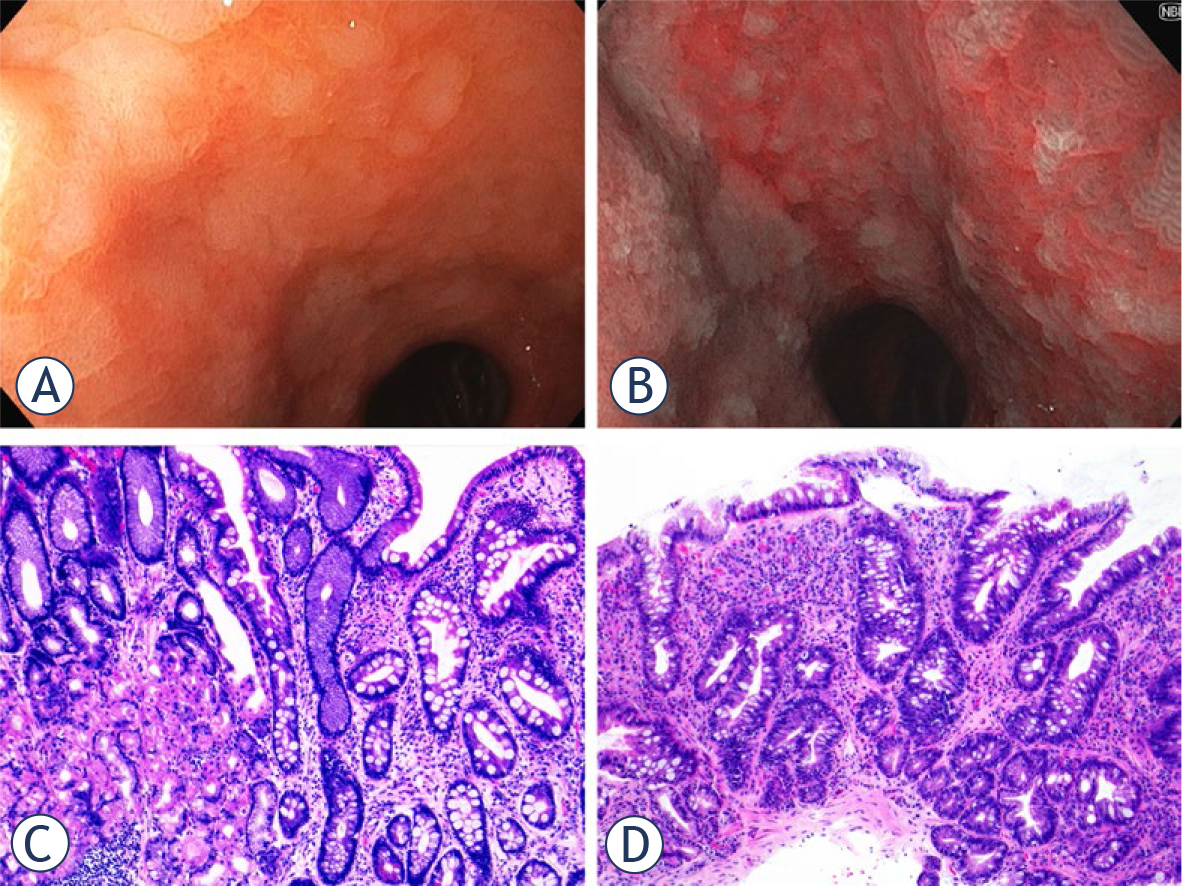
FIGURE 1.
Gastric intestinal metaplasia, endoscopic (A, B) and histological (C, D) appearance. Gastric intestinal metaplasia is endoscopically characterized by the presence of grey-white velvety or slightly nodular elevated patches, which are clearly demarcated against the surrounding pink gastric mucosa, as illustrated in image A of antral gastric mucosa under white light. Narrow band imaging (NBI, depicted in image B) further enhances the visualization of mucosal and vascular patterns by employing optical filters to narrow the bandwidth of light. This technique offers superior contrast compared to white light endoscopy, thereby improving the detection of metaplastic transformation. Histologically, gastric intestinal metaplasia can be classified into either complete (as seen in image C) or incomplete types (as shown in image D). Image C demonstrates preserved oxyntic mucosa (on the left) adjacent to intestinal metaplasia of the complete type, which features enterocytes with a well-defined brush border, alongside well-formed goblet cells and Paneth cells. In contrast, image D illustrates the intestinal metaplasia of the gastric mucosa of the incomplete type, characterized by goblet cells of variable size and intervening mucin-secreting columnar cells that lack a brush border (both images are hematoxylin and eosin-stained, original magnification 10x).
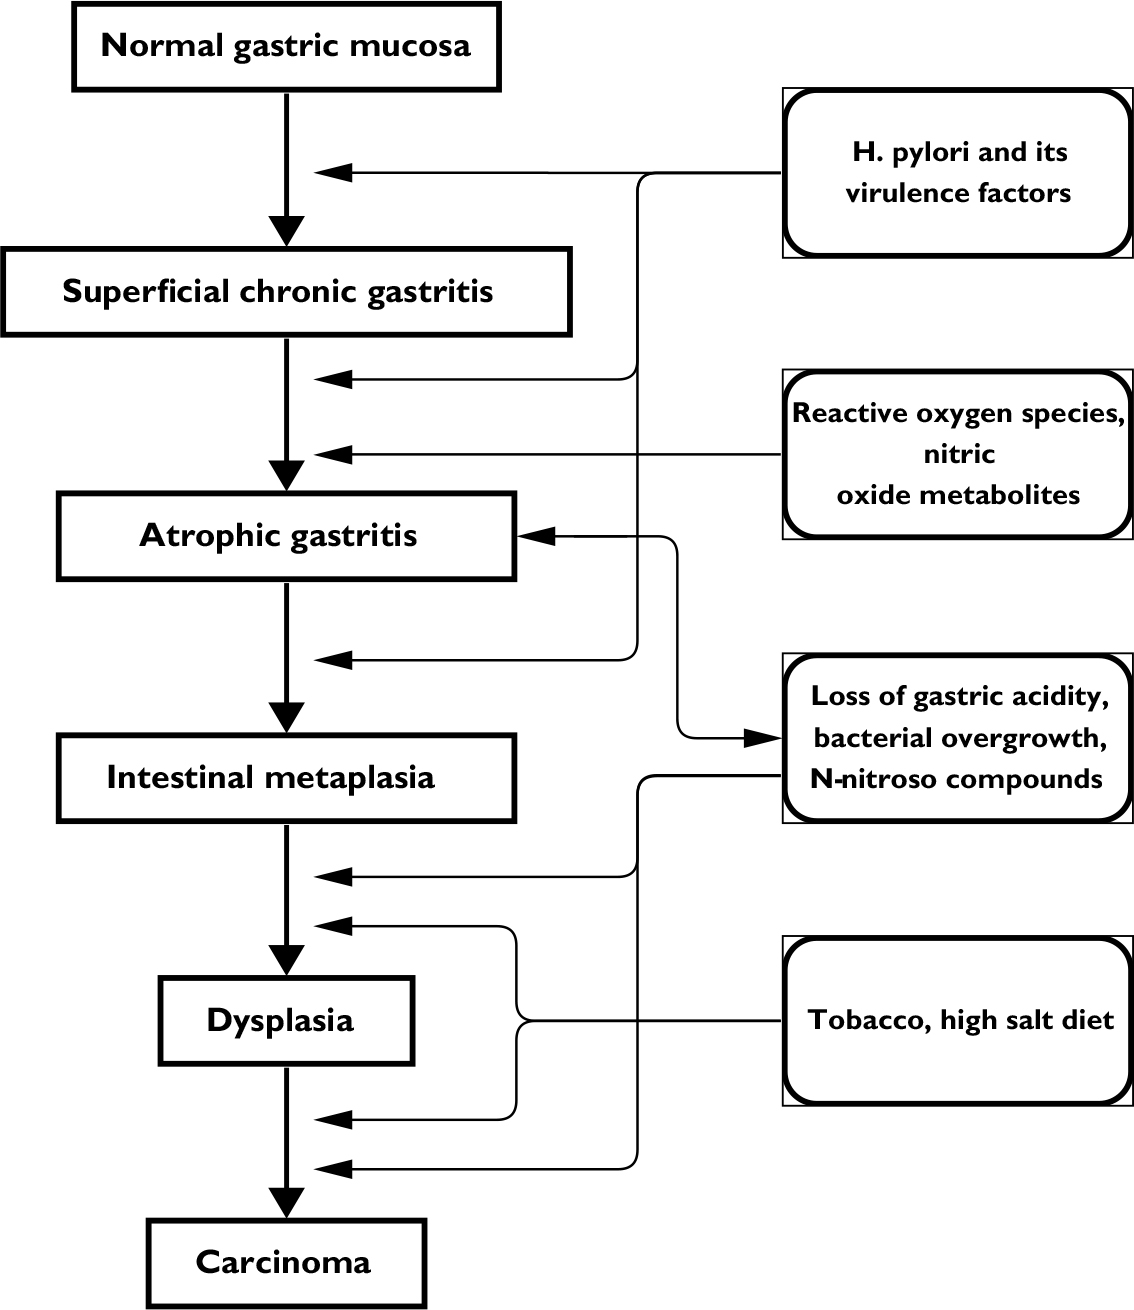
FIGURE 2.
Pathogenesis of intestinal metaplasia and gastric adenocarcinoma – the Corea cascade. This stepwise process starts with chronic gastritis triggered by H. pylori infection. The likelihood of developing gastric cancer is higher in individuals infected with virulent strains of H. pylori, unhealthy diets (rich in salt and smoked foods), low iron levels, and harmful lifestyle choices, including smoking. Persistent inflammation results in the damage and eventual loss of acid-producing parietal cells, causing reduced stomach acidity (hypochlorhydria) and eventually no stomach acid production (achlorhydria). This reduction in acidity allows for the colonization of the stomach by detrimental, pro-inflammatory microbiota. These bacteria can produce genotoxic and pro-inflammatory metabolites and carcinogens, directly contributing to the transformation of stomach epithelial cells into malignant cells.
TABLE 1.
Patients’ related predictive risk factors for gastric intestinal metaplasia
| Risk Factor | Odds ratio (OD) | Key findings | References |
|---|---|---|---|
| Race | |||
| White | 1 | Hispanic and Asian patients have an increased risk for GIM | Tan MC et al. (2022)94 |
| Asian | 2.83–3 | Akpoigbe K et al. (2022)95 | |
| Hispanic | 2.10–5.6 | ||
| Age (> 50 years) | 1.5–2.03 | Risk increases with age, possibly due to accumulated exposure to risk factors. | Aumpan N et al. (2021)96 |
| Tan MC et al. (2020)97 | |||
| Male gender | 1.55–2.09 | Probably due to genetics and exposure to other risk factors | Aumpan N et al. (2020)98 |
| Leung WK et al. (2005)99 | |||
| Chronic gastritis | 3.68–5.76 | Chronic inflammation is leads to IM. | Yoo YE et al. (2013)100 |
| Tatsuta M et al. (1993)101 | |||
| H. pylori infection | 2.47–3.65 | Strong correlation with IM, especially with CagA positive strains. | Aumpan N et al. (2021)96 |
| Nguyen T et al. (2021)102 | |||
| Family history of gastric cancer | 1.5–3.8 | Patients with a first-degree relative with gastric cancer have an increased risk of neoplastic progression | Nieuwenburg SAV et al. (2021)103 |
| Reddy KM et al. (2006)104 | |||
| Alcohol consumption | 1.27–1.54 | Alcohol intake was independently associated with increased risk of developing AG and IM | Holmes HM et al. (2021)105 |
| Kim K et al. (2020)106 | |||
| Tobacco smoking | 1.54–2.75 | Tobacco smoking is a risk factor for gastric IM. | Morais S et al. (2014)107 |
| Thrift AP et al. (2022)108 | |||
| Blood group A | 1.39–1.42 | Blood group A is associated with higher risk of GIM | Mao Y et al. (2019)109 |
| Rizatto C et al. (2013)110 | |||
| Bile reflux | unknown | Bile acids not only interefere with gastric mucosa but also regulate multiple carcinogenic pathways | Wang M et al. (2023)111 |
| Yu J et al. (2019)112 | |||
| Salt consumption | 0.37–1.53 | Salt intake may increase progression to advanced gastric precancerous lesions | Dias-Neto M et al. (2010)113 |
| Song JH et al. (2017)114 | |||
| Industrially processed food | unknown | Dietary exposure to N-nitroso–containing compounds has been shown to increase the promotion of gastric carcinogenesis | Wiseman M (2008)115 |
| Jencks DS et al. (2018)116 | |||